Green
Mapped: Air Pollution Levels Around the World in 2022
![]() Subscribe to the Elements free mailing list for more like this
Subscribe to the Elements free mailing list for more like this
Mapped: Air Pollution Levels Around the World
This was originally posted on Elements. Sign up to the free mailing list to get beautiful visualizations on natural resource megatrends in your email every week.
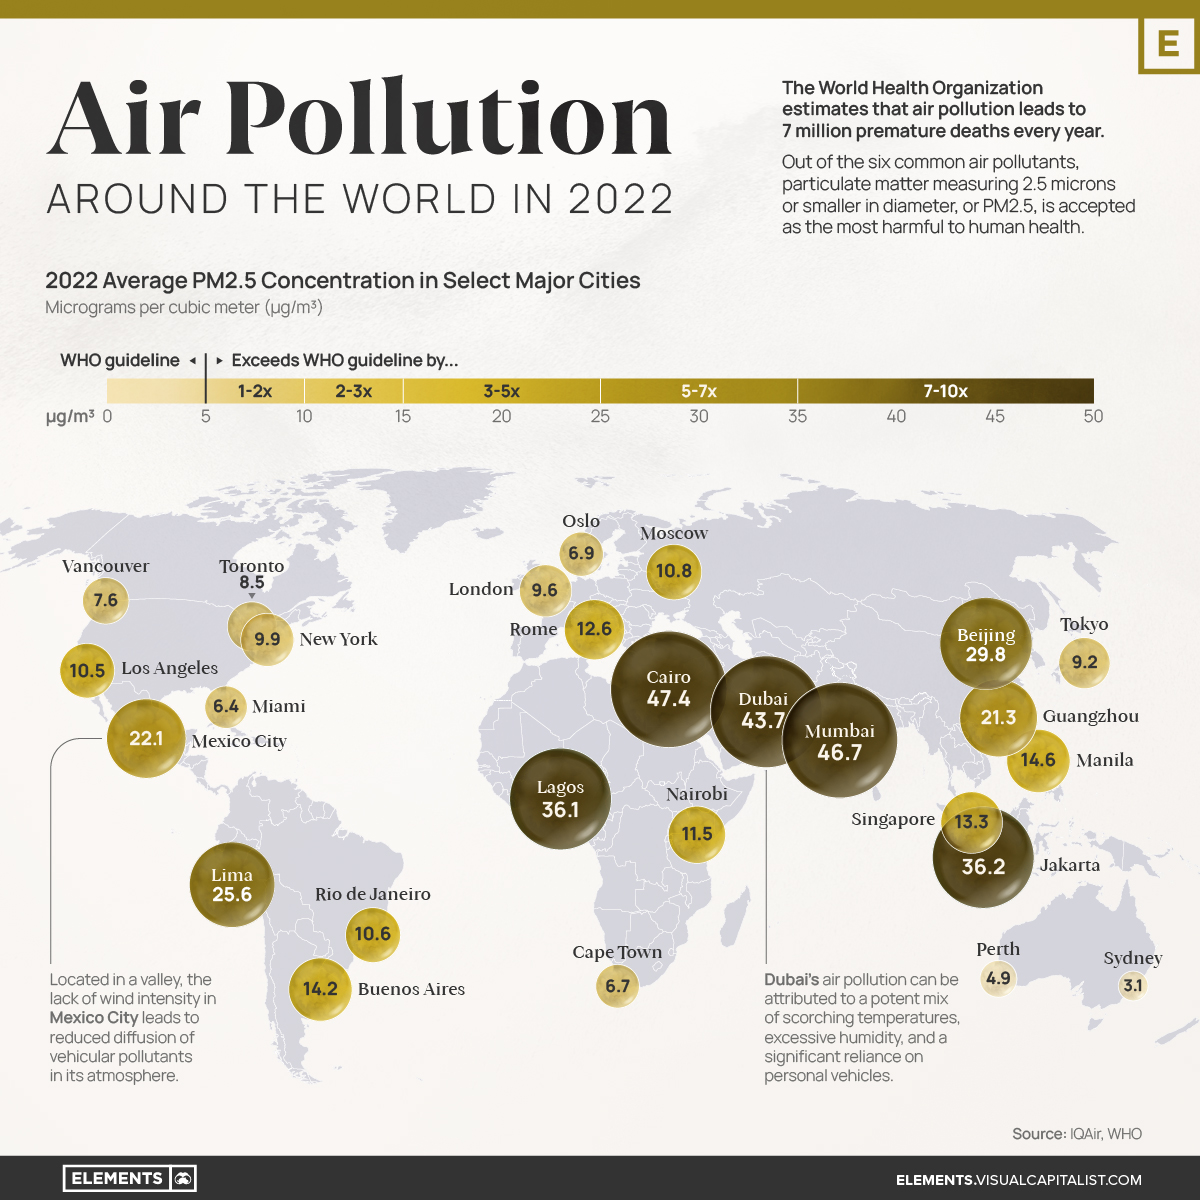
The World Health Organization (WHO) estimates that air pollution leads to 7 million premature deaths every year.
Out of the six common air pollutants, particulate matter measuring 2.5 microns or smaller in diameter, or PM2.5, is accepted as the most harmful to human health. This is due to its prevalence in the atmosphere and the broad range of adverse health effects associated with its exposure, such as heart disease, stroke, lung cancer and chronic respiratory diseases.
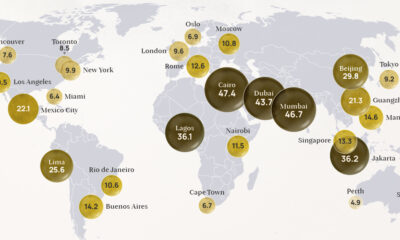
With that context in mind, this visualization uses IQAir’s World Air Quality Report to map out the 2022 average PM2.5 concentrations in select major cities around the globe, expressed in micrograms per cubic meter (μg/m³).
Understanding the WHO Air Pollution Guidelines
Did you know that in 2019, only 1% of the global population lived in places where WHO global air quality guidelines were met?
Designed to protect public health from the harmful effects of air pollution, the guidelines cover a range of air pollutants, including particulate matter, ozone, nitrogen dioxide, sulfur dioxide, and carbon monoxide.
The healthy limits for PM2.5 are set at an annual average of 0-5 μg/m³.
| WHO Classification | Annual Average PM2.5 Concentration (μg/m³) | % of countries within classification, 2022* |
|---|---|---|
| WHO Air Quality Guideline | 0 - 5 | 9.9% |
| Interim Target 4 | 5.1 - 10 | 18.3% |
| Interim Target 3 | 10.1 - 15 | 19.8% |
| Interim Target 2 | 15.1 - 25 | 28.2% |
| Interim Target 1 | 25.1 - 35 | 9.9% |
| Exceeds Target Levels | 35.1 - 50 | 7.6% |
| Exceeds Target Levels | > 50 | 6.1% |
*Percentages are calculated as a proportion of the 131 countries that had sufficient air quality data and were included in IQAir’s World Air Quality Report in 2022.
According to IQAir’s World Air Quality Report, only 13 countries or territories met the recommended concentration of PM2.5 in 2022. Among them were Australia, Finland, Puerto Rico, Iceland, Bermuda, and Guam.
Above this guideline, many countries fell within the four interim targets, while nearly 14% recorded air pollution levels that exceeded all target levels.
The Effects of Air Quality on Mortality
While it can be a little difficult to grasp what the above concentrations represent, thinking of them in terms of their effect on mortality can shed some light on their significance.
According to the WHO, non-accidental mortality rates multiply by 1.08 per 10 µg/m³ increase in PM2.5 concentration, but only up to 35 μg/m³. Above that, mortality growth rates may not be linear, resulting in many more deaths.
Here is an example to highlight what that means.
- Say that, for a population living within the WHO PM2.5 guideline, the non-accidental mortality rate is arbitrarily set to 100 deaths for a given period.
- If this area’s PM2.5 concentration goes up to 10 μg/m³, putting them at Interim Target 4, they would see 104 deaths in that same amount of time.
- At Interim Target 3, where their PM2.5 concentration would be 15 μg/m³, they would see 108 deaths.
- At Interim Target 2, they’d see 117.
- Finally, at Interim Target 1, they’d see 126.
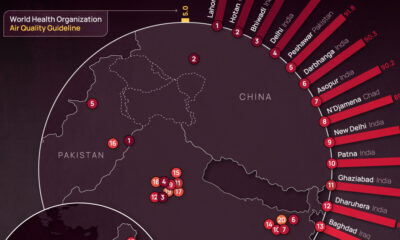
Beyond Interim Target 1 (above 35 μg/m³), deaths would potentially grow much faster. As of 2022, around 14% of countries report levels above this threshold, including Chad, India, Pakistan, Qatar, and Nigeria.
The State of Air Pollution Around the World
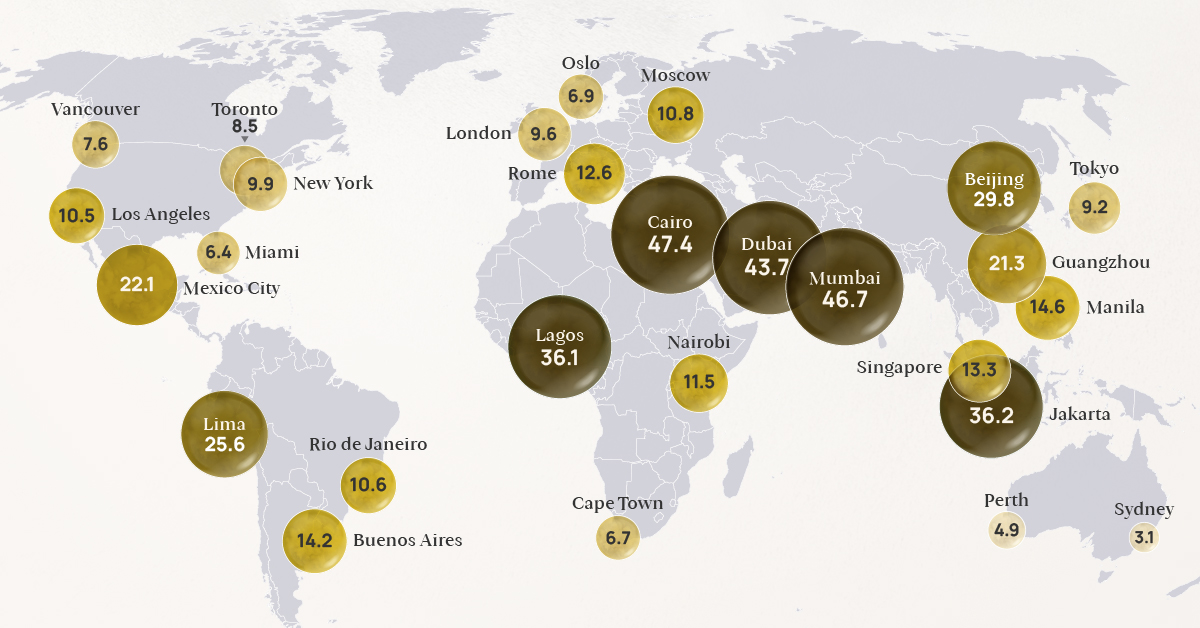
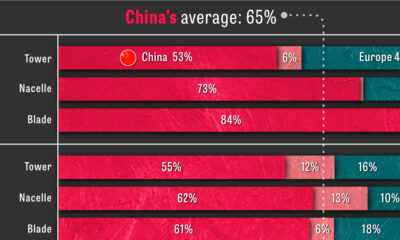
While many cities in North America and Europe have seen steady and relatively lower PM2.5 concentrations during the last few years, many cities (especially those in Asia) have been making strides in lowering their air pollution levels.
Nonetheless, many of them still record PM2.5 concentrations that are more than six times the WHO guideline.
| City | 2022 annual average PM2.5 concentration (μg/m³) | 2018 annual average PM2.5 concentration (μg/m³) |
|---|---|---|
| 🇪🇬 Cairo, Egypt | 47.4 | N/A |
| 🇮🇳 Mumbai, India | 46.7 | 58.6 |
| 🇦🇪 Dubai, UAE | 43.7 | 55.3 |
| 🇮🇩 Jakarta, Indonesia | 36.2 | 45.3 |
| 🇳🇬 Lagos, Nigeria | 36.1 | N/A |
| 🇨🇳 Beijing, China | 29.8 | 50.9 |
| 🇵🇪 Lima, Peru | 25.6 | 28 |
| 🇲🇽 Mexico City, Mexico | 22.1 | 19.7 |
| 🇨🇳 Guangzhou, China | 21.3 | 33.2 |
| 🇵🇭 Manila, Philippines | 14.6 | N/A |
| 🇦🇷 Buenos Aires, Argentina | 14.2 | 12.4 |
| 🇸🇬 Singapore, Singapore | 13.3 | 14.8 |
| 🇮🇹 Rome, Italy | 12.6 | N/A |
| 🇰🇪 Nairobi, Kenya | 11.5 | N/A |
| 🇷🇺 Moscow, Russia | 10.8 | 10.1 |
| 🇧🇷 Rio de Janeiro, Brazil | 10.6 | N/A |
| 🇺🇸 Los Angeles, USA | 10.5 | 14.4 |
| 🇺🇸 New York, USA | 9.9 | N/A |
| 🇬🇧 London, UK | 9.6 | 12 |
| 🇯🇵 Tokyo, Japan | 9.2 | 13.1 |
| 🇨🇦 Toronto, Canada | 8.5 | 7.8 |
| 🇨🇦 Vancouver, Canada | 7.6 | N/A |
| 🇳🇴 Oslo, Norway | 6.9 | 8.2 |
| 🇿🇦 Cape Town, South Africa | 6.7 | N/A |
| 🇺🇸 Miami, USA | 6.4 | 7.8 |
| 🇦🇺 Perth, Australia | 4.9 | N/A |
| 🇦🇺 Sydney, Australia | 3.1 | 7.6 |
Most parts of the world did not meet the annual WHO recommendation for clean and healthy air in 2022.
However, the cost of inaction toward cleaner air is very high. In addition to the millions of premature deaths each year, the global cost of health damages associated with air pollution currently sits at $8.1 trillion.
Unfortunately, things that are integral to our quality of life, such as industrial activities, transportation, energy production, and agricultural practices, are also the leading causes of air pollution around the world.
As such, a multi-faceted approach to lowering pollution is essential to protect lives, especially to benefit those already more vulnerable to poor air quality, such as kids and the elderly.


Environment
3 Ways the Shipping Industry is Addressing Climate Change
The shipping industry is responsible for 2.89% of all carbon emissions. Here are three ways it could evolve to address climate change.

3 Ways the Shipping Industry is Addressing Climate Change
The global shipping industry is on the verge of a transformation not seen since the transition from sail to steam.
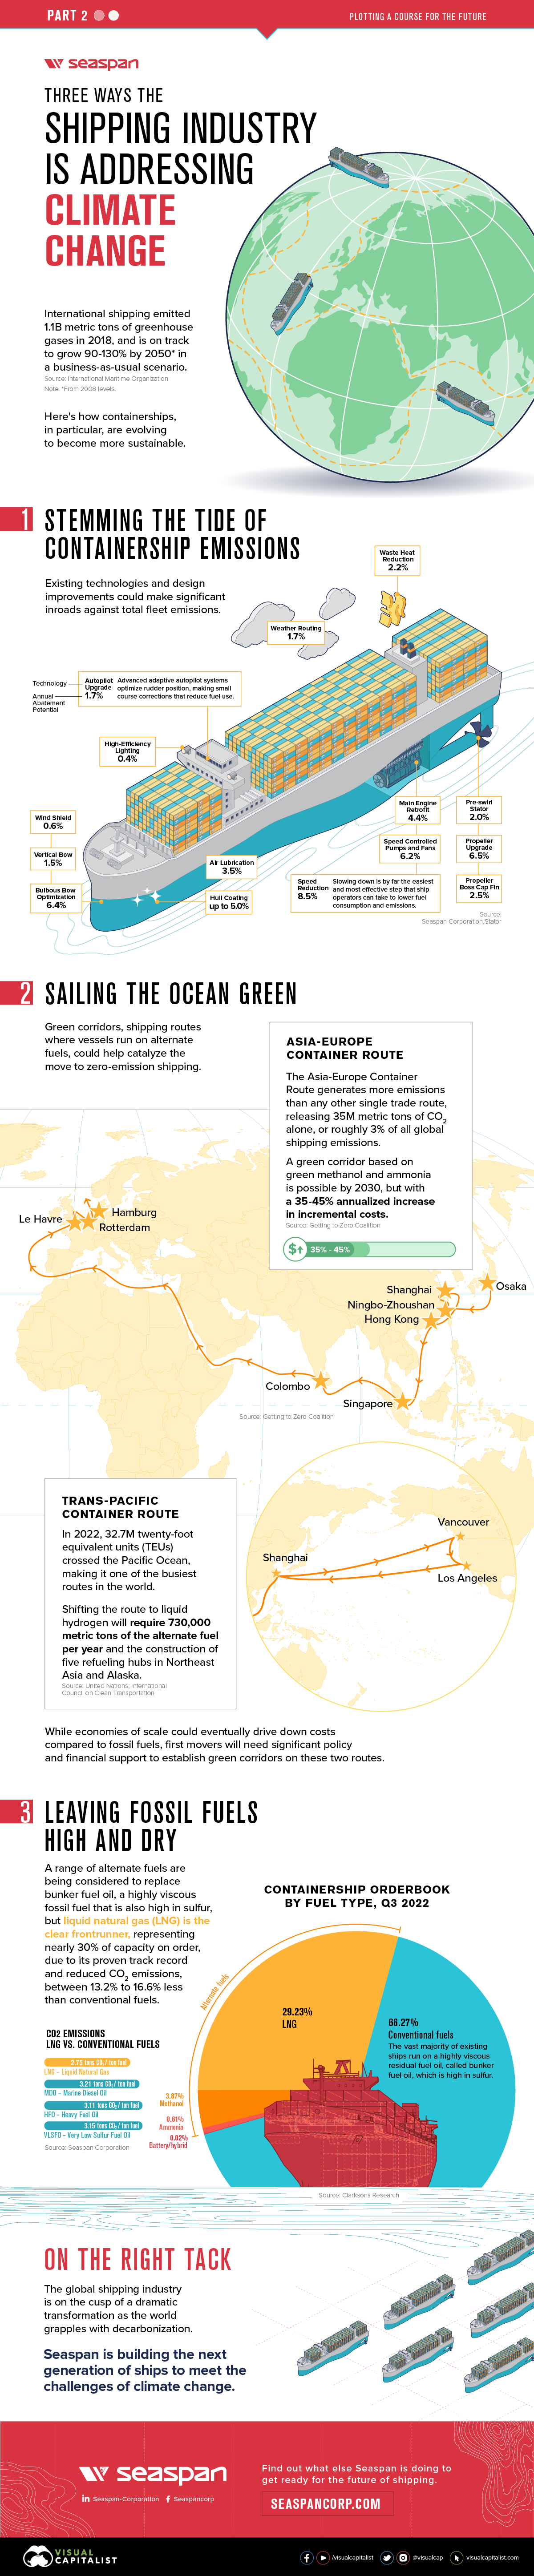
In 2018, the industry emitted 1.1 billion metric tons of greenhouse gas emissions, representing 2.89% of all anthropogenic, or human-caused, emissions. And according to the International Maritime Organization (IMO) that could increase 90-130% in 2050, from a 2008 baseline.
This is the second and final part of The Shipping Industry: Plotting a Course for the Future, a two-part series from our sponsor Seaspan Corporation, that looks at three ways that containerships in particular, could evolve to become more sustainable.
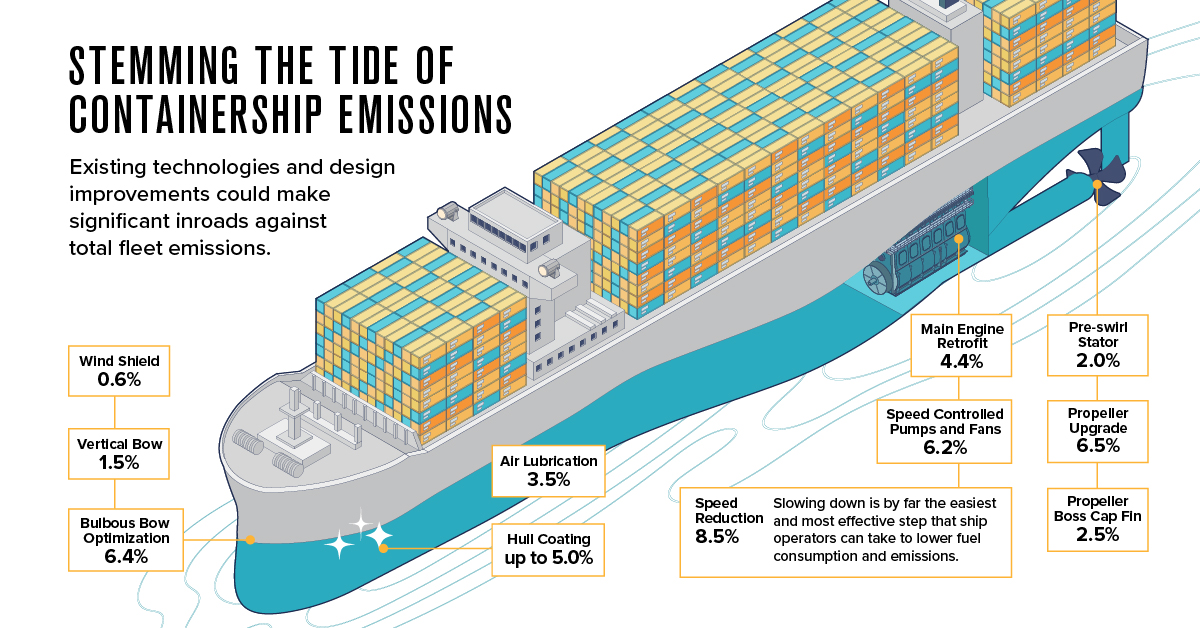
1. Stemming the Tide of Containership Emissions
Unlike personal transport, which has a proven and commercially scalable technology in electric vehicles, there’s no silver bullet for shipping. However, existing technologies and design improvements could help make significant inroads against total fleet emissions.
According to data from Seaspan, propeller upgrades (6.5%), hull coatings (up to 5.0%), and main engine retrofits (4.4%) won’t bring emissions to zero on their own, but taken together they add up to big savings.
| Technology | Annual Abatement potential |
|---|---|
| Speed reduction | 8.5% |
| Propeller Upgrade | 6.5% |
| Bulbous bow optimization | 6.4% |
| Speed Controlled Pumps and Fans | 6.2% |
| Hull coating | 5.0% (up to) |
| Main engine retrofit | 4.4% |
| Air lubrication | 3.5% |
| Propeller boss cap fin | 2.5% |
| Waste Heat Reduction | 2.2% |
| Pre-swirl stator | 2.0% |
| Weather Routing | 1.7% |
| Autopilot Upgrade | 1.7% |
| Vertical bow | 1.5% |
| Wind shield | 0.6% |
| High-Efficiency Lighting | 0.4% |
Interestingly, the biggest potential impact could come from slowing down ships (8.5%), which lowers fuel consumption and as a consequence, emissions. In the race to net zero, slow and steady could very well win the race.
2. Sailing the Ocean Green
In the long run, though, design tweaks don’t address the elephant seal in the room, which is the industry’s reliance on fossil fuels. Ships that run on alternate fuels, like ammonia, methanol, and even wind-power, are all in development, but many of the technologies are still in the early stages.
To help spur development, a group of countries at COP26, the annual UN climate conference, committed to establishing green shipping corridors where vessels would run on alternate fuels. A total of 24 countries signed the Clydebank Declaration, including the U.S. and the UK, and together they hope to catalyze the shift to zero emission shipping.
3. Leaving Fossil Fuels High and Dry
Many ship owners and operators are looking at Liquid Natural Gas (LNG) as a transitional fuel, while alternate fuel technologies mature. LNG emits between 13.2% and 16.6% less CO2 than conventional bunker fuel oil, a highly viscous residual fuel that is high in sulfur, so it’s no surprise that LNG-powered containerships represent 29.23% of the existing orderbook.
But with all but 2.4% of the current global fleet running on fossil fuels, there is still a long journey ahead.
On the Right Tack
The 1997 Kyoto Protocol established the IMO as the forum for climate change action for the shipping industry, which many have criticized for not moving fast and far enough on climate change.
At the July 2023 meeting of the Marine Environment Protection Committee, the IMO adopted a new greenhouse gas strategy, which set “indicative checkpoints” for emission reductions for 2030 and 2040 in place of binding targets, and committed to hit net zero “by or around, i.e. close to 2050, taking into account different national circumstances.” The IMO also declined to put a price on carbon.
Even without firm targets, many industry players aren’t waiting to move on the climate emergency. Seaspan, the world’s largest independent charter owner and manager of containerships, is moving to green their fleet. They recently signed an agreement to retrofit 15 ships with dual-fuel engines that can also run on green methanol, with an option for 45 more.
Find out what else Seaspan is doing to get ready for the future of shipping.

-
 Energy4 weeks ago
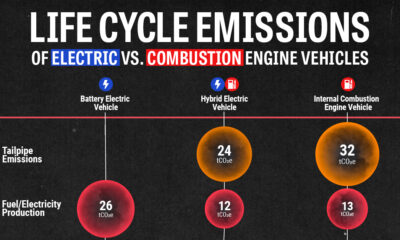
Life Cycle Emissions: EVs vs. Combustion Engine Vehicles
We look at carbon emissions of electric, hybrid, and combustion engine vehicles through an analysis of their life cycle emissions.
-
 Green3 months ago
Mapped: Air Pollution Levels Around the World in 2022
Exploring 2022 average air pollution levels around the world by PM2.5 concentration.
-
 Maps10 months ago
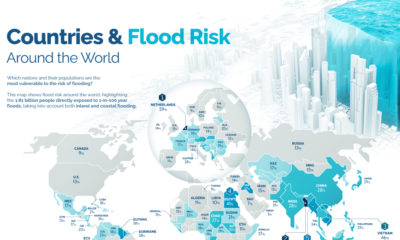
Mapped: Countries With the Highest Flood Risk
Recent floods in Pakistan have affected more than 33 million people. Where is the risk of flooding highest around the world?
-
 Science11 months ago
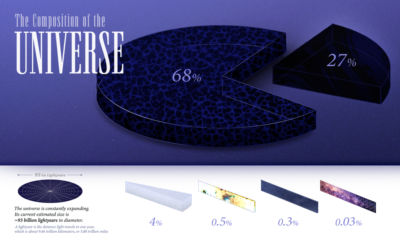
All the Contents of the Universe, in One Graphic
We explore the ultimate frontier: the composition of the entire known universe, some of which are still being investigated today.
-

 Environment11 months ago
Explained: The Relationship Between Climate Change and Wildfires
More carbon in the atmosphere is creating a hotter world—and gradually fueling both climate change and instances of wildfires.
-
 Environment12 months ago
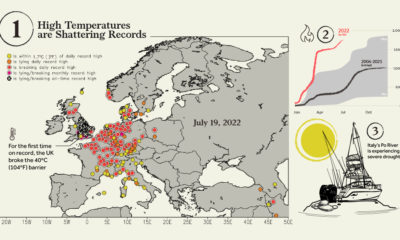
5 Things to Know About Europe’s Scorching Heatwave
Smoldering temperatures are wreaking havoc across Europe. Here are 5 key things you should know about Europe’s current heatwave.

-
 Environment5 days ago
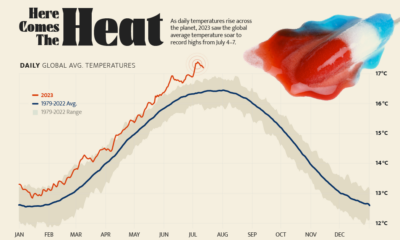
Hotter Than Ever: 2023 Sets New Global Temperature Records
-
 Datastream4 weeks ago
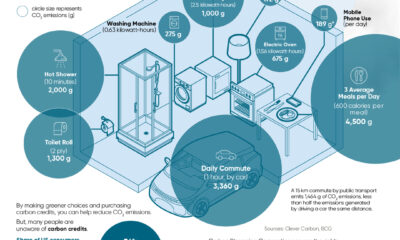
Can You Calculate Your Daily Carbon Footprint?
-
 Energy2 weeks ago
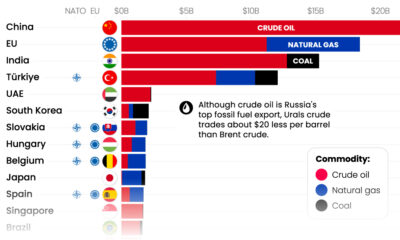
Who’s Still Buying Russian Fossil Fuels in 2023?
-

 VC+5 days ago
What’s New on VC+ in July
-
 Investor Education4 weeks ago
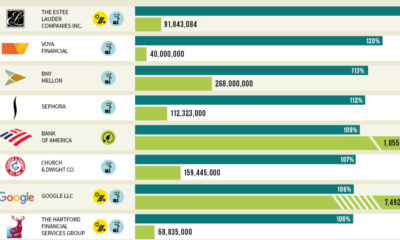
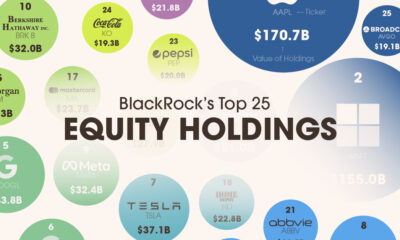
Visualizing BlackRock’s Top Equity Holdings
-

 Technology2 weeks ago
Meet the Competing Apps Battling for Twitter’s Market Share
-
 Politics17 hours ago
How Do Chinese Citizens Feel About Other Countries?
-

 Markets4 weeks ago
Visualizing Every Company on the S&P 500 Index