Energy
Where are Clean Energy Technologies Manufactured?
![]() Subscribe to the Elements free mailing list for more like this
Subscribe to the Elements free mailing list for more like this


Visualizing Where Clean Energy Technologies Are Manufactured
This was originally posted on Elements. Sign up to the free mailing list to get beautiful visualizations on natural resource megatrends in your email every week.
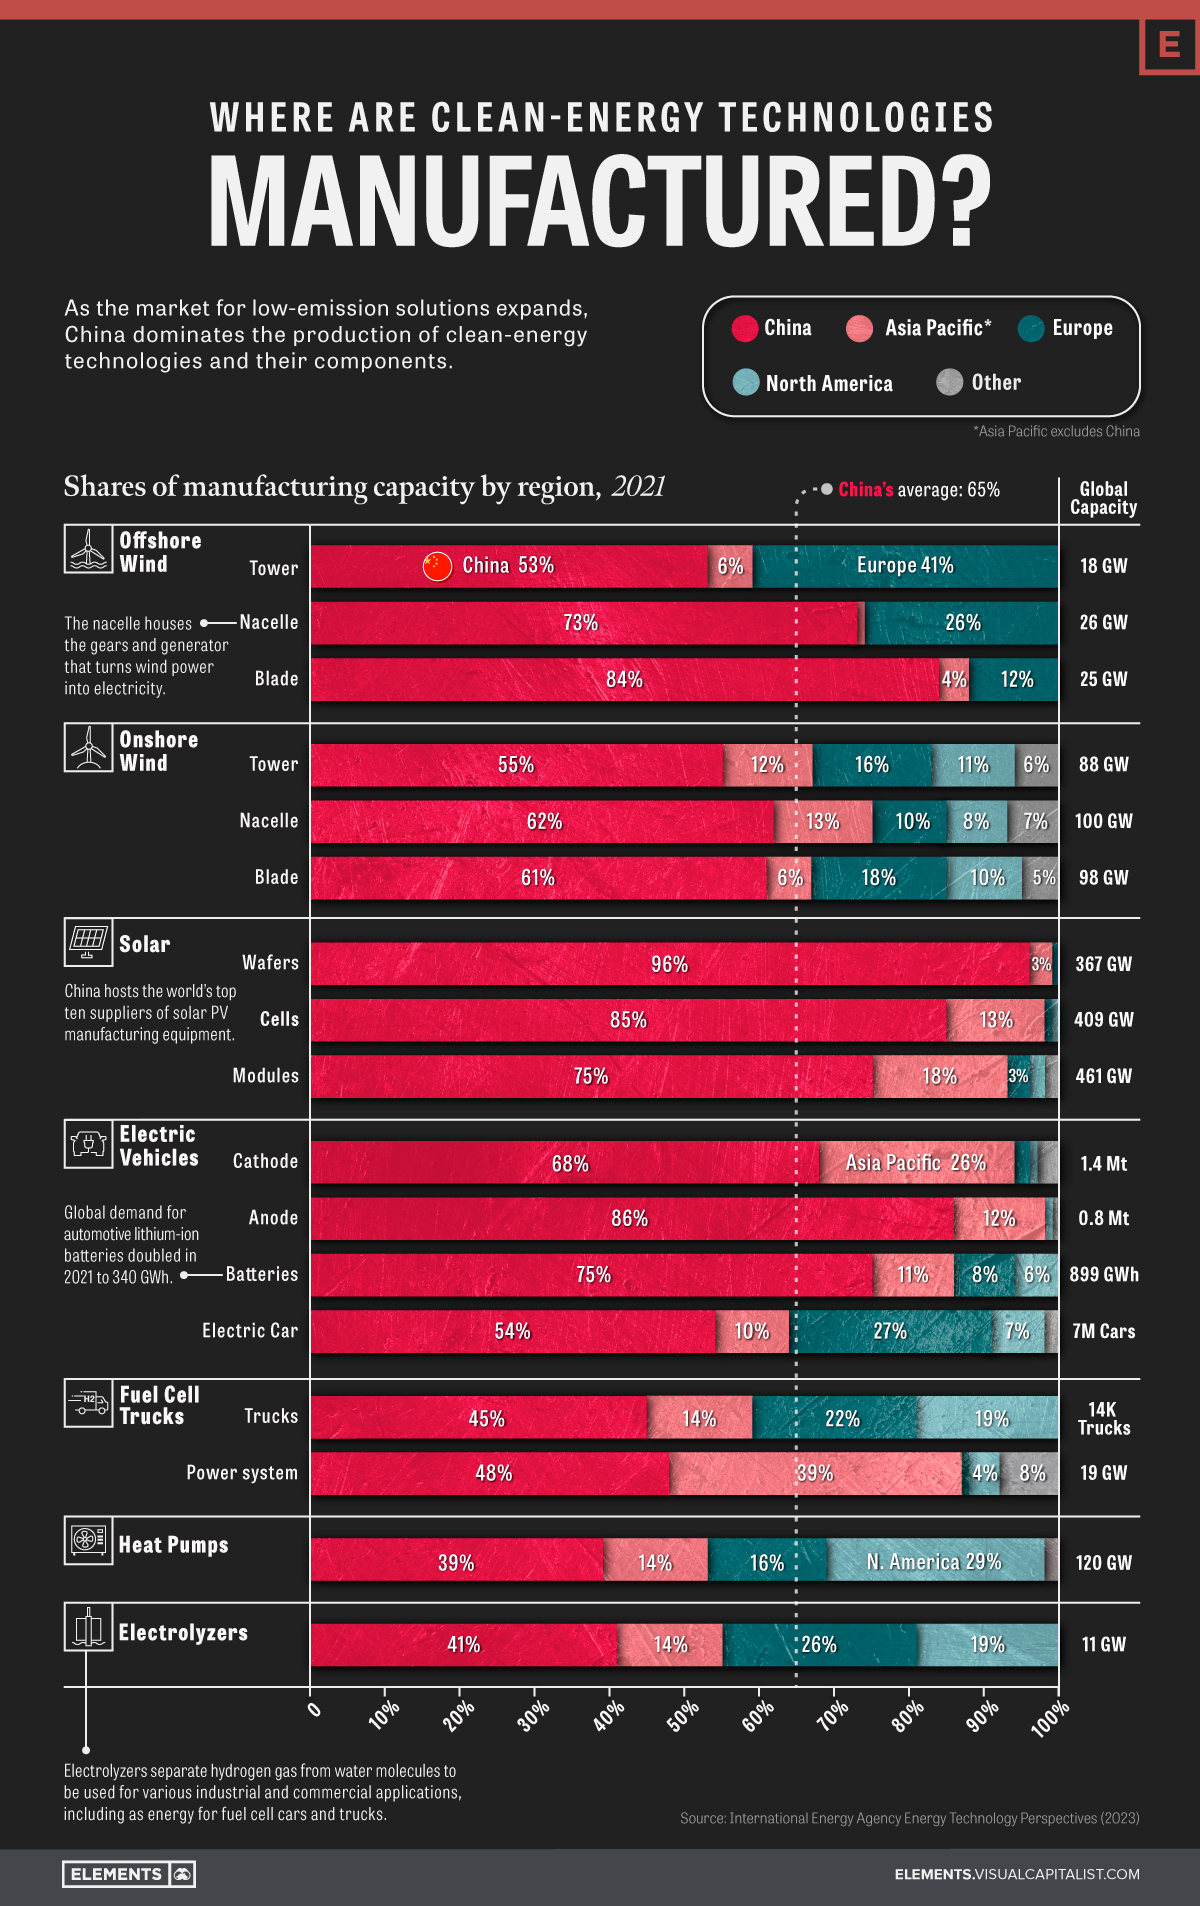
When looking at where clean energy technologies and their components are made, one thing is very clear: China dominates the industry.
The country, along with the rest of the Asia Pacific region, accounts for approximately 75% of global manufacturing capacity across seven clean energy technologies.
Based on the IEA’s 2023 Energy Technology Perspectives report, the visualization above breaks down global manufacturing capacity by region for mass-manufactured clean energy technologies, including onshore and offshore wind, solar photovoltaic (PV) systems, electric vehicles (EVs), fuel cell trucks, heat pumps, and electrolyzers.
The State of Global Manufacturing Capacity
Manufacturing capacity refers to the maximum amount of goods or products a facility can produce within a specific period. It is determined by several factors, including:
- The size of the manufacturing facility
- The number of machines or production lines available
- The skill level of the workforce
- The availability of raw materials
According to the IEA, the global manufacturing capacity for clean energy technologies may periodically exceed short-term production needs. Currently, this is true especially for EV batteries, fuel cell trucks, and electrolyzers. For example, while only 900 fuel cell trucks were sold globally in 2021, the aggregate self-reported capacity by manufacturers was 14,000 trucks.
With that said, there still needs to be a significant increase in manufacturing capacity in the coming decades if demand aligns with the IEA’s 2050 net-zero emissions scenario. Such developments require investments in new equipment and technology, developing the clean energy workforce, access to raw and refined materials, and optimizing production processes to improve efficiency.
What Gives China the Advantage?
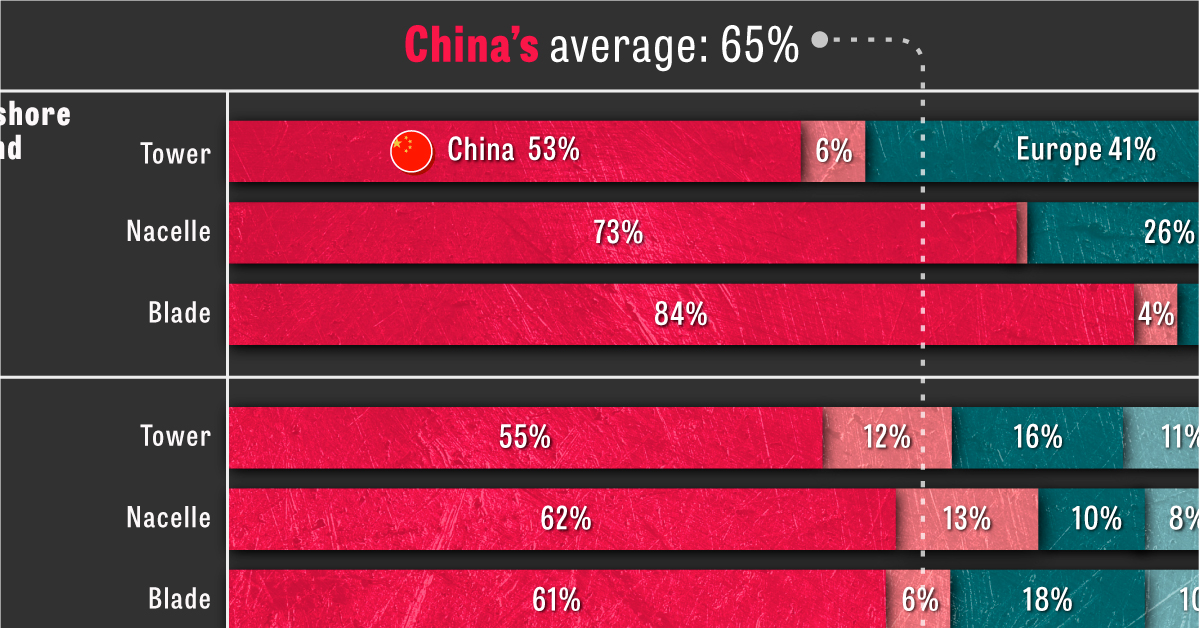
Of the above clean energy technologies and their components, China averages 65% of global manufacturing capacity. For certain components, like solar PV wafers, this percentage is as high as 96%.
Here’s a breakdown of China’s manufacturing capacity per clean energy technology.
| Technology | China’s share of global manufacturing capacity, 2021 |
|---|---|
| Wind (Offshore) | 70% |
| Wind (Onshore) | 59% |
| Solar PV Systems | 85% |
| Electric Vehicles | 71% |
| Fuel Cell Trucks | 47% |
| Heat Pumps | 39% |
| Electrolyzers | 41% |
So, what gives China this advantage in the clean energy technology sector? According to the IEA report, the answer lies in a combination of factors:
- Low manufacturing costs
- A dominance in clean energy metal processing, namely cobalt, lithium, and rare earth metals
- Sustained policy support and investment
The mixture of these factors has allowed China to capture a significant share of the global market for clean technologies while driving down the cost of clean energy worldwide.
As the market for low-emission solutions expands, China’s dominance in the sector will likely continue in the coming years and have notable implications for the global energy and emission landscape.


Batteries
Visualized: The Rise of the LFP Battery
In 2022, the EV sector’s market share of the LFP battery rose from just 6% in 2020 to 30%, highlighting its growing popularity.


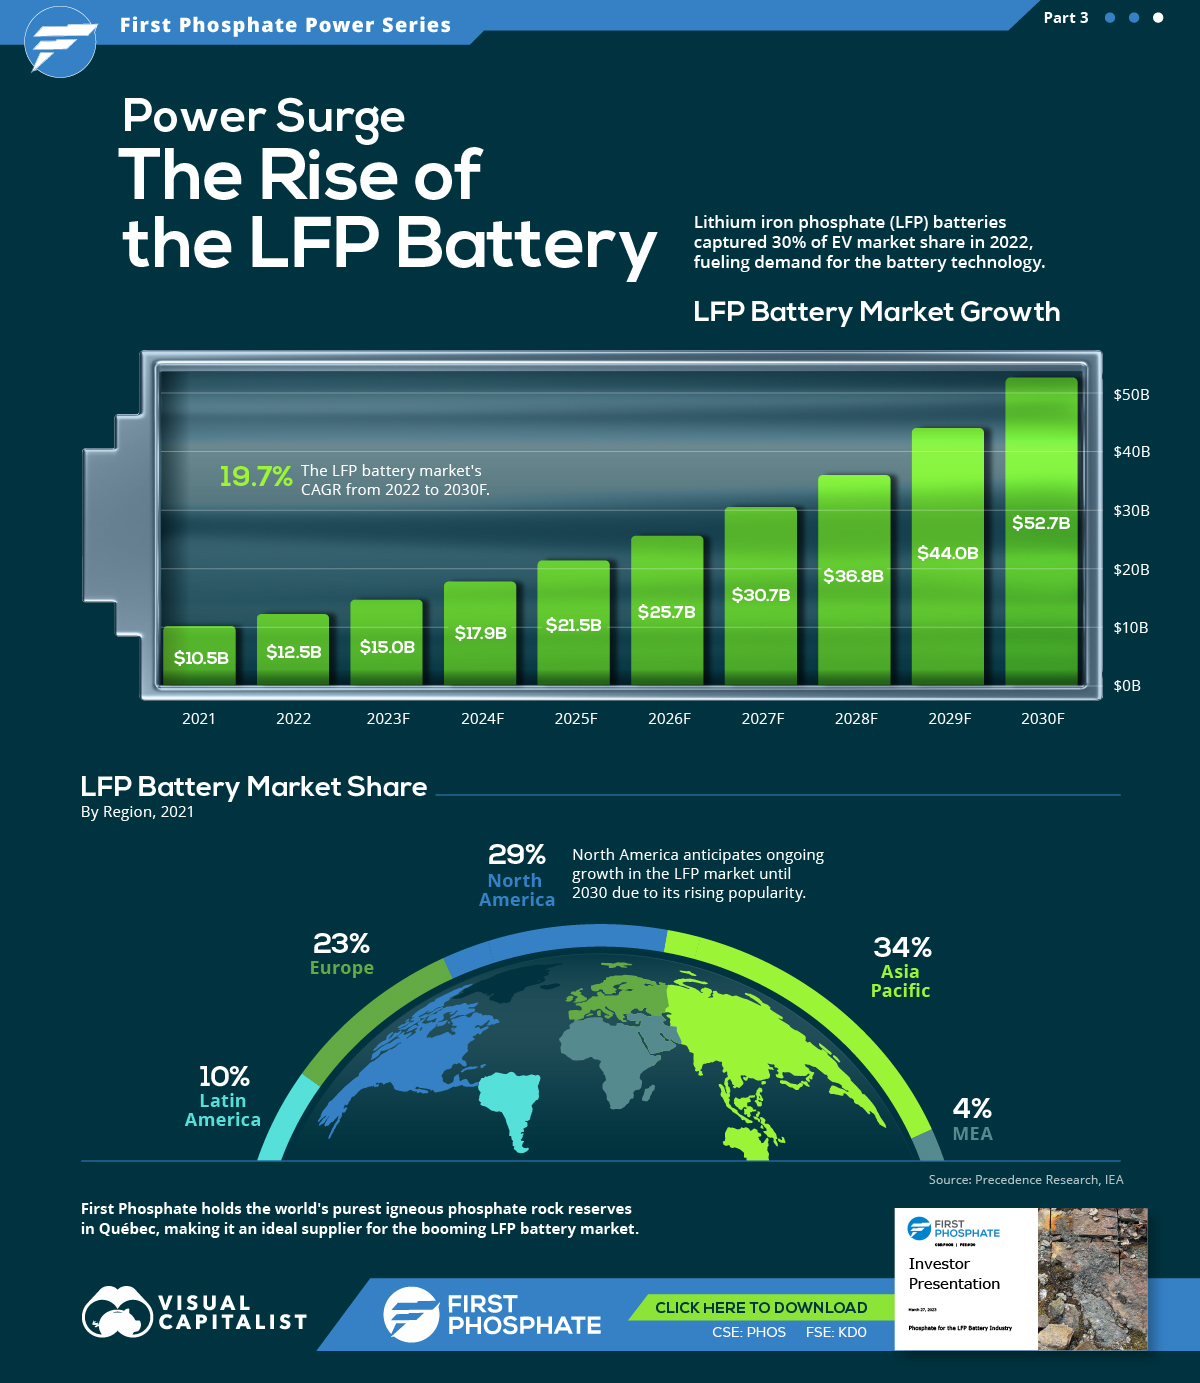
The Rise of the LFP Battery
Primarily a key component in fertilizers, phosphate is also essential to lithium iron phosphate (LFP) battery technology.
LFP is an emerging favorite in the expanding EV market, particularly in standard-range EVs. Factors driving this popularity include superior safety, longevity, cost-effectiveness, and environmental sustainability.
In this graphic, our sponsor First Phosphate looks at the growing LFP market, highlighting forecasted growth and current market share.
Market Growth
In 2022, the global LFP battery market stood at $12.5 billion. By 2030, this figure is expected to catapult to nearly $52.7 billion, signifying a CAGR of 19.7%.
| Year | USD (Billion) |
|---|---|
| 2021 | $10.5B |
| 2022 | $12.5B |
| 2023F | $15.0B |
| 2024F | $17.9B |
| 2025F | $21.5B |
| 2026F | $25.7B |
| 2027F | $30.7B |
| 2028F | $36.8B |
| 2029F | $44.0B |
| 2030F | $52.7B |
In 2022, LFP batteries cornered a sizable 30% of the EV market share from just 6% in 2020, demonstrating the growing appeal of this type of lithium-ion battery in the electric vehicle sector.
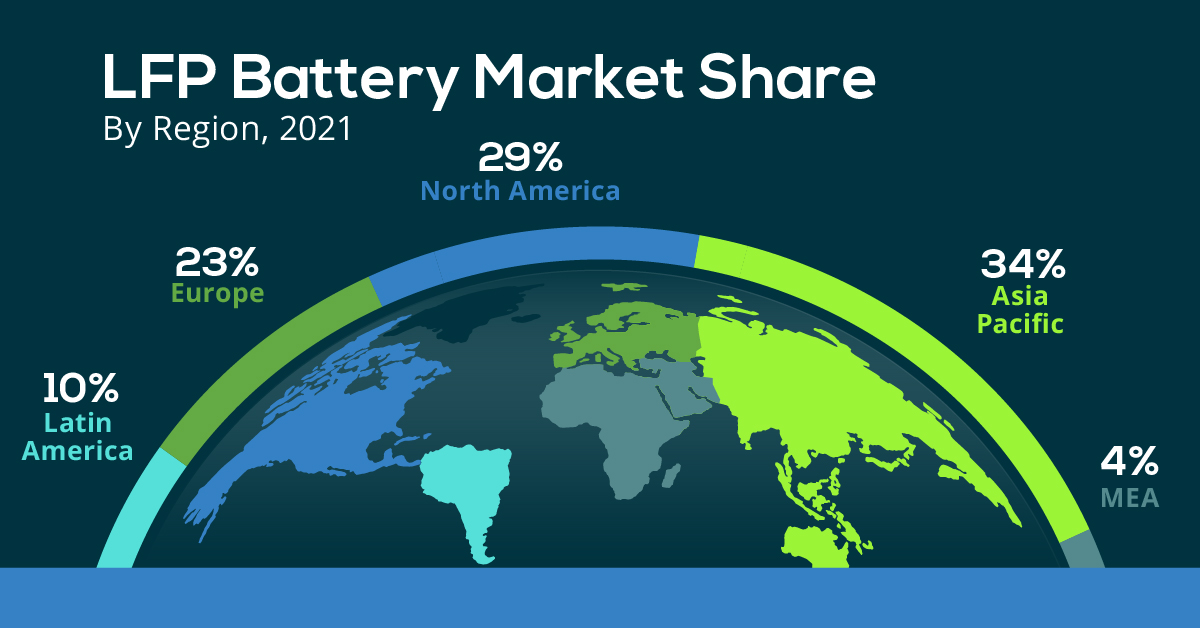
Market Share
The Asia Pacific region dominated the LFP battery market in 2021, accounting for over 34% of the global share.
| Regions | Revenue Share (%) |
|---|---|
| Asia Pacific | 34% |
| North America | 29% |
| Europe | 23% |
| Latin America | 10% |
| MEA | 4% |
Meanwhile, North America, with the second largest share, is projected to witness ongoing growth through 2030.
First Phosphate holds access to 1% of the world’s purest igneous rock phosphate reserves in Québec, making it an ideal supplier for the growing LFP market.

-

 Maps2 months ago
Mapped: Renewable Energy and Battery Installations in the U.S. in 2023
This graphic describes new U.S. renewable energy installations by state along with nameplate capacity, planned to come online in 2023.
-

 Batteries2 months ago
How EV Adoption Will Impact Oil Consumption (2015-2025P)
How much oil is saved by adding electric vehicles into the mix? We look at data from 2015 to 2025P for different types of EVs.
-
 Automotive3 months ago
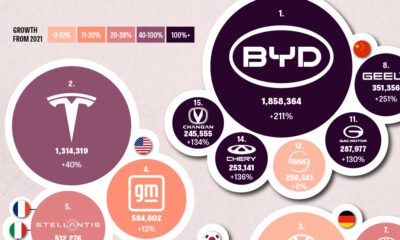
Global EV Production: BYD Surpasses Tesla
This graphic explores the latest EV production data for 2022, which shows BYD taking a massive step forward to surpass Tesla.
-

 Batteries6 months ago
Visualizing China’s Dominance in Battery Manufacturing (2022-2027P)
This infographic breaks down battery manufacturing capacity by country in 2022 and 2027.
-

 Batteries7 months ago
Visualizing 25 Years of Lithium Production, by Country
Lithium production has grown exponentially over the last few decades. Which countries produce the most lithium, and how how has this mix evolved?
-
 Energy10 months ago
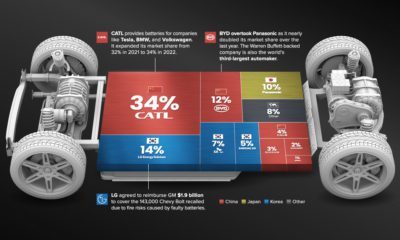
The Top 10 EV Battery Manufacturers in 2022
Despite efforts from the U.S. and Europe to increase the domestic production of batteries, the market is still dominated by Asian suppliers.
-

 Energy2 weeks ago
Who’s Still Buying Russian Fossil Fuels in 2023?
-

 VC+4 days ago
What’s New on VC+ in July
-

 Investor Education4 weeks ago
Visualizing BlackRock’s Top Equity Holdings
-

 Technology2 weeks ago
Meet the Competing Apps Battling for Twitter’s Market Share
-

 Politics15 hours ago
How Do Chinese Citizens Feel About Other Countries?
-

 Markets4 weeks ago
Visualizing Every Company on the S&P 500 Index
-

 Economy2 weeks ago
Visualizing 1 Billion Square Feet of Empty Office Space
-

 Green4 weeks ago
Life Cycle Emissions: EVs vs. Combustion Engine Vehicles