Maps
Mapped: Countries With the Highest Flood Risk
![]() Subscribe to the Elements free mailing list for more like this
Subscribe to the Elements free mailing list for more like this
Risk of Flooding Mapped Around the World
This was originally posted on Elements. Sign up to the free mailing list to get beautiful visualizations on natural resource megatrends in your email every week.
Devastating floods across Pakistan this summer have resulted in more than 1,400 lives lost and one-third of the country being under water.
This raises the question: which nations and their populations are the most vulnerable to the risk of flooding around the world?
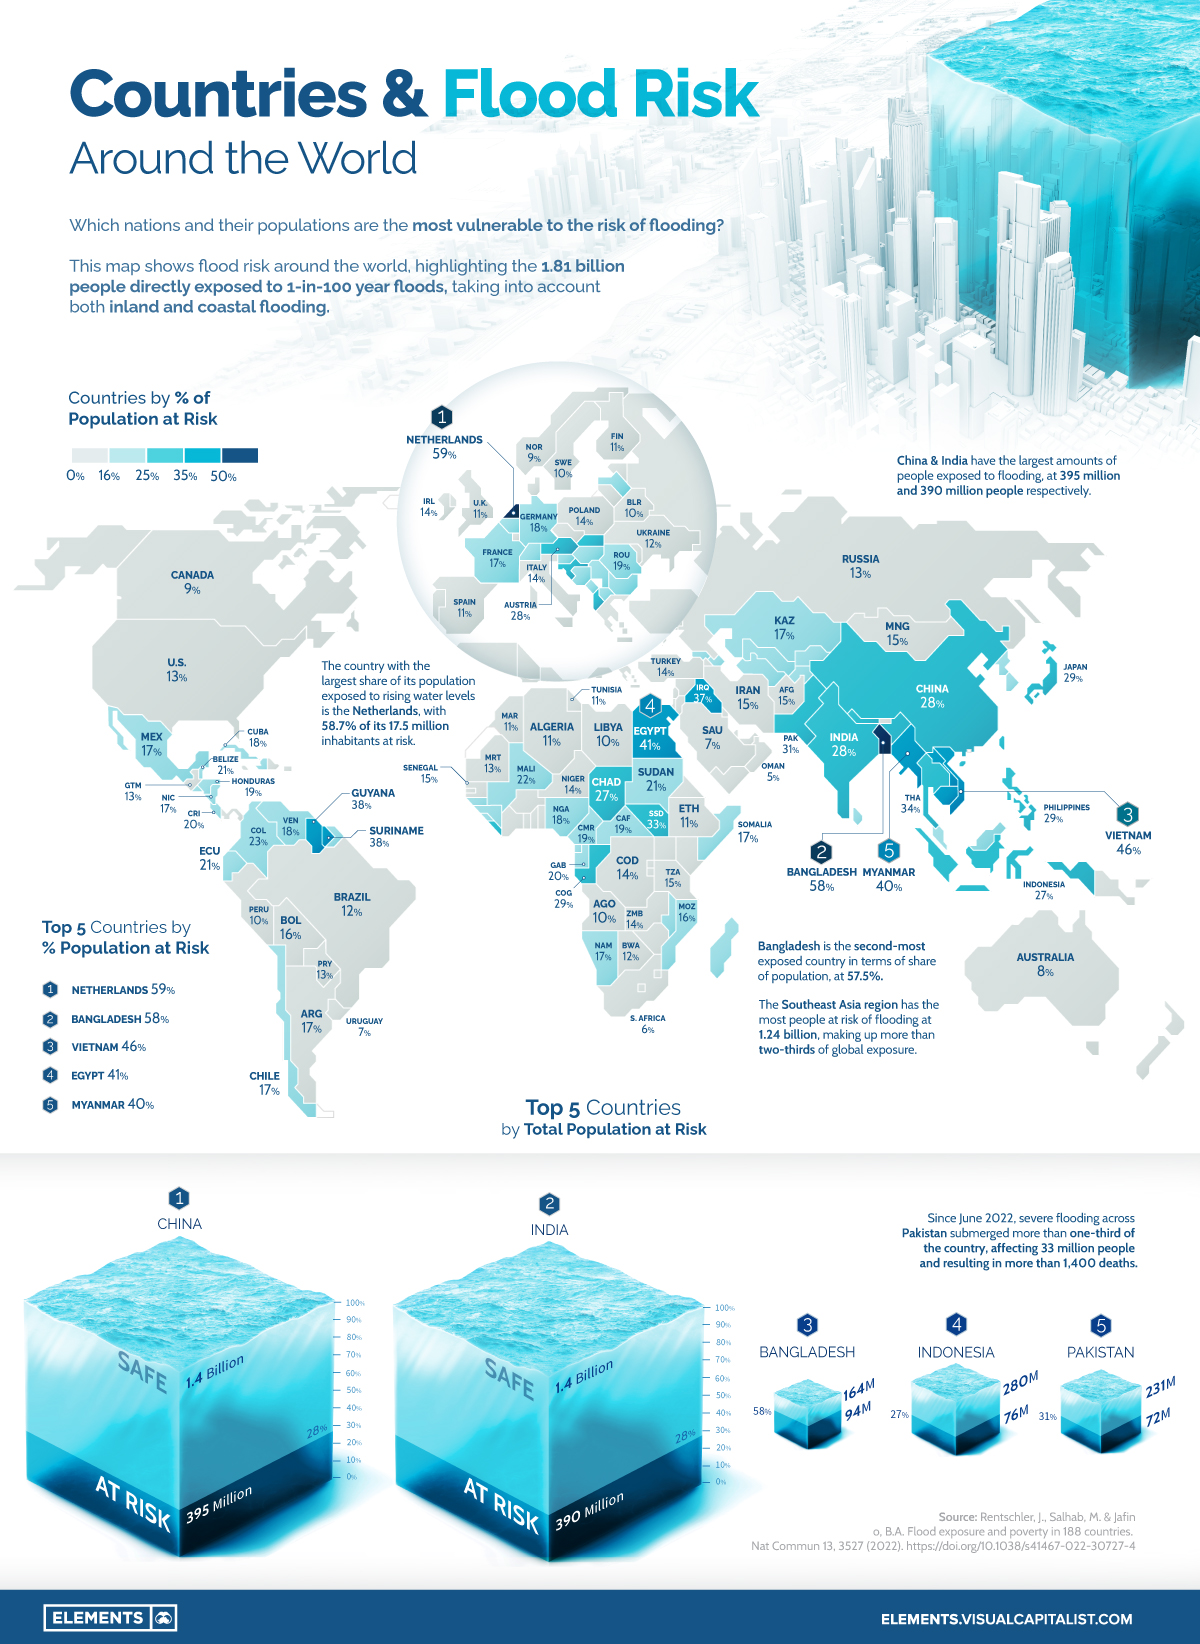
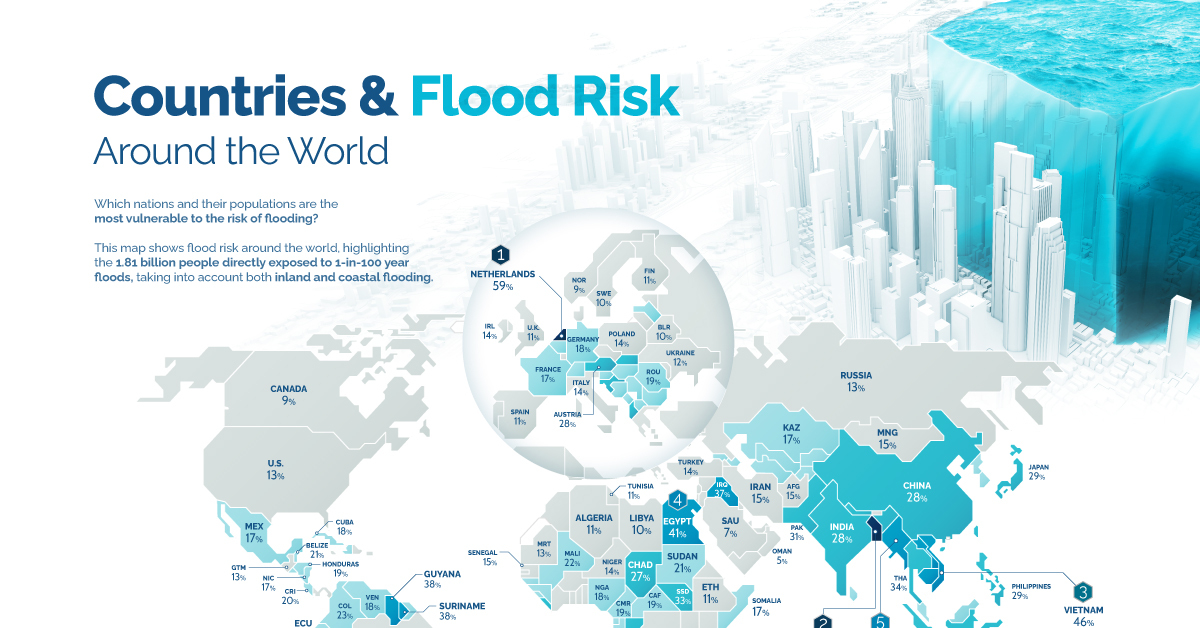
Using data from a recent study published in Nature, this graphic maps flood risk around the world, highlighting the 1.81 billion people directly exposed to 1-in-100 year floods. The methodology takes into account potential risks from both inland and coastal flooding.
Asian Countries Most at Risk from Rising Water Levels
Not surprisingly, countries with considerable coastlines, river systems, and flatlands find themselves with high percentages of their population at risk.
The Netherlands and Bangladesh are the only two nations in the world to have more than half of their population at risk due to flooding, at 59% and 58%, respectively. Vietnam (46%), Egypt (41%), and Myanmar (40%) round out the rest of the top five nations.
Besides the Netherlands, only two other European nations are in the top 20 nations by percentage of population at risk, Austria (18th at 29%) and Albania (20th at 28%).
| Rank | Country | Flood risk, by population exposed (%) | Total population exposed |
|---|---|---|---|
| #1 | 🇳🇱 Netherlands | 58.7% | 10,100,000 |
| #2 | 🇧🇩 Bangladesh | 57.5% | 94,424,000 |
| #3 | 🇻🇳 Vietnam | 46.0% | 45,504,000 |
| #4 | 🇪🇬 Egypt | 40.5% | 38,871,000 |
| #5 | 🇲🇲 Myanmar | 39.9% | 19,104,000 |
| #6 | 🇱🇦 Laos | 39.7% | 2,985,000 |
| #7 | 🇰🇭 Cambodia | 38.1% | 7,431,000 |
| #8 | 🇬🇾 Guyana | 37.9% | 276,000 |
| #9 | 🇸🇷 Suriname | 37.7% | 233,000 |
| #10 | 🇮🇶 Iraq | 36.8% | 16,350,000 |
| #11 | 🇹🇭 Thailand | 33.9% | 25,431,000 |
| #12 | 🇸🇸 South Sudan | 32.5% | 5,437,000 |
| #13 | 🇵🇰 Pakistan | 31.1% | 71,786,000 |
| #14 | 🇳🇵 Nepal | 29.4% | 11,993,000 |
| #15 | 🇨🇬 Republic of the Congo | 29.3% | 1,170,000 |
| #16 | 🇵🇭 Philippines | 29.0% | 30,483,000 |
| #17 | 🇯🇵 Japan | 28.7% | 36,060,000 |
| #18 | 🇦🇹 Austria | 27.8% | 2,437,000 |
| #19 | 🇮🇳 India | 27.7% | 389,816,000 |
| #20 | 🇦🇱 Albania | 27.6% | 771,000 |
| #21 | 🇨🇳 China | 27.5% | 394,826,000 |
| #22 | 🇹🇩 Chad | 27.4% | 4,547,000 |
| #23 | 🇮🇩 Indonesia | 27.0% | 75,696,000 |
| #24 | 🇭🇷 Croatia | 26.9% | 1,094,000 |
| #25 | 🇸🇰 Slovakia | 26.7% | 1,401,000 |
The Southeast Asia region alone makes up more than two-thirds of the global population exposed to flooding risk at 1.24 billion people.
China and India account for 395 million and 390 million people, respectively, with both nations at the top in terms of the absolute number of people at risk of rising water levels. The rest of the top five countries by total population at risk are Bangladesh (94 million people at risk), Indonesia (76 million people at risk), and Pakistan (72 million people at risk).
How Flooding is Already Affecting Countries Like Pakistan
While forecasted climate and natural disasters can often take years to manifest, flooding affected more than 100 million people in 2021. Recent summer floods in Pakistan have continued the trend in 2022.
With 31% of its population (72 million people) at risk of flooding, Pakistan is particularly vulnerable to floods.
In 2010, floods in Pakistan were estimated to have affected more than 18 million people. The recent floods, which started in June, are estimated to have affected more than 33 million people as more than one-third of the country is submerged underwater.
The Cost of Floods Today and in the Future
Although the rising human toll is by far the biggest concern that floods present, they also bring with them massive economic costs. Last year, droughts, floods, and storms caused economic losses totaling $224.2 billion worldwide, nearly doubling the 2001-2020 annual average of $117.8 billion.
A recent report forecasted that water risk (caused by droughts, floods, and storms) could eat up $5.6 trillion of global GDP by 2050, with floods projected to account for 36% of these direct losses.
As both human and economic losses caused by floods continue to mount, nations around the world will need to focus on preventative infrastructure and restorative solutions for ecosystems and communities already affected and most at risk of flooding.


Agriculture
Mapped: Meat Consumption By Country and Type
By examining meat consumption by country, we uncover regional differences in how much, and what type of meat people around the world prefer.
 Creator Program
Mapped: Meat Consumption By Country and Type
Meat is always on the menu in many parts of the world, as we can see when we map out meat consumption by country.
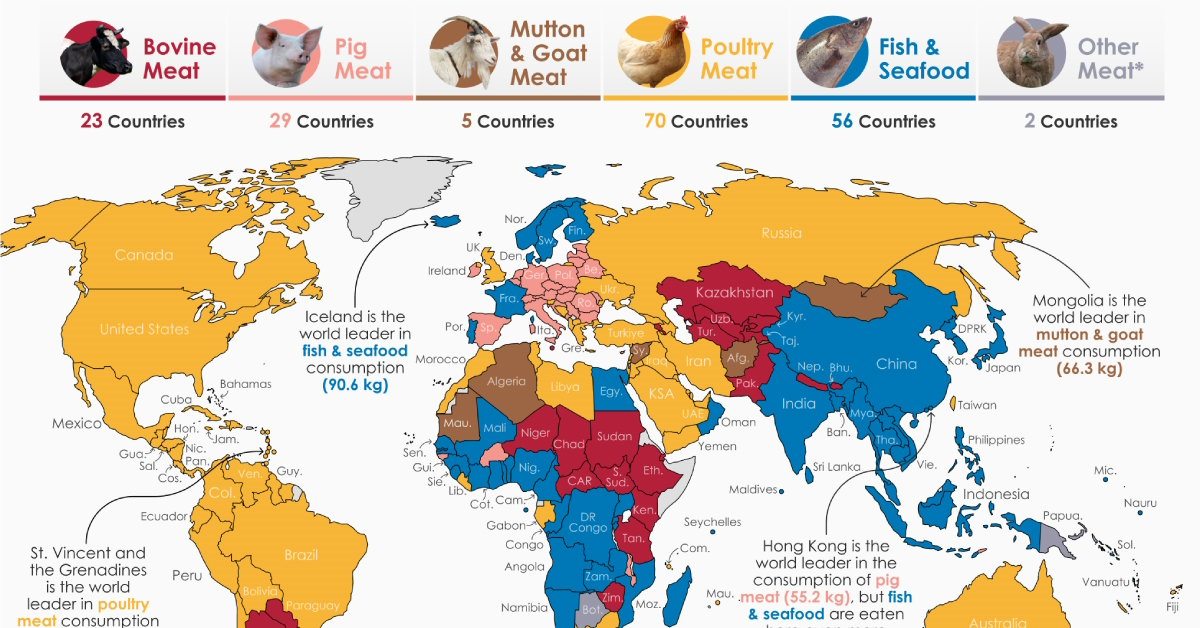
How do countries differ in how much, and what type of meat, they eat? In this colorful graphic, our creator theWORLDMAPS highlights the most consumed type of meat in every country in the world, using data from the UN’s Food and Agriculture Organization (FAO).
Each color denotes a different category of meat—beef, pork, mutton, poultry, seafood, or other—with annual consumption calculated per capita in kilograms (kg).
Let’s dig in to the data.
Is Fish Considered Meat?
Since meat is normally defined as the flesh of any animal (with the primary components being water, fat, and protein), that includes fish and other seafood.
But whether fish is considered “meat” or not depends a lot on cultural practices and dietary preferences, and has varied throughout history. Some earlier definitions of meat focused only on mammals, for example.
In Christianity for example, many denominations allow eating fish on fasting days when abstaining from meat. This was both due to distinctions between meat from warm-blooded land animals and cold-blooded animals (like fish), as well as the importance of fish consumption in parts of Europe where Christianity flourished.
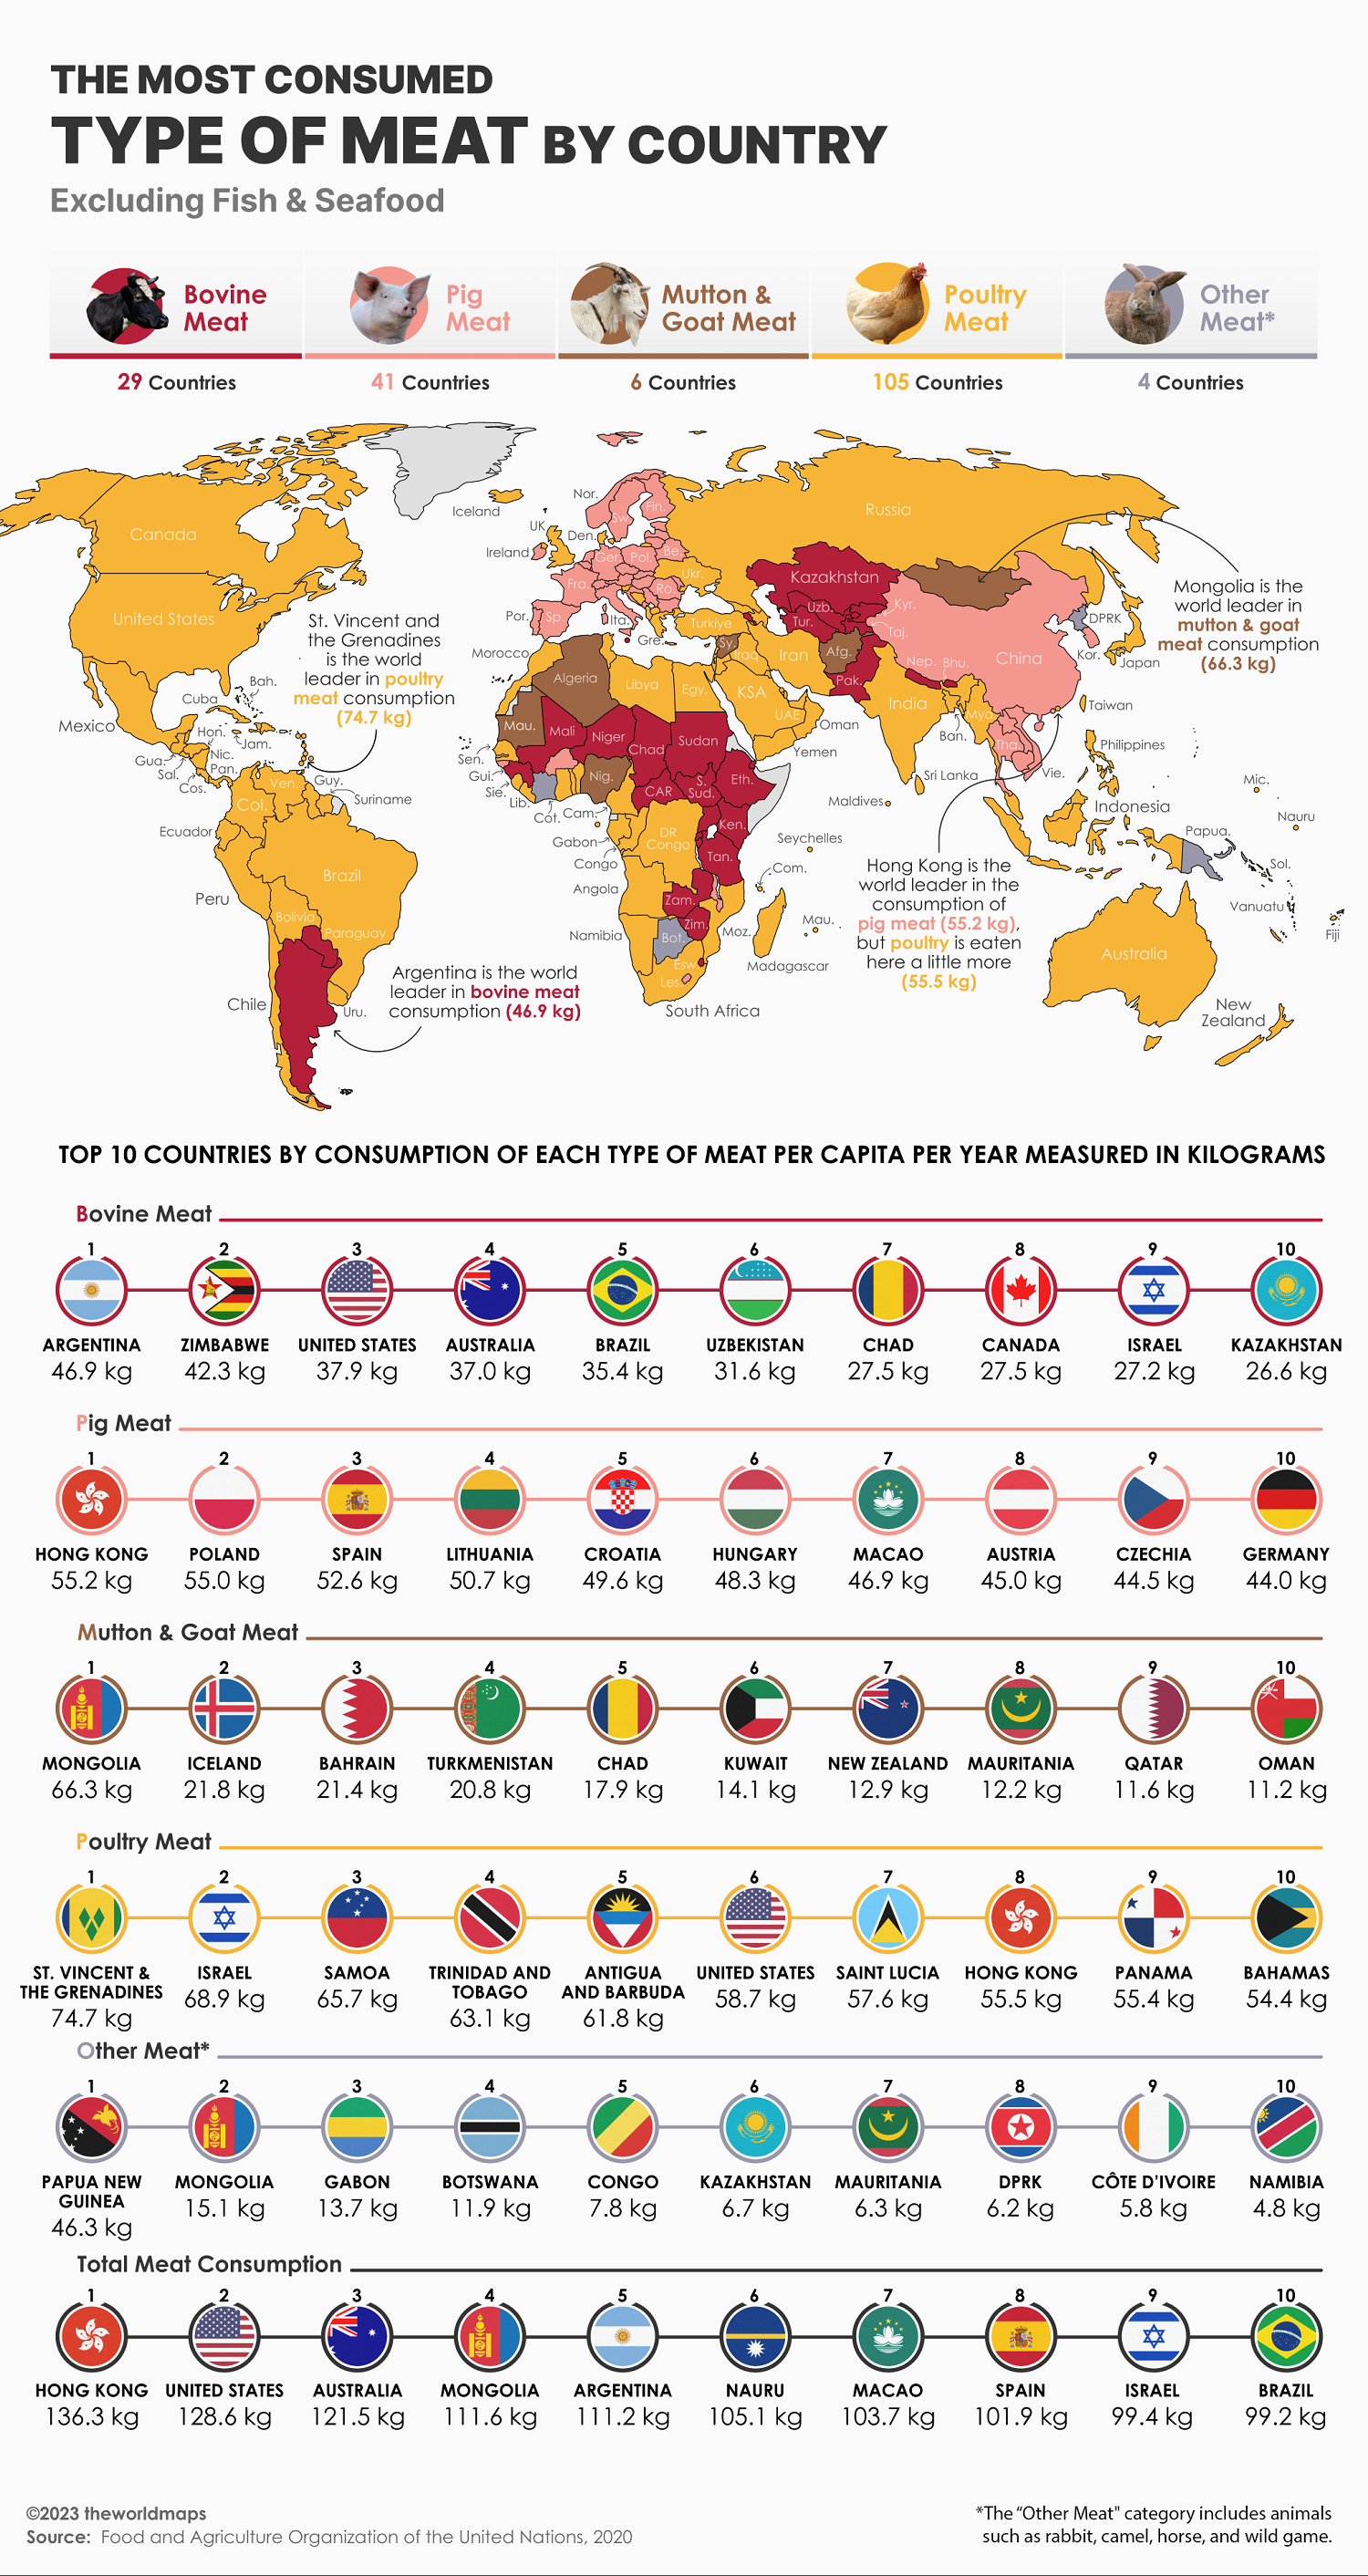
To account for both sides of the debate, we’ll cover meat consumption by country both with and without fish and seafood.
The Most Consumed Meat by Country (Including Seafood)
Just by glancing at the map and the below table, poultry stands out as the most popular meat by weight consumption in 70 countries, or about 40% of the entire database.
Note: Other meat includes less frequently farmed animals like rabbit, horse, and camel, as well as game—meat from wild animals.
| Country | Most Consumed Meat |
|---|---|
| 🇦🇫 Afghanistan | Mutton & Goat |
| 🇦🇱 Albania | Poultry |
| 🇩🇿 Algeria | Mutton & Goat |
| 🇦🇴 Angola | Fish & Seafood |
| 🇦🇬 Antigua & Barbuda | Poultry |
| 🇦🇷 Argentina | Bovine |
| 🇦🇲 Armenia | Bovine |
| 🇦🇺 Australia | Poultry |
| 🇦🇹 Austria | Pork |
| 🇦🇿 Azerbaijan | Poultry |
| 🇧🇸 Bahamas | Poultry |
| 🇧🇭 Bahrain | Poultry |
| 🇧🇩 Bangladesh | Fish & Seafood |
| 🇧🇧 Barbados | Poultry |
| 🇧🇾 Belarus | Pork |
| 🇧🇪 Belgium | Pork |
| 🇧🇿 Belize | Poultry |
| 🇧🇯 Benin | Fish & Seafood |
| 🇧🇹 Bhutan | Bovine |
| 🇧🇴 Bolivia | Poultry |
| 🇧🇦 Bosnia & Herzegovina | Poultry |
| 🇧🇼 Botswana | Other |
| 🇧🇷 Brazil | Poultry |
| 🇧🇬 Bulgaria | Pork |
| 🇧🇫 Burkina Faso | Pork |
| 🇧🇮 Burundi | Fish & Seafood |
| 🇨🇻 Cabo Verde | Poultry |
| 🇰🇭 Cambodia | Fish & Seafood |
| 🇨🇲 Cameroon | Fish & Seafood |
| 🇨🇦 Canada | Poultry |
| 🇨🇫 Central African Republic | Bovine |
| 🇹🇩 Chad | Bovine |
| 🇨🇱 Chile | Poultry |
| 🇨🇳 China | Fish & Seafood |
| 🇨🇴 Colombia | Poultry |
| 🇰🇲 Comoros | Poultry |
| 🇨🇬 Congo | Fish & Seafood |
| 🇨🇷 Costa Rica | Poultry |
| 🇨🇮 Côte d’Ivoire | Fish & Seafood |
| 🇭🇷 Croatia | Pork |
| 🇨🇺 Cuba | Poultry |
| 🇨🇾 Cyprus | Pork |
| 🇨🇿 Czechia | Pork |
| 🇩🇰 Denmark | Fish & Seafood |
| 🇩🇯 Djibouti | Bovine |
| 🇩🇲 Dominica | Poultry |
| 🇩🇴 Dominican Republic | Poultry |
| 🇨🇩 DR Congo | Fish & Seafood |
| 🇪🇨 Ecuador | Poultry |
| 🇪🇬 Egypt | Fish & Seafood |
| 🇸🇻 El Salvador | Poultry |
| 🇪🇪 Estonia | Pork |
| 🇸🇿 Eswatini | Bovine |
| 🇪🇹 Ethiopia | Bovine |
| 🇫🇯 Fiji | Poultry |
| 🇫🇮 Finland | Fish & Seafood |
| 🇫🇷 France | Fish & Seafood |
| 🇵🇫 French Polynesia | Poultry |
| 🇬🇦 Gabon | Poultry |
| 🇬🇲 Gambia | Fish & Seafood |
| 🇬🇪 Georgia | Poultry |
| 🇩🇪 Germany | Pork |
| 🇬🇭 Ghana | Fish & Seafood |
| 🇬🇷 Greece | Poultry |
| 🇬🇩 Grenada | Poultry |
| 🇬🇹 Guatemala | Poultry |
| 🇬🇳 Guinea | Fish & Seafood |
| 🇬🇼 Guinea-Bissau | Pork |
| 🇬🇾 Guyana | Poultry |
| 🇭🇹 Haiti | Poultry |
| 🇭🇳 Honduras | Poultry |
| 🇭🇰 Hong Kong | Fish & Seafood |
| 🇭🇺 Hungary | Pork |
| 🇮🇸 Iceland | Fish & Seafood |
| 🇮🇳 India | Fish & Seafood |
| 🇮🇩 Indonesia | Fish & Seafood |
| 🇮🇷 Iran | Poultry |
| 🇮🇶 Iraq | Poultry |
| 🇮🇪 Ireland | Pork |
| 🇮🇱 Israel | Poultry |
| 🇮🇹 Italy | Pork |
| 🇯🇲 Jamaica | Poultry |
| 🇯🇵 Japan | Fish & Seafood |
| 🇯🇴 Jordan | Poultry |
| 🇰🇿 Kazakhstan | Bovine |
| 🇰🇪 Kenya | Bovine |
| 🇰🇮 Kiribati | Fish & Seafood |
| 🇰🇼 Kuwait | Poultry |
| 🇰🇬 Kyrgyzstan | Bovine |
| 🇱🇦 Laos | Fish & Seafood |
| 🇱🇻 Latvia | Pork |
| 🇱🇧 Lebanon | Poultry |
| 🇱🇸 Lesotho | Pork |
| 🇱🇷 Liberia | Poultry |
| 🇱🇾 Libya | Poultry |
| 🇱🇹 Lithuania | Pork |
| 🇱🇺 Luxembourg | Pork |
| 🇲🇴 Macao | Fish & Seafood |
| 🇲🇬 Madagascar | Fish & Seafood |
| 🇲🇼 Malawi | Pork |
| 🇲🇾 Malaysia | Fish & Seafood |
| 🇲🇻 Maldives | Fish & Seafood |
| 🇲🇱 Mali | Fish & Seafood |
| 🇲🇹 Malta | Bovine |
| 🇲🇷 Mauritania | Mutton & Goat |
| 🇲🇺 Mauritius | Poultry |
| 🇲🇽 Mexico | Poultry |
| 🇫🇲 Micronesia | Fish & Seafood |
| 🇲🇩 Moldova | Pork |
| 🇲🇳 Mongolia | Mutton & Goat |
| 🇲🇪 Montenegro | Pork |
| 🇲🇦 Morocco | Poultry |
| 🇲🇿 Mozambique | Fish & Seafood |
| 🇲🇲 Myanmar | Fish & Seafood |
| 🇳🇦 Namibia | Fish & Seafood |
| 🇳🇷 Nauru | Fish & Seafood |
| 🇳🇵 Nepal | Bovine |
| 🇳🇱 Netherlands | Pork |
| 🇳🇨 New Caledonia | Poultry |
| 🇳🇿 New Zealand | Fish & Seafood |
| 🇳🇮 Nicaragua | Poultry |
| 🇳🇪 Niger | Bovine |
| 🇳🇬 Nigeria | Fish & Seafood |
| 🇰🇵 North Korea | Fish & Seafood |
| 🇲🇰 North Macedonia | Poultry |
| 🇳🇴 Norway | Fish & Seafood |
| 🇴🇲 Oman | Fish & Seafood |
| 🇵🇰 Pakistan | Bovine |
| 🇵🇦 Panama | Poultry |
| 🇵🇬 Papua New Guinea | Other |
| 🇵🇾 Paraguay | Bovine |
| 🇵🇪 Peru | Poultry |
| 🇵🇭 Philippines | Fish & Seafood |
| 🇵🇱 Poland | Pork |
| 🇵🇹 Portugal | Fish & Seafood |
| 🇶🇦 Qatar | Poultry |
| 🇷🇴 Romania | Pork |
| 🇷🇺 Russia | Poultry |
| 🇷🇼 Rwanda | Fish & Seafood |
| 🇰🇳 Saint Kitts & Nevis | Poultry |
| 🇱🇨 Saint Lucia | Poultry |
| 🇻🇨 Saint Vincent & the Grenadines | Poultry |
| 🇼🇸 Samoa | Poultry |
| 🇸🇹 Sao Tome & Principe | Fish & Seafood |
| 🇸🇦 Saudi Arabia | Poultry |
| 🇸🇳 Senegal | Fish & Seafood |
| 🇷🇸 Serbia | Pork |
| 🇸🇨 Seychelles | Fish & Seafood |
| 🇸🇱 Sierra Leone | Fish & Seafood |
| 🇸🇰 Slovakia | Pork |
| 🇸🇮 Slovenia | Poultry |
| 🇸🇧 Solomon Islands | Fish & Seafood |
| 🇿🇦 South Africa | Poultry |
| 🇰🇷 South Korea | Fish & Seafood |
| 🇸🇸 South Sudan | Bovine |
| 🇪🇸 Spain | Pork |
| 🇱🇰 Sri Lanka | Fish & Seafood |
| 🇸🇩 Sudan | Bovine |
| 🇸🇷 Suriname | Poultry |
| 🇸🇪 Sweden | Fish & Seafood |
| 🇨🇭 Switzerland | Pork |
| 🇸🇾 Syria | Mutton & Goat |
| 🇹🇼 Taiwan | Poultry |
| 🇹🇯 Tajikistan | Bovine |
| 🇹🇿 Tanzania | Bovine |
| 🇹🇭 Thailand | Fish & Seafood |
| 🇹🇱 Timor-Leste | Pork |
| 🇹🇬 Togo | Fish & Seafood |
| 🇹🇹 Trinidad & Tobago | Poultry |
| 🇹🇳 Tunisia | Poultry |
| 🇹🇷 Türkiye | Poultry |
| 🇹🇲 Turkmenistan | Bovine |
| 🇺🇸 U.S. | Poultry |
| 🇦🇪 UAE | Poultry |
| 🇺🇬 Uganda | Fish & Seafood |
| 🇬🇧 UK | Poultry |
| 🇺🇦 Ukraine | Poultry |
| 🇺🇾 Uruguay | Poultry |
| 🇺🇿 Uzbekistan | Bovine |
| 🇻🇺 Vanuatu | Fish & Seafood |
| 🇻🇪 Venezuela | Poultry |
| 🇻🇳 Vietnam | Fish & Seafood |
| 🇾🇪 Yemen | Poultry |
| 🇿🇲 Zambia | Fish & Seafood |
| 🇿🇼 Zimbabwe | Bovine |
Fish & Seafood ranks as the second most popularly consumed meat in 56 countries, most of them with significant coastlines.
Here’s a breakdown of how much of each type of meat is eaten per capita in each country, measured in kilograms.
| Country | Poultry | Pork | Fish & Seafood | Bovine | Mutton & Other |
|---|---|---|---|---|---|
| 🇦🇫 Afghanistan | 1.7 | 0.0 | 0.4 | 3.2 | 4.3 |
| 🇦🇱 Albania | 13.9 | 5.3 | 8.7 | 11.7 | 8.3 |
| 🇩🇿 Algeria | 6.4 | 0.0 | 3.8 | 3.8 | 8.4 |
| 🇦🇴 Angola | 8.4 | 7.0 | 14.1 | 3.4 | 1.1 |
| 🇦🇬 Antigua & Barbuda | 61.8 | 14.3 | 54.1 | 5.0 | 1.0 |
| 🇦🇷 Argentina | 46.2 | 14.4 | 6.8 | 46.9 | 2.6 |
| 🇦🇲 Armenia | 15.3 | 8.1 | 5.5 | 23.9 | 3.6 |
| 🇦🇺 Australia | 48.7 | 24.2 | 24.1 | 37.0 | 11.5 |
| 🇦🇹 Austria | 15.7 | 45.0 | 14.3 | 14.9 | 1.4 |
| 🇦🇿 Azerbaijan | 14.4 | 0.6 | 2.0 | 13.5 | 8.4 |
| 🇧🇸 Bahamas | 54.4 | 23.8 | 24.2 | 5.2 | 1.7 |
| 🇧🇭 Bahrain | 44.0 | 0.8 | 16.3 | 13.7 | 22.2 |
| 🇧🇩 Bangladesh | 1.6 | 0.0 | 26.7 | 1.3 | 1.4 |
| 🇧🇧 Barbados | 49.3 | 12.3 | 42.9 | 8.0 | 3.4 |
| 🇧🇾 Belarus | 32.2 | 39.2 | 11.8 | 18.6 | 0.4 |
| 🇧🇪 Belgium | 12.4 | 32.8 | 22.7 | 14.0 | 2.6 |
| 🇧🇿 Belize | 23.8 | 20.8 | 13.3 | 3.6 | 0.3 |
| 🇧🇯 Benin | 8.7 | 0.7 | 16.2 | 3.6 | 1.5 |
| 🇧🇹 Bhutan | 4.6 | 1.9 | 7.3 | 9.3 | 0.3 |
| 🇧🇴 Bolivia | 40.9 | 9.7 | 2.8 | 21.6 | 4.9 |
| 🇧🇦 Bosnia & Herzegovina | 20.0 | 9.3 | 7.3 | 12.8 | 0.6 |
| 🇧🇼 Botswana | 3.5 | 0.5 | 2.6 | 10.2 | 14.3 |
| 🇧🇷 Brazil | 48.4 | 14.2 | 8.1 | 35.4 | 1.2 |
| 🇧🇬 Bulgaria | 21.5 | 30.0 | 7.4 | 3.5 | 2.0 |
| 🇧🇫 Burkina Faso | 9.5 | 15.2 | 8.9 | 5.3 | 4.3 |
| 🇧🇮 Burundi | 0.6 | 0.9 | 2.6 | 0.9 | 0.8 |
| 🇨🇻 Cabo Verde | 19.4 | 7.3 | 10.8 | 1.7 | 1.9 |
| 🇰🇭 Cambodia | 2.8 | 5.9 | 45.8 | 4.2 | 0.0 |
| 🇨🇲 Cameroon | 3.3 | 1.2 | 19.1 | 3.1 | 4.0 |
| 🇨🇦 Canada | 40.1 | 21.4 | 20.7 | 27.5 | 1.6 |
| 🇨🇫 Central African Republic | 2.6 | 4.1 | 7.4 | 20.8 | 10.4 |
| 🇹🇩 Chad | 0.5 | 0.2 | 6.6 | 27.5 | 18.7 |
| 🇨🇱 Chile | 36.1 | 22.1 | 14.8 | 23.7 | 1.3 |
| 🇨🇳 China | 15.6 | 35.5 | 39.9 | 6.8 | 4.2 |
| 🇨🇴 Colombia | 33.8 | 10.5 | 8.9 | 13.7 | 0.1 |
| 🇰🇲 Comoros | 26.8 | 0.1 | 14.3 | 3.0 | 1.2 |
| 🇨🇬 Congo | 23.2 | 6.8 | 24.5 | 1.9 | 8.1 |
| 🇨🇷 Costa Rica | 34.3 | 12.7 | 18.0 | 11.4 | 0.0 |
| 🇨🇮 Côte d’Ivoire | 2.9 | 1.0 | 23.2 | 1.4 | 6.5 |
| 🇭🇷 Croatia | 16.6 | 49.6 | 19.1 | 11.2 | 2.1 |
| 🇨🇺 Cuba | 37.7 | 21.6 | 6.1 | 7.4 | 4.9 |
| 🇨🇾 Cyprus | 28.4 | 36.8 | 25.5 | 5.9 | 4.6 |
| 🇨🇿 Czechia | 23.5 | 44.5 | 10.5 | 10.2 | 0.9 |
| 🇩🇰 Denmark | 24.6 | 13.5 | 26.5 | 24.3 | 1.3 |
| 🇩🇯 Djibouti | 3.6 | 0.1 | 3.5 | 6.2 | 5.4 |
| 🇩🇲 Dominica | 39.4 | 11.4 | 27.9 | 8.1 | 1.1 |
| 🇩🇴 Dominican Republic | 32.2 | 9.9 | 8.5 | 6.3 | 0.2 |
| 🇨🇩 DR Congo | 1.3 | 0.5 | 4.2 | 0.3 | 1.2 |
| 🇪🇨 Ecuador | 18.9 | 12.9 | 8.2 | 13.3 | 0.4 |
| 🇪🇬 Egypt | 14.3 | 0.0 | 27.1 | 7.4 | 1.5 |
| 🇸🇻 El Salvador | 25.9 | 4.7 | 6.5 | 8.2 | 0.0 |
| 🇪🇪 Estonia | 21.1 | 37.7 | 14.7 | 8.5 | 0.5 |
| 🇸🇿 Eswatini | 7.3 | 2.0 | 4.3 | 16.1 | 2.0 |
| 🇪🇹 Ethiopia | 0.6 | 0.0 | 0.5 | 3.8 | 3.5 |
| 🇫🇯 Fiji | 28.8 | 3.7 | 26.5 | 3.1 | 5.3 |
| 🇫🇮 Finland | 21.1 | 30.8 | 33.5 | 18.4 | 1.1 |
| 🇫🇷 France | 23.0 | 31.0 | 33.2 | 20.8 | 3.5 |
| 🇵🇫 French Polynesia | 48.8 | 14.3 | 47.3 | 21.4 | 3.7 |
| 🇬🇦 Gabon | 39.7 | 8.3 | 28.7 | 4.7 | 14.3 |
| 🇬🇲 Gambia | 10.6 | 0.3 | 25.2 | 3.4 | 1.1 |
| 🇬🇪 Georgia | 18.2 | 9.3 | 10.0 | 5.8 | 1.8 |
| 🇩🇪 Germany | 18.3 | 44.0 | 12.6 | 14.6 | 1.8 |
| 🇬🇭 Ghana | 11.6 | 1.2 | 24.9 | 1.6 | 4.2 |
| 🇬🇷 Greece | 25.6 | 25.0 | 21.7 | 14.5 | 9.4 |
| 🇬🇩 Grenada | 37.4 | 14.6 | 33.8 | 4.1 | 1.4 |
| 🇬🇹 Guatemala | 28.7 | 3.6 | 3.0 | 11.7 | 0.3 |
| 🇬🇳 Guinea | 2.7 | 0.2 | 9.7 | 8.2 | 2.8 |
| 🇬🇼 Guinea-Bissau | 3.1 | 7.2 | 1.2 | 3.7 | 1.3 |
| 🇬🇾 Guyana | 41.4 | 5.0 | 25.0 | 4.2 | 1.2 |
| 🇭🇹 Haiti | 10.9 | 4.0 | 5.0 | 4.2 | 0.9 |
| 🇭🇳 Honduras | 21.6 | 5.0 | 2.6 | 6.0 | 0.1 |
| 🇭🇰 Hong Kong | 55.5 | 55.2 | 65.8 | 22.5 | 3.0 |
| 🇭🇺 Hungary | 29.8 | 48.3 | 6.4 | 4.6 | 0.3 |
| 🇮🇸 Iceland | 30.0 | 21.8 | 90.6 | 14.0 | 24.4 |
| 🇮🇳 India | 2.6 | 0.2 | 8.0 | 1.1 | 0.6 |
| 🇮🇩 Indonesia | 13.7 | 0.9 | 44.4 | 2.8 | 0.5 |
| 🇮🇷 Iran | 26.0 | 0.0 | 12.6 | 7.6 | 4.5 |
| 🇮🇶 Iraq | 5.4 | 0.0 | 3.6 | 3.1 | 1.7 |
| 🇮🇪 Ireland | 24.7 | 31.1 | 22.6 | 19.8 | 3.6 |
| 🇮🇱 Israel | 68.9 | 1.6 | 24.7 | 27.2 | 1.7 |
| 🇮🇹 Italy | 19.6 | 32.9 | 29.2 | 15.9 | 1.8 |
| 🇯🇲 Jamaica | 53.9 | 3.1 | 25.2 | 3.8 | 0.7 |
| 🇯🇵 Japan | 22.3 | 21.3 | 46.2 | 9.6 | 0.3 |
| 🇯🇴 Jordan | 26.1 | 0.0 | 5.1 | 6.8 | 4.8 |
| 🇰🇿 Kazakhstan | 21.2 | 8.2 | 2.8 | 26.6 | 15.9 |
| 🇰🇪 Kenya | 1.3 | 0.4 | 2.9 | 4.5 | 4.5 |
| 🇰🇮 Kiribati | 26.6 | 10.3 | 73.2 | 1.9 | 0.3 |
| 🇰🇼 Kuwait | 46.6 | 0.0 | 14.0 | 9.4 | 16.7 |
| 🇰🇬 Kyrgyzstan | 5.2 | 2.1 | 1.1 | 14.9 | 10.0 |
| 🇱🇦 Laos | 6.6 | 13.5 | 24.1 | 8.4 | 0.5 |
| 🇱🇻 Latvia | 26.2 | 38.4 | 25.0 | 5.3 | 0.8 |
| 🇱🇧 Lebanon | 18.6 | 0.6 | 8.7 | 9.2 | 1.1 |
| 🇱🇸 Lesotho | 2.1 | 3.8 | 3.0 | 2.0 | 3.9 |
| 🇱🇷 Liberia | 11.3 | 5.3 | 4.3 | 0.4 | 2.1 |
| 🇱🇾 Libya | 32.8 | 0.0 | 14.3 | 2.9 | 6.5 |
| 🇱🇹 Lithuania | 33.3 | 50.7 | 33.1 | 5.9 | 1.1 |
| 🇱🇺 Luxembourg | 18.1 | 33.1 | 31.7 | 25.7 | 2.0 |
| 🇲🇴 Macao | 45.6 | 46.9 | 73.2 | 9.4 | 1.8 |
| 🇲🇬 Madagascar | 3.1 | 1.0 | 4.0 | 1.3 | 0.5 |
| 🇲🇼 Malawi | 5.7 | 11.8 | 10.1 | 2.9 | 3.1 |
| 🇲🇾 Malaysia | 50.2 | 7.4 | 54.7 | 6.0 | 1.0 |
| 🇲🇻 Maldives | 11.0 | 0.4 | 83.1 | 5.9 | 0.8 |
| 🇲🇱 Mali | 2.4 | 0.1 | 8.5 | 3.6 | 2.6 |
| 🇲🇹 Malta | 25.2 | 25.8 | 22.8 | 26.4 | 1.8 |
| 🇲🇷 Mauritania | 6.3 | 0.0 | 8.4 | 6.4 | 18.4 |
| 🇲🇺 Mauritius | 38.7 | 3.2 | 24.0 | 4.5 | 4.2 |
| 🇲🇽 Mexico | 35.9 | 19.1 | 13.6 | 14.6 | 1.5 |
| 🇫🇲 Micronesia | 38.2 | 16.2 | 47.4 | 4.9 | 0.2 |
| 🇲🇩 Moldova | 17.2 | 19.2 | 11.7 | 1.9 | 0.3 |
| 🇲🇳 Mongolia | 3.0 | 0.6 | 0.6 | 26.6 | 81.4 |
| 🇲🇪 Montenegro | 17.1 | 43.2 | 15.6 | 15.0 | 2.1 |
| 🇲🇦 Morocco | 24.0 | 0.0 | 18.4 | 7.7 | 6.9 |
| 🇲🇿 Mozambique | 3.8 | 3.1 | 13.4 | 0.6 | 0.1 |
| 🇲🇲 Myanmar | 29.9 | 20.1 | 45.0 | 9.3 | 1.7 |
| 🇳🇦 Namibia | 10.2 | 4.5 | 11.9 | 8.8 | 8.9 |
| 🇳🇷 Nauru | 51.0 | 28.2 | 51.0 | 19.1 | 6.9 |
| 🇳🇵 Nepal | 2.3 | 1.0 | 3.5 | 8.2 | 2.7 |
| 🇳🇱 Netherlands | 10.0 | 27.7 | 21.9 | 16.2 | 5.2 |
| 🇳🇨 New Caledonia | 40.9 | 17.4 | 23.4 | 17.7 | 2.3 |
| 🇳🇿 New Zealand | 26.0 | 25.2 | 26.4 | 18.6 | 15.3 |
| 🇳🇮 Nicaragua | 21.8 | 5.3 | 6.6 | 2.2 | 0.4 |
| 🇳🇪 Niger | 1.0 | 0.1 | 1.8 | 2.8 | 4.4 |
| 🇳🇬 Nigeria | 1.2 | 1.5 | 6.7 | 1.6 | 2.8 |
| 🇰🇵 North Korea | 1.8 | 4.3 | 11.0 | 0.8 | 6.7 |
| 🇲🇰 North Macedonia | 20.0 | 12.6 | 6.2 | 6.8 | 0.9 |
| 🇳🇴 Norway | 20.0 | 23.7 | 50.2 | 17.8 | 5.8 |
| 🇴🇲 Oman | 19.7 | 0.4 | 26.1 | 9.0 | 14.3 |
| 🇵🇰 Pakistan | 6.2 | 0.0 | 1.6 | 9.8 | 2.6 |
| 🇵🇦 Panama | 55.4 | 15.9 | 13.7 | 14.5 | 1.0 |
| 🇵🇬 Papua New Guinea | 3.9 | 9.9 | 14.6 | 0.8 | 47.8 |
| 🇵🇾 Paraguay | 9.6 | 8.8 | 4.0 | 21.9 | 0.6 |
| 🇵🇪 Peru | 42.7 | 4.5 | 27.1 | 4.2 | 1.9 |
| 🇵🇭 Philippines | 15.9 | 14.5 | 29.1 | 3.1 | 0.3 |
| 🇵🇱 Poland | 32.9 | 55.0 | 12.5 | 1.5 | 0.1 |
| 🇵🇹 Portugal | 30.6 | 38.1 | 60.0 | 18.8 | 2.8 |
| 🇶🇦 Qatar | 54.3 | 1.2 | 21.1 | 8.4 | 12.1 |
| 🇷🇴 Romania | 23.9 | 34.5 | 8.3 | 5.2 | 2.7 |
| 🇷🇺 Russia | 30.8 | 28.2 | 21.7 | 12.9 | 5.1 |
| 🇷🇼 Rwanda | 1.5 | 1.0 | 4.6 | 2.7 | 3.2 |
| 🇰🇳 Saint Kitts & Nevis | 48.7 | 15.5 | 38.8 | 2.9 | 2.5 |
| 🇱🇨 Saint Lucia | 57.6 | 14.9 | 33.6 | 3.8 | 2.0 |
| 🇻🇨 Saint Vincent & the Grenadines | 74.7 | 11.3 | 19.4 | 7.8 | 0.7 |
| 🇼🇸 Samoa | 65.7 | 12.3 | 47.6 | 6.9 | 3.5 |
| 🇸🇹 Sao Tome & Principe | 17.1 | 4.7 | 27.7 | 1.7 | 0.1 |
| 🇸🇦 Saudi Arabia | 43.0 | 0.0 | 11.7 | 4.4 | 7.7 |
| 🇸🇳 Senegal | 7.4 | 1.2 | 11.9 | 5.0 | 3.7 |
| 🇷🇸 Serbia | 14.1 | 37.3 | 6.7 | 6.1 | 4.1 |
| 🇸🇨 Seychelles | 36.9 | 13.7 | 56.8 | 9.2 | 2.7 |
| 🇸🇱 Sierra Leone | 5.4 | 1.0 | 25.5 | 1.3 | 1.9 |
| 🇸🇰 Slovakia | 16.9 | 38.8 | 10.2 | 5.8 | 0.9 |
| 🇸🇮 Slovenia | 30.4 | 25.8 | 13.2 | 15.3 | 1.1 |
| 🇸🇧 Solomon Islands | 6.1 | 4.4 | 28.1 | 1.8 | 0.1 |
| 🇿🇦 South Africa | 34.9 | 4.2 | 6.5 | 17.2 | 3.5 |
| 🇰🇷 South Korea | 22.8 | 38.4 | 55.3 | 16.9 | 0.5 |
| 🇸🇸 South Sudan | 4.3 | 0.0 | 2.9 | 12.4 | 4.3 |
| 🇪🇸 Spain | 33.6 | 52.6 | 40.8 | 12.3 | 3.4 |
| 🇱🇰 Sri Lanka | 10.4 | 0.1 | 29.0 | 1.2 | 0.1 |
| 🇸🇩 Sudan | 1.9 | 0.0 | 1.1 | 8.0 | 10.5 |
| 🇸🇷 Suriname | 49.6 | 8.0 | 16.5 | 4.4 | 0.3 |
| 🇸🇪 Sweden | 15.4 | 28.6 | 32.2 | 22.5 | 1.5 |
| 🇨🇭 Switzerland | 16.9 | 27.8 | 16.0 | 19.1 | 2.4 |
| 🇸🇾 Syria | 6.4 | 0.0 | 2.2 | 2.2 | 7.3 |
| 🇹🇼 Taiwan | 41.6 | 38.4 | 29.8 | 6.1 | 0.9 |
| 🇹🇯 Tajikistan | 3.5 | 0.1 | 0.7 | 25.8 | 7.8 |
| 🇹🇿 Tanzania | 1.5 | 0.3 | 6.4 | 7.8 | 1.6 |
| 🇹🇭 Thailand | 11.4 | 13.1 | 29.2 | 1.2 | 0.0 |
| 🇹🇱 Timor-Leste | 9.4 | 11.5 | 6.4 | 1.6 | 0.4 |
| 🇹🇬 Togo | 7.2 | 2.3 | 11.7 | 0.8 | 2.2 |
| 🇹🇹 Trinidad & Tobago | 63.1 | 5.6 | 23.6 | 5.7 | 1.5 |
| 🇹🇳 Tunisia | 17.9 | 0.0 | 14.1 | 3.7 | 5.8 |
| 🇹🇷 Türkiye | 20.0 | 0.0 | 5.5 | 16.0 | 1.3 |
| 🇹🇲 Turkmenistan | 6.1 | 0.1 | 2.8 | 22.5 | 20.8 |
| 🇺🇸 U.S. | 58.7 | 30.6 | 22.8 | 37.9 | 1.4 |
| 🇦🇪 UAE | 31.1 | 0.0 | 25.4 | 6.7 | 10.4 |
| 🇺🇬 Uganda | 1.5 | 2.9 | 14.3 | 3.6 | 1.0 |
| 🇬🇧 UK | 32.7 | 24.0 | 17.9 | 17.4 | 5.0 |
| 🇺🇦 Ukraine | 24.9 | 16.7 | 13.8 | 7.2 | 0.7 |
| 🇺🇾 Uruguay | 21.0 | 14.1 | 9.1 | 19.4 | 3.5 |
| 🇺🇿 Uzbekistan | 3.1 | 0.2 | 4.0 | 31.6 | 6.1 |
| 🇻🇺 Vanuatu | 14.6 | 12.4 | 29.0 | 7.2 | 0.3 |
| 🇻🇪 Venezuela | 16.1 | 4.4 | 10.2 | 12.0 | 0.3 |
| 🇻🇳 Vietnam | 15.8 | 38.2 | 39.6 | 6.1 | 0.5 |
| 🇾🇪 Yemen | 11.2 | 0.0 | 3.0 | 3.0 | 4.5 |
| 🇿🇲 Zambia | 2.6 | 1.5 | 13.1 | 9.3 | 2.7 |
| 🇿🇼 Zimbabwe | 4.6 | 0.7 | 3.0 | 42.3 | 4.3 |
The world’s largest consumers of meat per capita? Hong Kong, Iceland, and Macao have the highest total meat consumption, all above 170 kg (370 lbs) per capita.
We take a brief look through the biggest consumers of each type of meat below.
Who Eats the Most Poultry?
While the U.S. and China eat the most chicken by absolute numbers, the countries rank 7th and 112th respectively when it comes to poultry consumption on a per capita basis.
Several island nations—St. Vincent and the Grenadines, Trinidad & Tobago, Samoa—along with Israel eat more than 60 kilograms of poultry meat (about 15 large birds) per person on an annual basis.
Regionally, poultry consumption can be seen spanning almost all of the Americas, as well as in the UK and former British colonies Australia and South Africa, and in the Middle East.
Who Eats the Most Pork?
Despite eating more seafood and poultry, Hong Kong leads the world in pork consumption per capita annually at 55 kg (121 lbs). This is almost equivalent to the average amount of retail pork harvested from a single 250 lb pig.
Poland and Spain—who are also top pork producers—rank close behind Hong Kong with similar pork consumption numbers. Indeed, we can see pork as the most consumed meat in many European countries with local histories of pork foods, as well as in a few countries in Africa including Burkina Faso and one Southeast Asian country, Timor-Leste.
Who Eats the Most Fish and Seafood?
In the middle of the North Atlantic ocean, Iceland eats the most fish and seafood in the world, at a staggering 90 kg (nearly 200 lbs), per person per year. That also gives Iceland the crown for the highest per-capita consumption of any single type of meat.
Behind Iceland are other island and high coastline nations, including the Maldives, Hong Kong, Macao, and Portugal. Regionally we can see the importance of seafood reflected in East and South Asia, the Atlantic coastline of Africa, and the Nordic countries in Europe.
Who Eats the Most Beef?
Argentina’s 46-million-strong population eats nearly 47 kg (103 lbs) of bovine meat per person per year, the most by any country in the UN’s database.
The South American country has a rich culinary history with beef, as cattle brought by Spanish settlers flourished on the grassy plains of the region. Such is cattle’s importance on the continent that the gaucho—a horseman engaged in cattle work—is a folk symbol in Argentina, Uruguay and parts of Brazil (which ranks 5th in beef consumption).
The map of beef consumption highlights Central Asian countries including Uzbekistan and Eastern African countries including Ethiopia.
Who Eats the Most Mutton & Other Meat?
The people of Mongolia are unrivaled in their consumption of mutton and goat meat, devouring an impressive 66 kilograms (145 pounds) per capita annually. This voracious appetite for meat is deeply rooted in their heritage as a nation of skilled shepherds.
Papua New Guinea, meanwhile, tops the “other meat” consumption rankings. The country is the largest producer of game meat in the world, due to its mostly rural and indigenous population relying on hunting. One 2023 study found that a sample of villages in the country primarily hunted wild deer and boar for meat, although marsupials like bandicoots, tree-kangaroos, and cuscus were occasionally hunted and consumed as well.
Mongolia also ranks highly in consumption of other meat per capita, likely due to their traditional consumption of horse meat. The country produced just over 100,000 tons of horse meat in 2020, one-sixth of the country’s total meat production that year.
Mapping Meat Consumption By Country, Without Seafood
What happens to each country’s meat consumption habits if we remove fish and seafood from the dataset? The map, and the rankings change quite a bit.
Most of the blue on the map is replaced with a wash of yellow, indicating the global popularity of poultry meat as a cheap and efficient source of protein. However, much of East Asia including China and European countries like France and Sweden consume more pork.
The rankings for total meat consumption also shuffle.
| Country | Total (With Seafood) | Total (Without Seafood) |
|---|---|---|
| 🇦🇫 Afghanistan | 9.6 | 9.3 |
| 🇦🇱 Albania | 47.8 | 39.1 |
| 🇩🇿 Algeria | 22.4 | 18.6 |
| 🇦🇴 Angola | 34.1 | 19.9 |
| 🇦🇬 Antigua & Barbuda | 136.2 | 82.1 |
| 🇦🇷 Argentina | 116.9 | 110.2 |
| 🇦🇲 Armenia | 56.4 | 50.9 |
| 🇦🇺 Australia | 145.6 | 121.5 |
| 🇦🇹 Austria | 91.2 | 76.9 |
| 🇦🇿 Azerbaijan | 38.9 | 36.9 |
| 🇧🇸 Bahamas | 109.3 | 85.1 |
| 🇧🇭 Bahrain | 96.9 | 80.6 |
| 🇧🇩 Bangladesh | 31.1 | 4.3 |
| 🇧🇧 Barbados | 115.8 | 73.0 |
| 🇧🇾 Belarus | 102.2 | 90.4 |
| 🇧🇪 Belgium | 84.5 | 61.9 |
| 🇧🇿 Belize | 61.8 | 48.5 |
| 🇧🇯 Benin | 30.8 | 14.6 |
| 🇧🇹 Bhutan | 23.4 | 16.1 |
| 🇧🇴 Bolivia | 79.9 | 77.1 |
| 🇧🇦 Bosnia & Herzegovina | 50.1 | 42.8 |
| 🇧🇼 Botswana | 31.1 | 28.6 |
| 🇧🇷 Brazil | 107.2 | 99.2 |
| 🇧🇬 Bulgaria | 64.3 | 56.9 |
| 🇧🇫 Burkina Faso | 43.2 | 34.3 |
| 🇧🇮 Burundi | 5.7 | 3.1 |
| 🇨🇻 Cabo Verde | 41.2 | 30.4 |
| 🇰🇭 Cambodia | 58.6 | 12.9 |
| 🇨🇲 Cameroon | 30.8 | 11.6 |
| 🇨🇦 Canada | 111.3 | 90.6 |
| 🇨🇫 Central African Republic | 45.1 | 37.8 |
| 🇹🇩 Chad | 53.5 | 46.9 |
| 🇨🇱 Chile | 97.8 | 83.0 |
| 🇨🇳 China | 102.0 | 62.1 |
| 🇨🇴 Colombia | 67.0 | 58.1 |
| 🇰🇲 Comoros | 45.5 | 31.2 |
| 🇨🇬 Congo | 64.5 | 40.0 |
| 🇨🇷 Costa Rica | 76.4 | 58.5 |
| 🇨🇮 Côte d’Ivoire | 35.0 | 11.8 |
| 🇭🇷 Croatia | 98.6 | 79.5 |
| 🇨🇺 Cuba | 77.6 | 71.6 |
| 🇨🇾 Cyprus | 101.1 | 75.6 |
| 🇨🇿 Czechia | 89.6 | 79.2 |
| 🇩🇰 Denmark | 90.1 | 63.7 |
| 🇩🇯 Djibouti | 18.9 | 15.4 |
| 🇩🇲 Dominica | 87.9 | 60.1 |
| 🇩🇴 Dominican Republic | 57.1 | 48.6 |
| 🇨🇩 DR Congo | 7.4 | 3.3 |
| 🇪🇨 Ecuador | 53.6 | 45.4 |
| 🇪🇬 Egypt | 50.3 | 23.3 |
| 🇸🇻 El Salvador | 45.4 | 38.8 |
| 🇪🇪 Estonia | 82.4 | 67.8 |
| 🇸🇿 Eswatini | 31.7 | 27.4 |
| 🇪🇹 Ethiopia | 8.4 | 7.9 |
| 🇫🇯 Fiji | 67.4 | 40.9 |
| 🇫🇮 Finland | 104.8 | 71.4 |
| 🇫🇷 France | 111.5 | 78.2 |
| 🇵🇫 French Polynesia | 135.4 | 88.2 |
| 🇬🇦 Gabon | 95.7 | 67.0 |
| 🇬🇲 Gambia | 40.6 | 15.5 |
| 🇬🇪 Georgia | 45.1 | 35.1 |
| 🇩🇪 Germany | 91.4 | 78.8 |
| 🇬🇭 Ghana | 43.5 | 18.5 |
| 🇬🇷 Greece | 96.2 | 74.5 |
| 🇬🇩 Grenada | 91.3 | 57.5 |
| 🇬🇹 Guatemala | 47.2 | 44.2 |
| 🇬🇳 Guinea | 23.6 | 13.9 |
| 🇬🇼 Guinea-Bissau | 16.5 | 15.3 |
| 🇬🇾 Guyana | 76.8 | 51.8 |
| 🇭🇹 Haiti | 25.0 | 20.0 |
| 🇭🇳 Honduras | 35.4 | 32.8 |
| 🇭🇰 Hong Kong | 202.1 | 136.3 |
| 🇭🇺 Hungary | 89.3 | 82.9 |
| 🇮🇸 Iceland | 180.9 | 90.2 |
| 🇮🇳 India | 12.6 | 4.6 |
| 🇮🇩 Indonesia | 62.3 | 17.9 |
| 🇮🇷 Iran | 50.6 | 38.0 |
| 🇮🇶 Iraq | 13.8 | 10.2 |
| 🇮🇪 Ireland | 101.8 | 79.2 |
| 🇮🇱 Israel | 124.1 | 99.4 |
| 🇮🇹 Italy | 99.4 | 70.2 |
| 🇯🇲 Jamaica | 86.7 | 61.5 |
| 🇯🇵 Japan | 99.6 | 53.4 |
| 🇯🇴 Jordan | 42.8 | 37.7 |
| 🇰🇿 Kazakhstan | 74.7 | 71.9 |
| 🇰🇪 Kenya | 13.6 | 10.7 |
| 🇰🇮 Kiribati | 112.4 | 39.2 |
| 🇰🇼 Kuwait | 86.6 | 72.7 |
| 🇰🇬 Kyrgyzstan | 33.2 | 32.1 |
| 🇱🇦 Laos | 53.1 | 29.0 |
| 🇱🇻 Latvia | 95.8 | 70.8 |
| 🇱🇧 Lebanon | 38.2 | 29.5 |
| 🇱🇸 Lesotho | 14.7 | 11.7 |
| 🇱🇷 Liberia | 23.4 | 19.1 |
| 🇱🇾 Libya | 56.5 | 42.2 |
| 🇱🇹 Lithuania | 123.9 | 90.9 |
| 🇱🇺 Luxembourg | 110.6 | 78.9 |
| 🇲🇴 Macao | 176.9 | 103.7 |
| 🇲🇬 Madagascar | 9.8 | 5.8 |
| 🇲🇼 Malawi | 33.7 | 23.6 |
| 🇲🇾 Malaysia | 119.4 | 64.7 |
| 🇲🇻 Maldives | 101.2 | 18.1 |
| 🇲🇱 Mali | 17.1 | 8.6 |
| 🇲🇹 Malta | 102.0 | 79.1 |
| 🇲🇷 Mauritania | 39.5 | 31.1 |
| 🇲🇺 Mauritius | 74.5 | 50.5 |
| 🇲🇽 Mexico | 84.7 | 71.1 |
| 🇫🇲 Micronesia | 106.7 | 59.4 |
| 🇲🇩 Moldova | 50.3 | 38.6 |
| 🇲🇳 Mongolia | 112.1 | 111.6 |
| 🇲🇪 Montenegro | 93.0 | 77.4 |
| 🇲🇦 Morocco | 57.0 | 38.6 |
| 🇲🇿 Mozambique | 21.0 | 7.6 |
| 🇲🇲 Myanmar | 106.0 | 61.0 |
| 🇳🇦 Namibia | 44.3 | 32.4 |
| 🇳🇷 Nauru | 156.2 | 105.1 |
| 🇳🇵 Nepal | 17.7 | 14.2 |
| 🇳🇱 Netherlands | 81.0 | 59.1 |
| 🇳🇨 New Caledonia | 101.7 | 78.3 |
| 🇳🇿 New Zealand | 111.4 | 85.0 |
| 🇳🇮 Nicaragua | 36.3 | 29.6 |
| 🇳🇪 Niger | 10.1 | 8.3 |
| 🇳🇬 Nigeria | 13.8 | 7.0 |
| 🇰🇵 North Korea | 24.6 | 13.6 |
| 🇲🇰 North Macedonia | 46.6 | 40.3 |
| 🇳🇴 Norway | 117.4 | 67.2 |
| 🇴🇲 Oman | 69.5 | 43.4 |
| 🇵🇰 Pakistan | 20.2 | 18.6 |
| 🇵🇦 Panama | 100.5 | 86.8 |
| 🇵🇬 Papua New Guinea | 77.0 | 62.4 |
| 🇵🇾 Paraguay | 44.9 | 40.9 |
| 🇵🇪 Peru | 80.5 | 53.4 |
| 🇵🇭 Philippines | 62.8 | 33.7 |
| 🇵🇱 Poland | 102.0 | 89.5 |
| 🇵🇹 Portugal | 150.2 | 90.2 |
| 🇶🇦 Qatar | 96.9 | 75.9 |
| 🇷🇴 Romania | 74.7 | 66.4 |
| 🇷🇺 Russia | 98.6 | 76.9 |
| 🇷🇼 Rwanda | 12.9 | 8.4 |
| 🇰🇳 Saint Kitts & Nevis | 108.5 | 69.7 |
| 🇱🇨 Saint Lucia | 111.9 | 78.3 |
| 🇻🇨 Saint Vincent & the Grenadines | 113.8 | 94.4 |
| 🇼🇸 Samoa | 135.9 | 88.3 |
| 🇸🇹 Sao Tome & Principe | 51.3 | 23.6 |
| 🇸🇦 Saudi Arabia | 66.8 | 55.0 |
| 🇸🇳 Senegal | 29.1 | 17.2 |
| 🇷🇸 Serbia | 68.3 | 61.6 |
| 🇸🇨 Seychelles | 119.2 | 62.5 |
| 🇸🇱 Sierra Leone | 35.0 | 9.5 |
| 🇸🇰 Slovakia | 72.7 | 62.5 |
| 🇸🇮 Slovenia | 85.7 | 72.5 |
| 🇸🇧 Solomon Islands | 40.5 | 12.4 |
| 🇿🇦 South Africa | 66.2 | 59.8 |
| 🇰🇷 South Korea | 133.8 | 78.5 |
| 🇸🇸 South Sudan | 23.9 | 21.0 |
| 🇪🇸 Spain | 142.7 | 101.9 |
| 🇱🇰 Sri Lanka | 40.8 | 11.8 |
| 🇸🇩 Sudan | 21.5 | 20.3 |
| 🇸🇷 Suriname | 78.8 | 62.3 |
| 🇸🇪 Sweden | 100.2 | 68.0 |
| 🇨🇭 Switzerland | 82.2 | 66.2 |
| 🇸🇾 Syria | 18.0 | 15.8 |
| 🇹🇼 Taiwan | 116.7 | 87.0 |
| 🇹🇯 Tajikistan | 37.9 | 37.2 |
| 🇹🇿 Tanzania | 17.6 | 11.2 |
| 🇹🇭 Thailand | 54.9 | 25.8 |
| 🇹🇱 Timor-Leste | 29.3 | 22.9 |
| 🇹🇬 Togo | 24.2 | 12.5 |
| 🇹🇹 Trinidad & Tobago | 99.5 | 75.9 |
| 🇹🇳 Tunisia | 41.4 | 27.3 |
| 🇹🇷 Türkiye | 42.8 | 37.3 |
| 🇹🇲 Turkmenistan | 52.2 | 49.4 |
| 🇺🇸 U.S. | 151.4 | 128.6 |
| 🇦🇪 UAE | 73.6 | 48.2 |
| 🇺🇬 Uganda | 23.3 | 9.0 |
| 🇬🇧 UK | 97.0 | 79.1 |
| 🇺🇦 Ukraine | 63.3 | 49.5 |
| 🇺🇾 Uruguay | 67.3 | 58.1 |
| 🇺🇿 Uzbekistan | 45.0 | 41.0 |
| 🇻🇺 Vanuatu | 63.5 | 34.5 |
| 🇻🇪 Venezuela | 43.1 | 32.9 |
| 🇻🇳 Vietnam | 100.2 | 60.6 |
| 🇾🇪 Yemen | 21.7 | 18.7 |
| 🇿🇲 Zambia | 29.3 | 16.2 |
| 🇿🇼 Zimbabwe | 54.9 | 51.9 |
Hong Kong remains at the top, but the U.S. jumps up three spots to second place, with annual per capita meat consumption at 128 kg (282 lbs) when seafood isn’t included.
Iceland and Macao drop to the top 15, while Australia, Mongolia, and Argentina climb into the top five. Other countries that preferred seafood dropped a lot lower, such as Japan, which fell 40 spots in the total consumption rankings when fish was removed.
-

 VC+3 weeks ago
What are Top Investment Managers Holding in Their Portfolios?
-

 Markets1 week ago
The 50 Best One-Year Returns on the S&P 500 (1980-2022)
-

 United States3 weeks ago
Chart: U.S. Home Price Growth Over 50 Years
-

 United States1 week ago
Mapped: The Most Dangerous Cities in the U.S.
-

 Energy3 weeks ago
How Old Are the World’s Nuclear Reactors?
-

 Countries7 days ago
Mapped: World’s Top 40 Largest Military Budgets
-

 Energy3 weeks ago
How Big is the Market for Crude Oil?
-

 Crime6 days ago
Mapped: The Safest Cities in the U.S.