Green
Visualizing Mismanaged Plastic Waste by Country


Visualizing Mismanaged Plastic Waste by Country
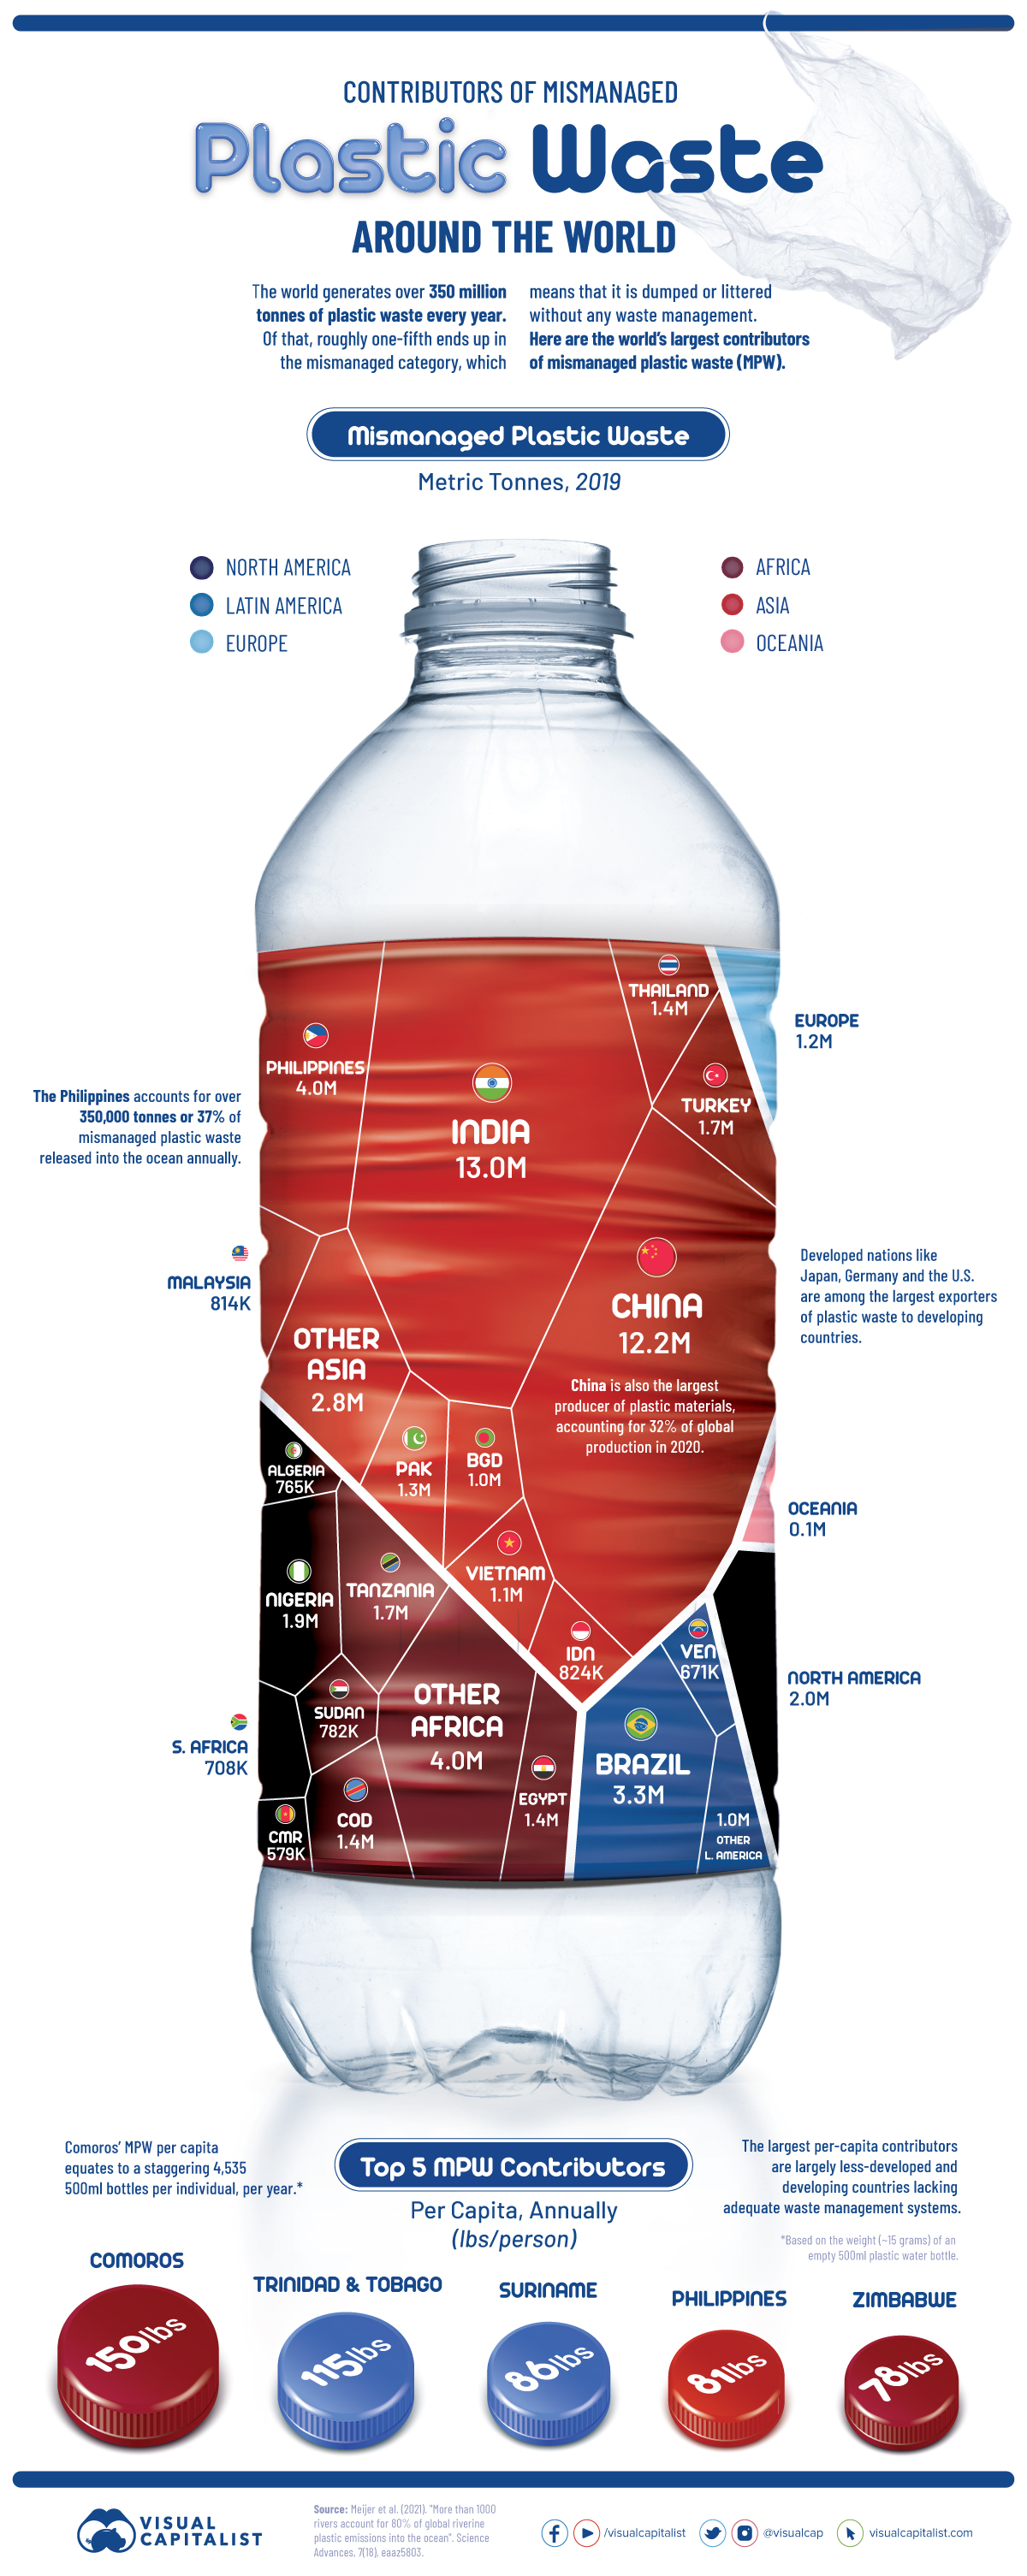
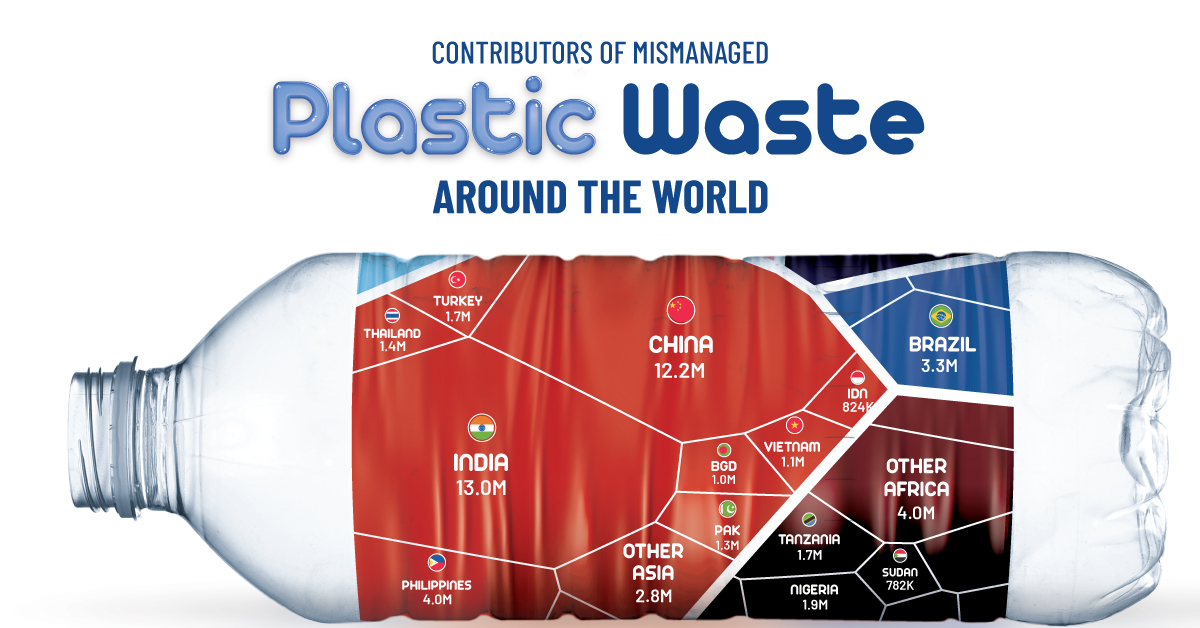
Plastic is one of the most useful materials around, but its proliferating use has created a ballooning heap of plastic waste, with more than 350 million tonnes generated each year.
Only a fraction of plastic waste is recycled, and about one-fifth ends up in the mismanaged category, meaning that it is dumped or littered without proper waste management practices. Mismanaged plastic waste threatens the land and marine environments, and most of it doesn’t decompose, polluting the environment for hundreds of years.
The above infographic visualizes the largest contributors of mismanaged plastic waste in 2019, based on data from a study by Meijer et al. published in the Science Advances journal.
The Largest Contributors of Mismanaged Plastic Waste
Asian countries account for the majority of global mismanaged plastic waste (MPW), and many of the top plastic-emitting rivers are concentrated in the region.
India and China are the only countries to account for over 10 million tonnes of MPW, although that could partly be driven by their sheer population numbers.
| Country/Region | MPW created in 2019 (tonnes) | % of total |
|---|---|---|
| India 🇮🇳 | 12,994,100 | 21% |
| China 🇨🇳 | 12,272,200 | 20% |
| Philippines 🇵🇭 | 4,025,300 | 7% |
| Brazil 🇧🇷 | 3,296,700 | 5% |
| Nigeria 🇳🇬 | 1,948,950 | 3% |
| North America 🌎 | 1,927,484 | 3% |
| Tanzania 🇹🇿 | 1,716,400 | 3% |
| Turkey 🇹🇷 | 1,656,110 | 3% |
| Egypt 🇪🇬 | 1,435,510 | 2% |
| DR Congo 🇨🇩 | 1,369,730 | 2% |
| Thailand 🇹🇭 | 1,361,690 | 2% |
| Pakistan 🇵🇰 | 1,346,460 | 2% |
| Europe 🌍 | 1,179,881 | 2% |
| Vietnam 🇻🇳 | 1,112,790 | 2% |
| Bangladesh 🇧🇩 | 1,021,990 | 2% |
| Indonesia 🇮🇩 | 824,234 | 1% |
| Malaysia 🇲🇾 | 814,454 | 1% |
| Sudan 🇸🇩 | 781,625 | 1% |
| Algeria 🇩🇿 | 764,578 | 1% |
| South Africa 🇿🇦 | 708,467 | 1% |
| Venezuela 🇻🇪 | 671,431 | 1% |
| Cameroon 🇨🇲 | 578,798 | 1% |
| Oceania 🌎 | 136,506 | 0.2% |
| Other 🗺 | 7,828,312 | 13% |
| Total | 61,773,700 | 100% |
Generally, the top countries in the above table are developing economies that tend to have inadequate waste management infrastructure.
The Philippines is the third-largest contributor and accounts for 37% of all MPW released into the ocean at over 350,000 tonnes per year. Solid waste management remains a major environmental issue in the Philippines. The country recently closed down 335 illegal dumpsites to encourage the use of sanitary landfills and proper waste segregation.
The three continents of North America, Europe, and Oceania together account for just 5% of global mismanaged plastic waste. However, it’s important to note that these figures do not reflect the amount of waste that is exported overseas, and many rich nations are known to export some portions of their waste to poorer nations.
The State of Plastic Waste Trade
In 2019, the Philippines famously shipped back 69 containers of dumped garbage back to Canada, joining other nations in rejecting waste from rich countries.
Until 2017, China was the largest importer of overseas plastic waste, accounting for roughly 50% of global plastic waste imports. Then, it imposed an import ban on almost all types of plastic waste, resulting in a decline in the overall global plastic scrap trade.
In 2021, global plastic waste imports were just over one-third of 2017 levels. However, countries including Malaysia, Indonesia, and Vietnam have been importing more plastic waste since China’s ban, slightly offsetting the impact.
Mismanaged Plastic Waste Per Capita
On a per capita basis, the archipelago of Comoros in East Africa tops the list. Its per capita MPW is equivalent to over 4,500 empty 500ml plastic bottles per person, per year.
| Country | MPW per capita | GDP per capita (2021, current US$) |
|---|---|---|
| Comoros 🇰🇲 | 150lbs (68kg) | $1,495 |
| Trinidad and Tobago 🇹🇹 | 115lbs (52kg) | $15,243 |
| Suriname 🇸🇷 | 86lbs (39kg) | $4,836 |
| Philippines 🇵🇭 | 81lbs (37kg) | $3,549 |
| Zimbabwe 🇿🇼 | 78lbs (35kg) | $1,737 |
While there isn’t much information available on waste management in Comoros, it is one of the world’s least-developed nations. In fact, household consumption accounts for almost 100% of its annual gross domestic product.
Trinidad and Tobago is an outlier due to its high-income status, but a lack of waste segregation among households, alongside inefficient waste management systems, contributes to its high per capita figure.
The Impact of Plastic Waste
Plastic waste has various negative implications for the environment, especially as it can take hundreds of years to decompose.
Millions of tonnes of plastic waste flows into the oceans every year, accounting for at least 85% of all marine garbage. This poses a major threat to aquatic life because fish and other organisms can get entangled in plastic waste and ingest plastics.
On land, plastic waste threatens the quality of the soil and its surrounding ecosystem. Additionally, burning plastic waste releases toxic particles that have a detrimental impact on air quality.
If current trends continue, over 12 billion tonnes of plastic waste is expected to end up in landfills by 2050. Although recycling rates are expected to improve, increasing the availability of adequate waste management systems will be important in preventing plastic waste from entering the environment.


Environment
3 Ways the Shipping Industry is Addressing Climate Change
The shipping industry is responsible for 2.89% of all carbon emissions. Here are three ways it could evolve to address climate change.


3 Ways the Shipping Industry is Addressing Climate Change
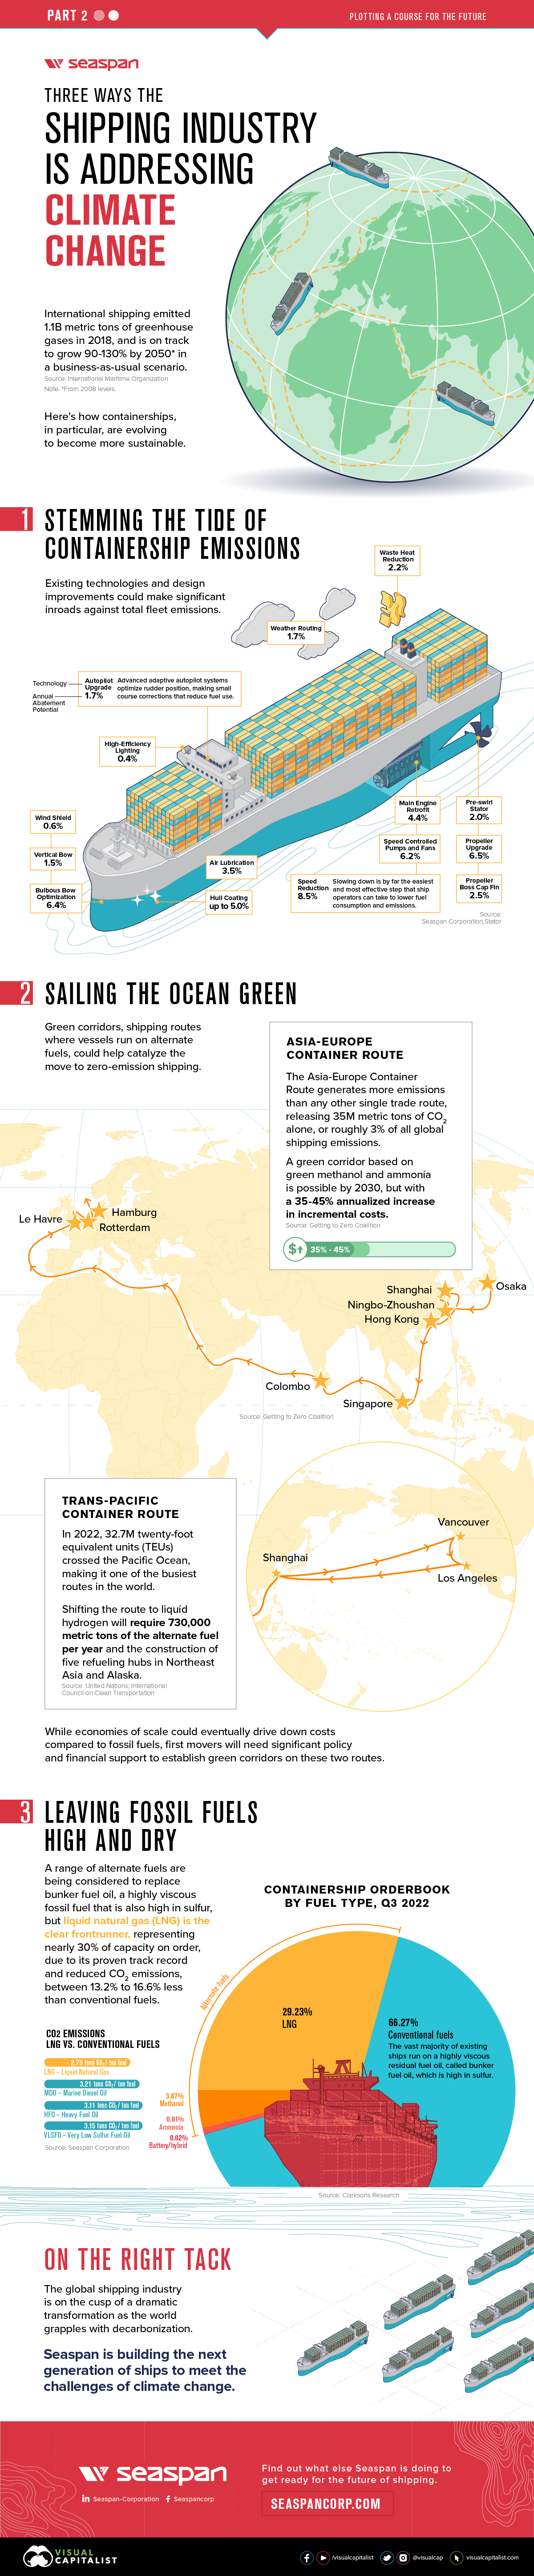
The global shipping industry is on the verge of a transformation not seen since the transition from sail to steam.
In 2018, the industry emitted 1.1 billion metric tons of greenhouse gas emissions, representing 2.89% of all anthropogenic, or human-caused, emissions. And according to the International Maritime Organization (IMO) that could increase 90-130% in 2050, from a 2008 baseline.
This is the second and final part of The Shipping Industry: Plotting a Course for the Future, a two-part series from our sponsor Seaspan Corporation, that looks at three ways that containerships in particular, could evolve to become more sustainable.
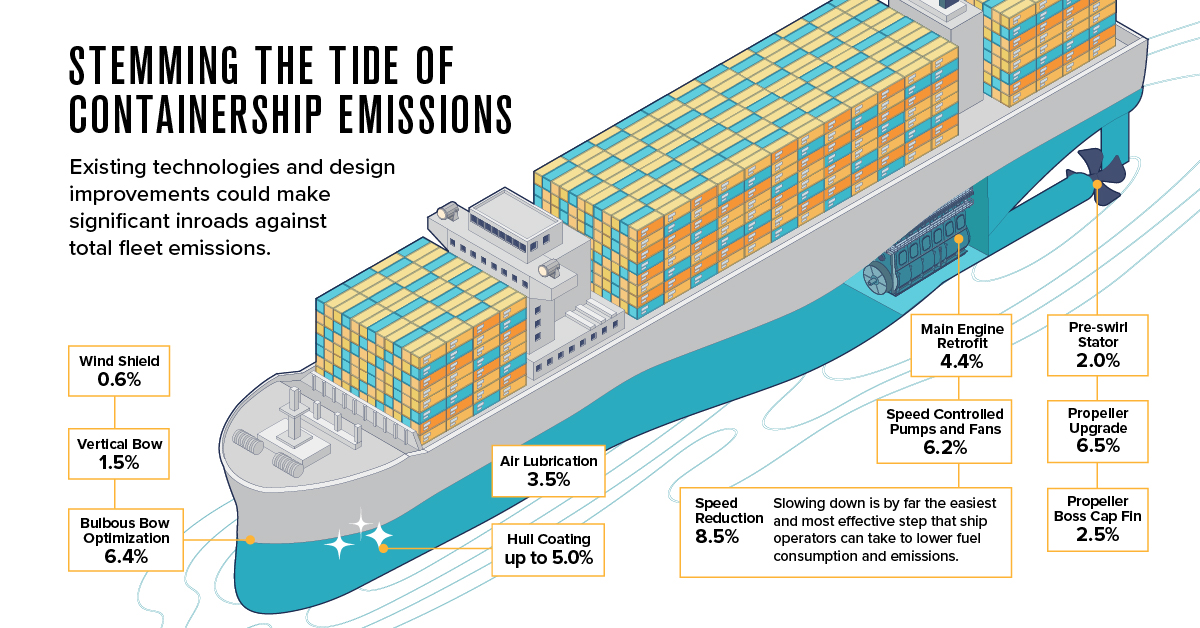
1. Stemming the Tide of Containership Emissions
Unlike personal transport, which has a proven and commercially scalable technology in electric vehicles, there’s no silver bullet for shipping. However, existing technologies and design improvements could help make significant inroads against total fleet emissions.
According to data from Seaspan, propeller upgrades (6.5%), hull coatings (up to 5.0%), and main engine retrofits (4.4%) won’t bring emissions to zero on their own, but taken together they add up to big savings.
| Technology | Annual Abatement potential |
|---|---|
| Speed reduction | 8.5% |
| Propeller Upgrade | 6.5% |
| Bulbous bow optimization | 6.4% |
| Speed Controlled Pumps and Fans | 6.2% |
| Hull coating | 5.0% (up to) |
| Main engine retrofit | 4.4% |
| Air lubrication | 3.5% |
| Propeller boss cap fin | 2.5% |
| Waste Heat Reduction | 2.2% |
| Pre-swirl stator | 2.0% |
| Weather Routing | 1.7% |
| Autopilot Upgrade | 1.7% |
| Vertical bow | 1.5% |
| Wind shield | 0.6% |
| High-Efficiency Lighting | 0.4% |
Interestingly, the biggest potential impact could come from slowing down ships (8.5%), which lowers fuel consumption and as a consequence, emissions. In the race to net zero, slow and steady could very well win the race.
2. Sailing the Ocean Green
In the long run, though, design tweaks don’t address the elephant seal in the room, which is the industry’s reliance on fossil fuels. Ships that run on alternate fuels, like ammonia, methanol, and even wind-power, are all in development, but many of the technologies are still in the early stages.
To help spur development, a group of countries at COP26, the annual UN climate conference, committed to establishing green shipping corridors where vessels would run on alternate fuels. A total of 24 countries signed the Clydebank Declaration, including the U.S. and the UK, and together they hope to catalyze the shift to zero emission shipping.
3. Leaving Fossil Fuels High and Dry
Many ship owners and operators are looking at Liquid Natural Gas (LNG) as a transitional fuel, while alternate fuel technologies mature. LNG emits between 13.2% and 16.6% less CO2 than conventional bunker fuel oil, a highly viscous residual fuel that is high in sulfur, so it’s no surprise that LNG-powered containerships represent 29.23% of the existing orderbook.
But with all but 2.4% of the current global fleet running on fossil fuels, there is still a long journey ahead.
On the Right Tack
The 1997 Kyoto Protocol established the IMO as the forum for climate change action for the shipping industry, which many have criticized for not moving fast and far enough on climate change.
At the July 2023 meeting of the Marine Environment Protection Committee, the IMO adopted a new greenhouse gas strategy, which set “indicative checkpoints” for emission reductions for 2030 and 2040 in place of binding targets, and committed to hit net zero “by or around, i.e. close to 2050, taking into account different national circumstances.” The IMO also declined to put a price on carbon.
Even without firm targets, many industry players aren’t waiting to move on the climate emergency. Seaspan, the world’s largest independent charter owner and manager of containerships, is moving to green their fleet. They recently signed an agreement to retrofit 15 ships with dual-fuel engines that can also run on green methanol, with an option for 45 more.
Find out what else Seaspan is doing to get ready for the future of shipping.

-

 Environment4 weeks ago
Life Cycle Emissions: EVs vs. Combustion Engine Vehicles
We look at carbon emissions of electric, hybrid, and combustion engine vehicles through an analysis of their life cycle emissions.
-

 Green3 months ago
Mapped: Air Pollution Levels Around the World in 2022
Exploring 2022 average air pollution levels around the world by PM2.5 concentration.
-

 Environment10 months ago
Mapped: Countries With the Highest Flood Risk
Recent floods in Pakistan have affected more than 33 million people. Where is the risk of flooding highest around the world?
-

 Space11 months ago
All the Contents of the Universe, in One Graphic
We explore the ultimate frontier: the composition of the entire known universe, some of which are still being investigated today.
-

 Green11 months ago
Explained: The Relationship Between Climate Change and Wildfires
More carbon in the atmosphere is creating a hotter world—and gradually fueling both climate change and instances of wildfires.
-
 Environment12 months ago
5 Things to Know About Europe’s Scorching Heatwave
Smoldering temperatures are wreaking havoc across Europe. Here are 5 key things you should know about Europe’s current heatwave.


-

 Markets4 weeks ago
The World’s Biggest Mutual Fund and ETF Providers
-

 Brands2 weeks ago
Brand Reputations: Ranking the Best and Worst in 2023
-

 Environment5 days ago
Hotter Than Ever: 2023 Sets New Global Temperature Records
-

 Datastream4 weeks ago
Can You Calculate Your Daily Carbon Footprint?
-

 Energy2 weeks ago
Who’s Still Buying Russian Fossil Fuels in 2023?
-

 VC+4 days ago
What’s New on VC+ in July
-

 Investor Education4 weeks ago
Visualizing BlackRock’s Top Equity Holdings
-

 apps2 weeks ago
Meet the Competing Apps Battling for Twitter’s Market Share