Energy
Ranked: The 50 Companies That Use the Highest Percentage of Green Energy
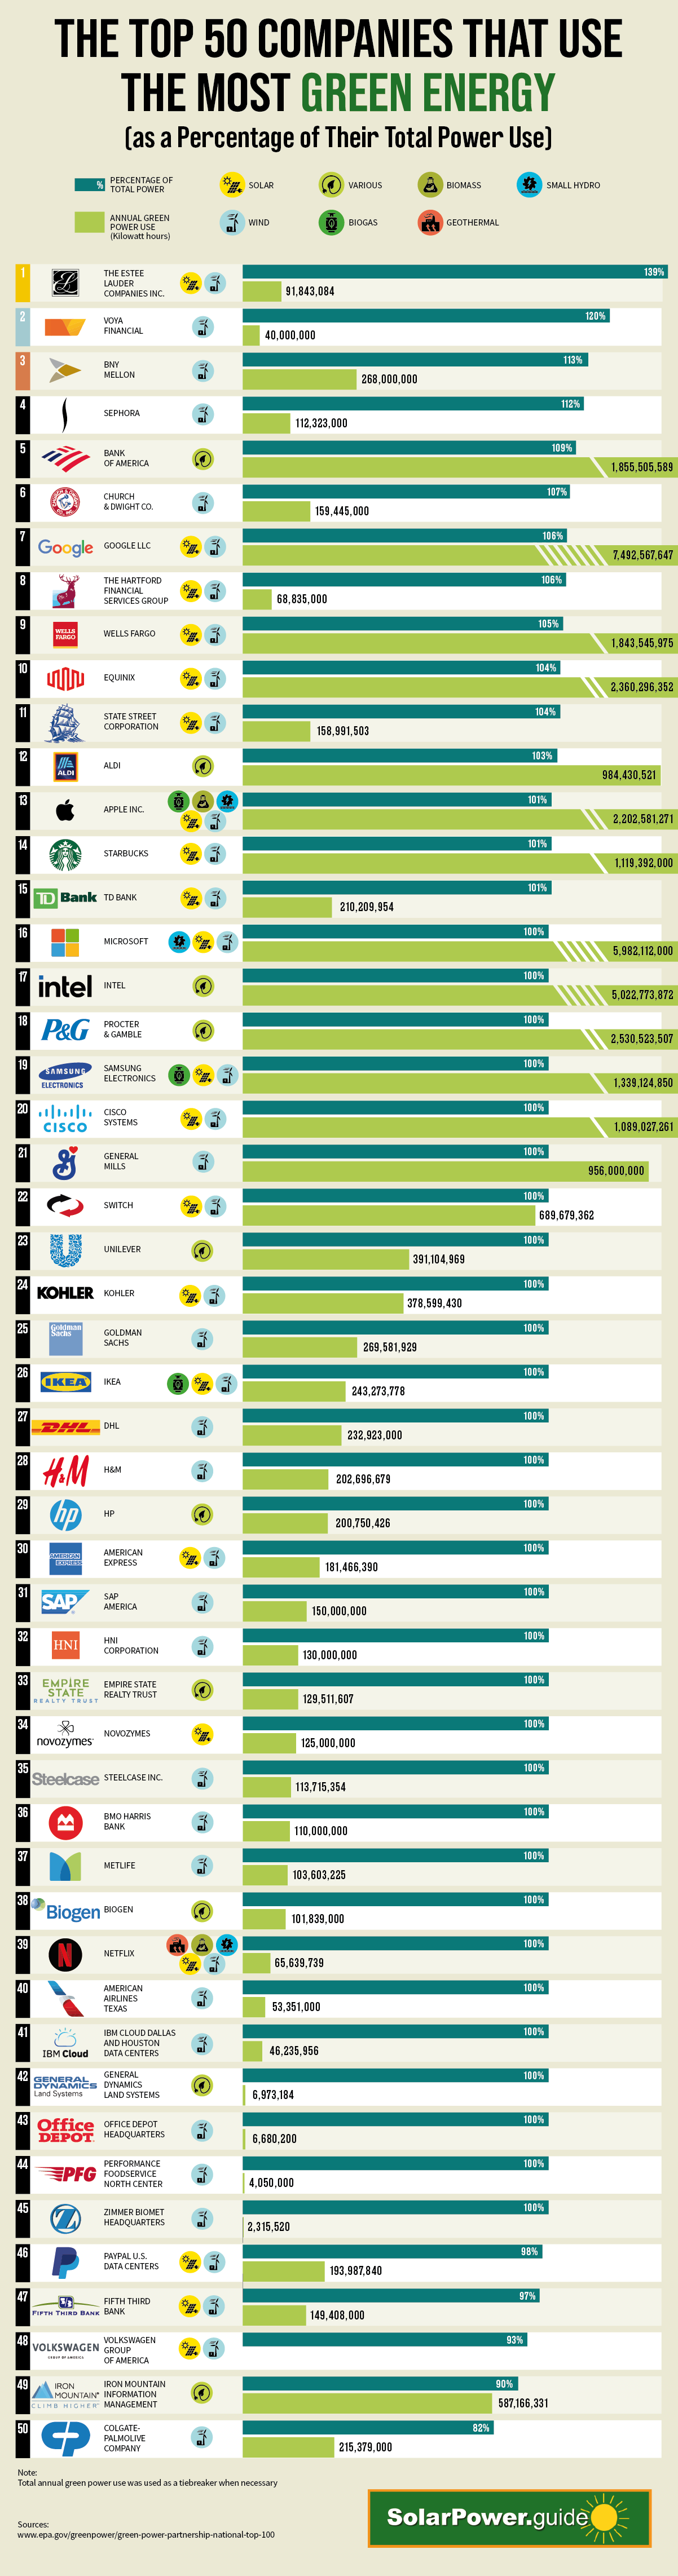
Which Companies Use the Most Green Energy?
Green energy was once a niche segment of the wider energy industry, but it’s quickly becoming an essential energy source in many regions and nations across the globe.
Based on data from the Environmental Protection Agency (EPA), this infographic by SolarPower.Guide shows the top 50 greenest companies, based on the highest proportion of green energy used in their overall consumption mix.
Leaders in Green Energy Use
As green energy becomes more affordable, some major businesses like Google, Wells Fargo, and Apple are embracing it in a big way.
It also helps that institutional investors are nudging companies in that direction anyways, especially as they become more focused on incorporating environment, social and governance (ESG) into their portfolios.
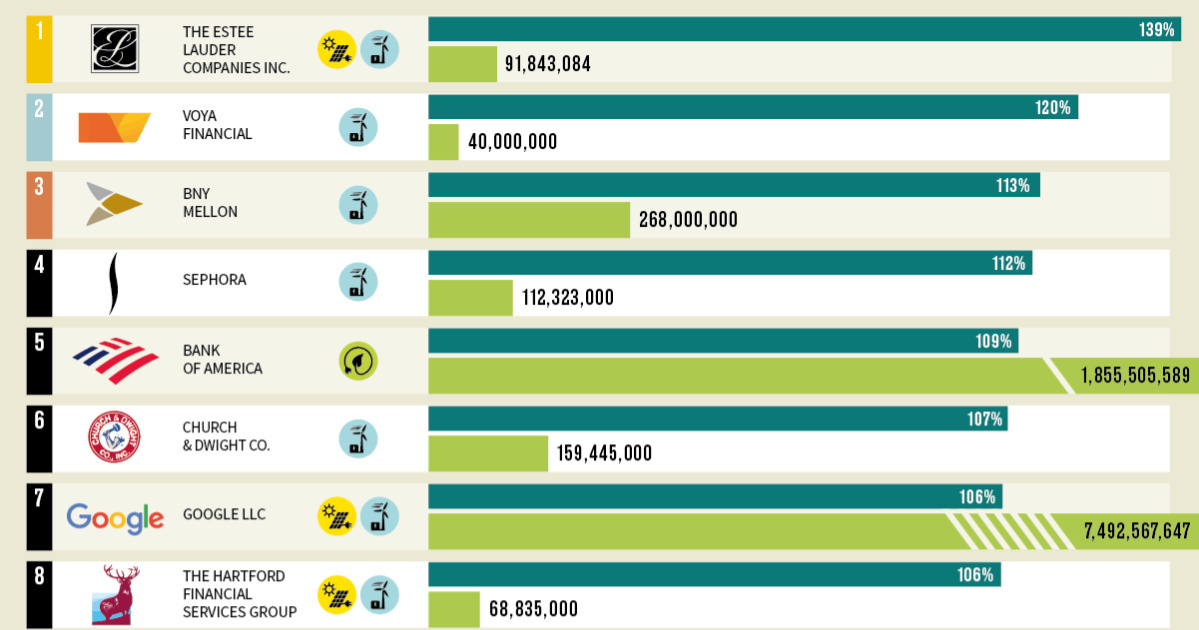
Here are the top 15 U.S. companies that use the highest percentage of green energy:
| Rank | Company | Green Power use | Annual Green Power Use (kWh) |
|---|---|---|---|
| #1 | The Estee Lauder Companies Inc. | 139% | 91,843,084 |
| #2 | Voya Financial | 120% | 40,000,000 |
| #3 | BNY Mellon | 113% | 268,000,000 |
| #4 | Sephora | 112% | 112,323,000 |
| #5 | Bank of America | 109% | 1,855,505,589 |
| #6 | Church & Dwight Co. | 107% | 159,445,000 |
| #7 | Google LLC | 106% | 7,492,567,647 |
| #8 | The Hartford Financial Services Group | 106% | 68,835,000 |
| #9 | Wells Fargo | 105% | 1,843,545,975 |
| #10 | Equinix | 104% | 2,360,296,352 |
| #11 | State Street Corp. | 104% | 158,991,503 |
| #12 | Aldi | 103% | 984,430,521 |
| #13 | Apple Inc. | 101% | 2,202,581,271 |
| #14 | Starbucks | 101% | 1,119,392,000 |
| #15 | TD Bank | 101% | 210,209,954 |
Note: The values reflect the amount of green power as a percentage of a company’s total electricity use. Companies that purchase green power exceeding their total organization-wide electricity use will show a value greater than 100%.
Green Energy vs. Renewable Energy
The term “green energy” is often met with confusion by some and is sometimes just referred to as “renewables” by others. So, what is green energy, and how is it different from other sources of renewable energy?
Green energy is a subset of renewable energy and represents those energy sources and technologies that provide the highest environmental benefit. The EPA defines green power as electricity produced from solar, wind, geothermal, biogas, eligible biomass, and low-impact small hydroelectric sources.
Other renewable types of energy exist, but may not be considered fully green, at least as the EPA defines it. For example, while massive hydro projects provide a renewable source of energy, they can also have big impact on the environment. Same goes for non-eligible biomass—a category which includes biomass that may not be close to carbon-neutral.
Climate Commitments
In addition to the use of green power for operations, major companies are also looking at the bigger picture and setting targets to achieve carbon neutrality.
Here are a few of the major companies that have made climate commitments in the near future:
| Company | Commitment | By Year |
|---|---|---|
| Apple | Net Zero Carbon Emission | 2030 |
| Ikea | Climate Positive | 2030 |
| Burger King | Net Zero Operations | 2030 |
| Microsoft | Net Zero Carbon Emission | 2030 |
| BBC | Net Zero Carbon Emission | 2030 |
| Net Zero Value Chain | 2030 | |
| Verizon | Net Zero Carbon Emission | 2035 |
| Unilever | Net Zero Carbon Emission | 2039 |
| Pepsi Co. | Net Zero Carbon Emission | 2040 |
| BP | Net Zero Carbon Emission | 2050 |
This will undoubtedly impact their overall consumption and the energy mix in the years to come.


Batteries
Visualized: The Rise of the LFP Battery
In 2022, the EV sector’s market share of the LFP battery rose from just 6% in 2020 to 30%, highlighting its growing popularity.


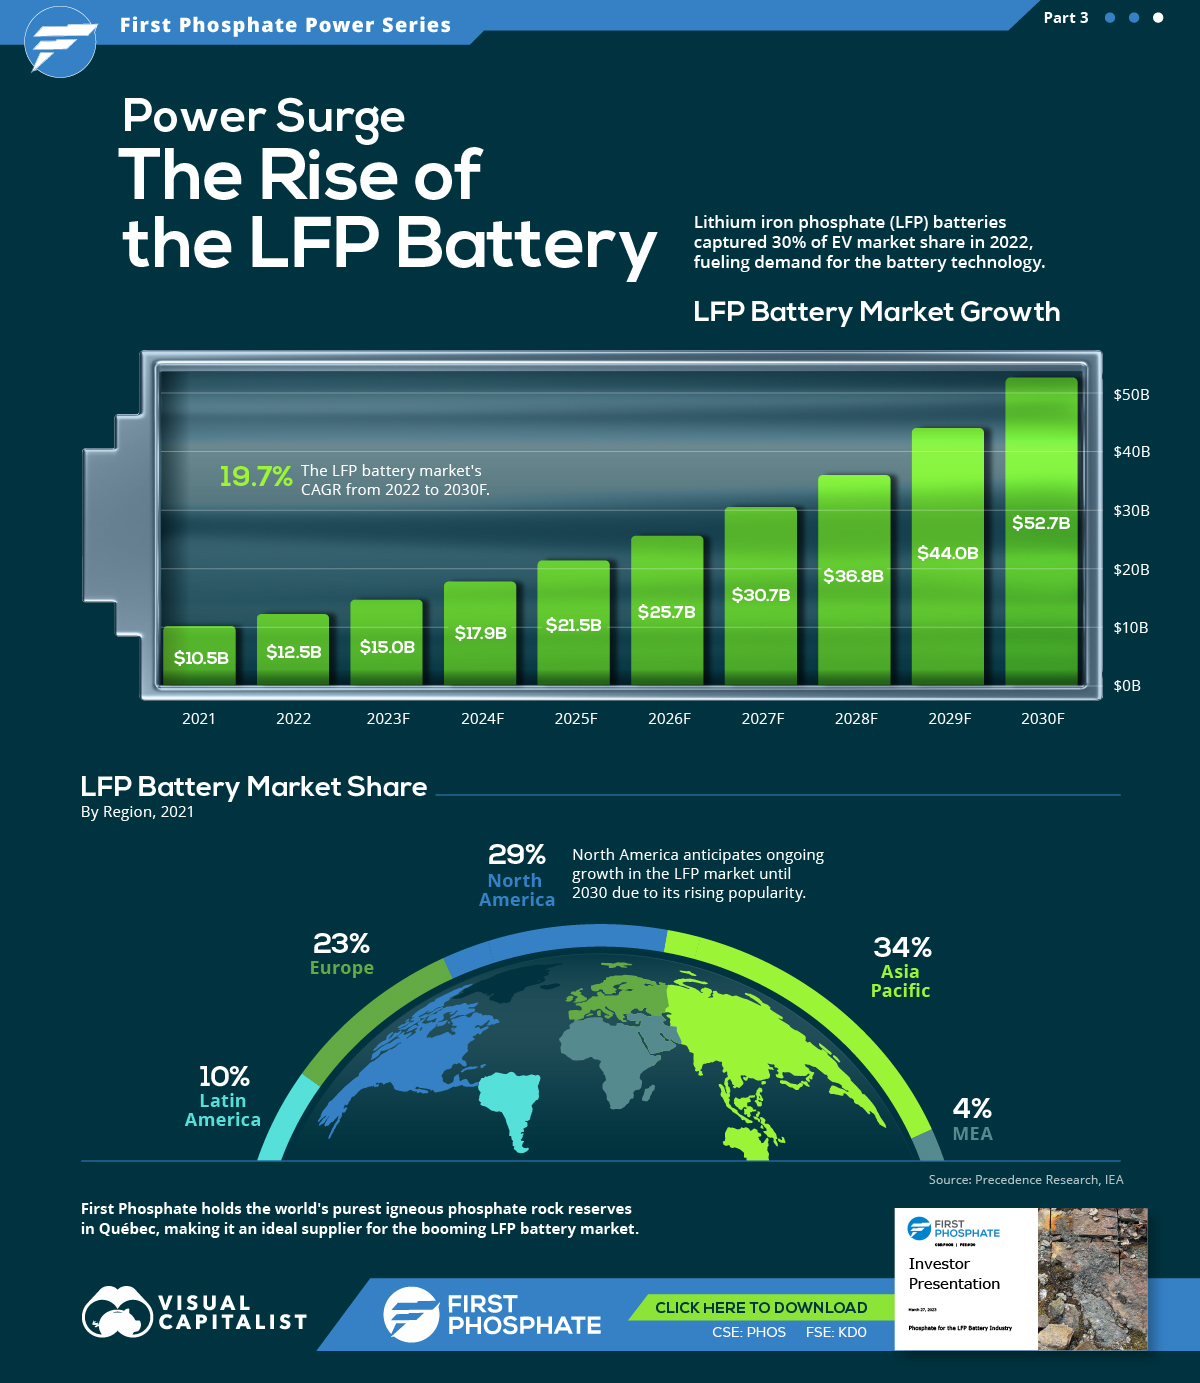
The Rise of the LFP Battery
Primarily a key component in fertilizers, phosphate is also essential to lithium iron phosphate (LFP) battery technology.
LFP is an emerging favorite in the expanding EV market, particularly in standard-range EVs. Factors driving this popularity include superior safety, longevity, cost-effectiveness, and environmental sustainability.
In this graphic, our sponsor First Phosphate looks at the growing LFP market, highlighting forecasted growth and current market share.
Market Growth
In 2022, the global LFP battery market stood at $12.5 billion. By 2030, this figure is expected to catapult to nearly $52.7 billion, signifying a CAGR of 19.7%.
| Year | USD (Billion) |
|---|---|
| 2021 | $10.5B |
| 2022 | $12.5B |
| 2023F | $15.0B |
| 2024F | $17.9B |
| 2025F | $21.5B |
| 2026F | $25.7B |
| 2027F | $30.7B |
| 2028F | $36.8B |
| 2029F | $44.0B |
| 2030F | $52.7B |
In 2022, LFP batteries cornered a sizable 30% of the EV market share from just 6% in 2020, demonstrating the growing appeal of this type of lithium-ion battery in the electric vehicle sector.
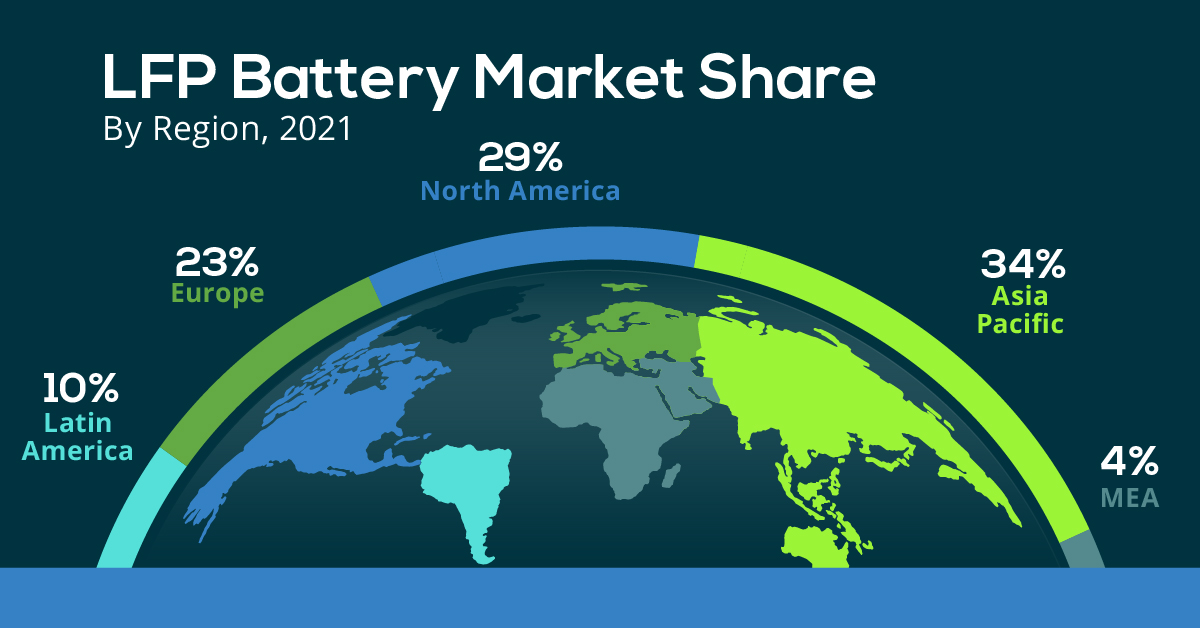
Market Share
The Asia Pacific region dominated the LFP battery market in 2021, accounting for over 34% of the global share.
| Regions | Revenue Share (%) |
|---|---|
| Asia Pacific | 34% |
| North America | 29% |
| Europe | 23% |
| Latin America | 10% |
| MEA | 4% |
Meanwhile, North America, with the second largest share, is projected to witness ongoing growth through 2030.
First Phosphate holds access to 1% of the world’s purest igneous rock phosphate reserves in Québec, making it an ideal supplier for the growing LFP market.

-

 Maps2 months ago
Mapped: Renewable Energy and Battery Installations in the U.S. in 2023
This graphic describes new U.S. renewable energy installations by state along with nameplate capacity, planned to come online in 2023.
-

 Energy2 months ago
How EV Adoption Will Impact Oil Consumption (2015-2025P)
How much oil is saved by adding electric vehicles into the mix? We look at data from 2015 to 2025P for different types of EVs.
-
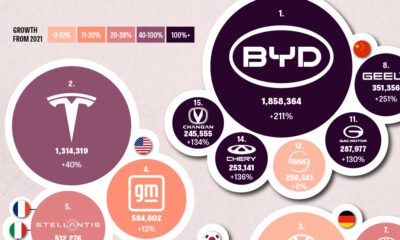
 Batteries3 months ago
Global EV Production: BYD Surpasses Tesla
This graphic explores the latest EV production data for 2022, which shows BYD taking a massive step forward to surpass Tesla.
-

 Batteries6 months ago
Visualizing China’s Dominance in Battery Manufacturing (2022-2027P)
This infographic breaks down battery manufacturing capacity by country in 2022 and 2027.
-

 Energy7 months ago
Visualizing 25 Years of Lithium Production, by Country
Lithium production has grown exponentially over the last few decades. Which countries produce the most lithium, and how how has this mix evolved?
-
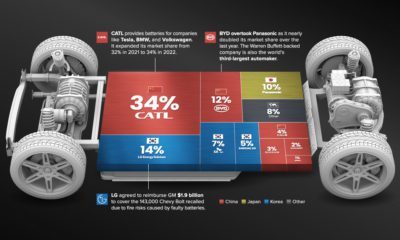
 Energy10 months ago
The Top 10 EV Battery Manufacturers in 2022
Despite efforts from the U.S. and Europe to increase the domestic production of batteries, the market is still dominated by Asian suppliers.
-

 Environment4 weeks ago
Life Cycle Emissions: EVs vs. Combustion Engine Vehicles
-

 Maps2 weeks ago
Vintage Viz: The World’s Rivers and Lakes, Organized Neatly
-

 Finance3 weeks ago
Visualized: The 100 Largest U.S. Banks by Consolidated Assets
-

 Automation1 week ago
Charted: Changing Sentiments Towards AI in the Workplace
-

 Markets3 weeks ago
What are Top Investment Managers Holding in Their Portfolios?
-

 Markets1 week ago
The 50 Best One-Year Returns on the S&P 500 (1980-2022)
-

 Markets3 weeks ago
Chart: U.S. Home Price Growth Over 50 Years
-

 Maps1 week ago
Mapped: The Most Dangerous Cities in the U.S.