
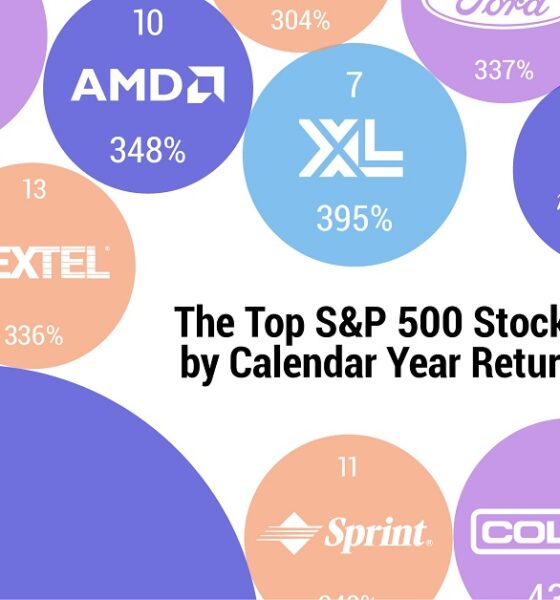
The highest one-year return among the top S&P 500 stocks from 1980 to 2022 was a staggering 2,620%. Which stocks...


In this visual we showcase the relative size of the 100 largest U.S. banks in terms of consolidated assets.
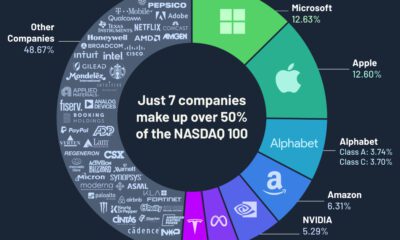

Just seven companies make up over 50% of the Nasdaq 100 by weight, and most of them are from the technology sector.


S&P 500 companies make up $34 trillion in market value combined. This graphic shows how they break down by weight and sector.


BlackRock is the world's largest asset manager, with over $9 trillion in holdings. Here are the company's top equity holdings.


In 2022, the global net assets of mutual fund and ETF providers totaled $38 trillion. This chart shows the industry's biggest brands.


This infographic visualizes 10-year annualized forecasts for both equities and fixed income using data from Vanguard.
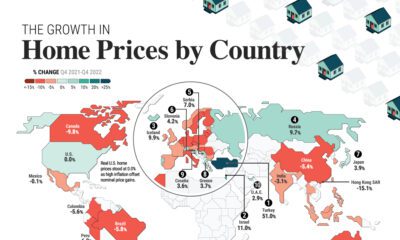

Global house prices were resilient in 2022, rising 6%. We compare nominal and real price growth by country as interest rates surged.
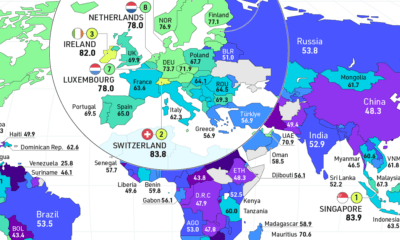

How free are people to control their own labor, property, and finances? This map reveals the state of economic freedom globally.
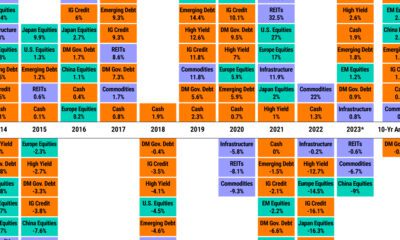

Asset classes vary widely by returns so far in 2023. Which ones are the best-performing, and is a bull market on the horizon?
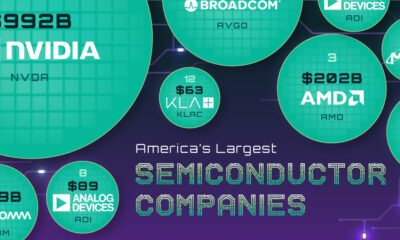

This graphic visualizes the market capitalizations of America's 15 largest semiconductor companies.


 Creator Program