Economy
Made in America: Goods Exports by State


Made in America: Goods Exports by State
After China, the U.S. is the next largest exporter of goods in the world, shipping out $1.8 trillion worth of goods in 2021—an increase of 23% over the previous year.
Of course, that massive number doesn’t tell the whole story. The U.S. economy is multifaceted, with varying levels of trade activity taking place all across the nation.
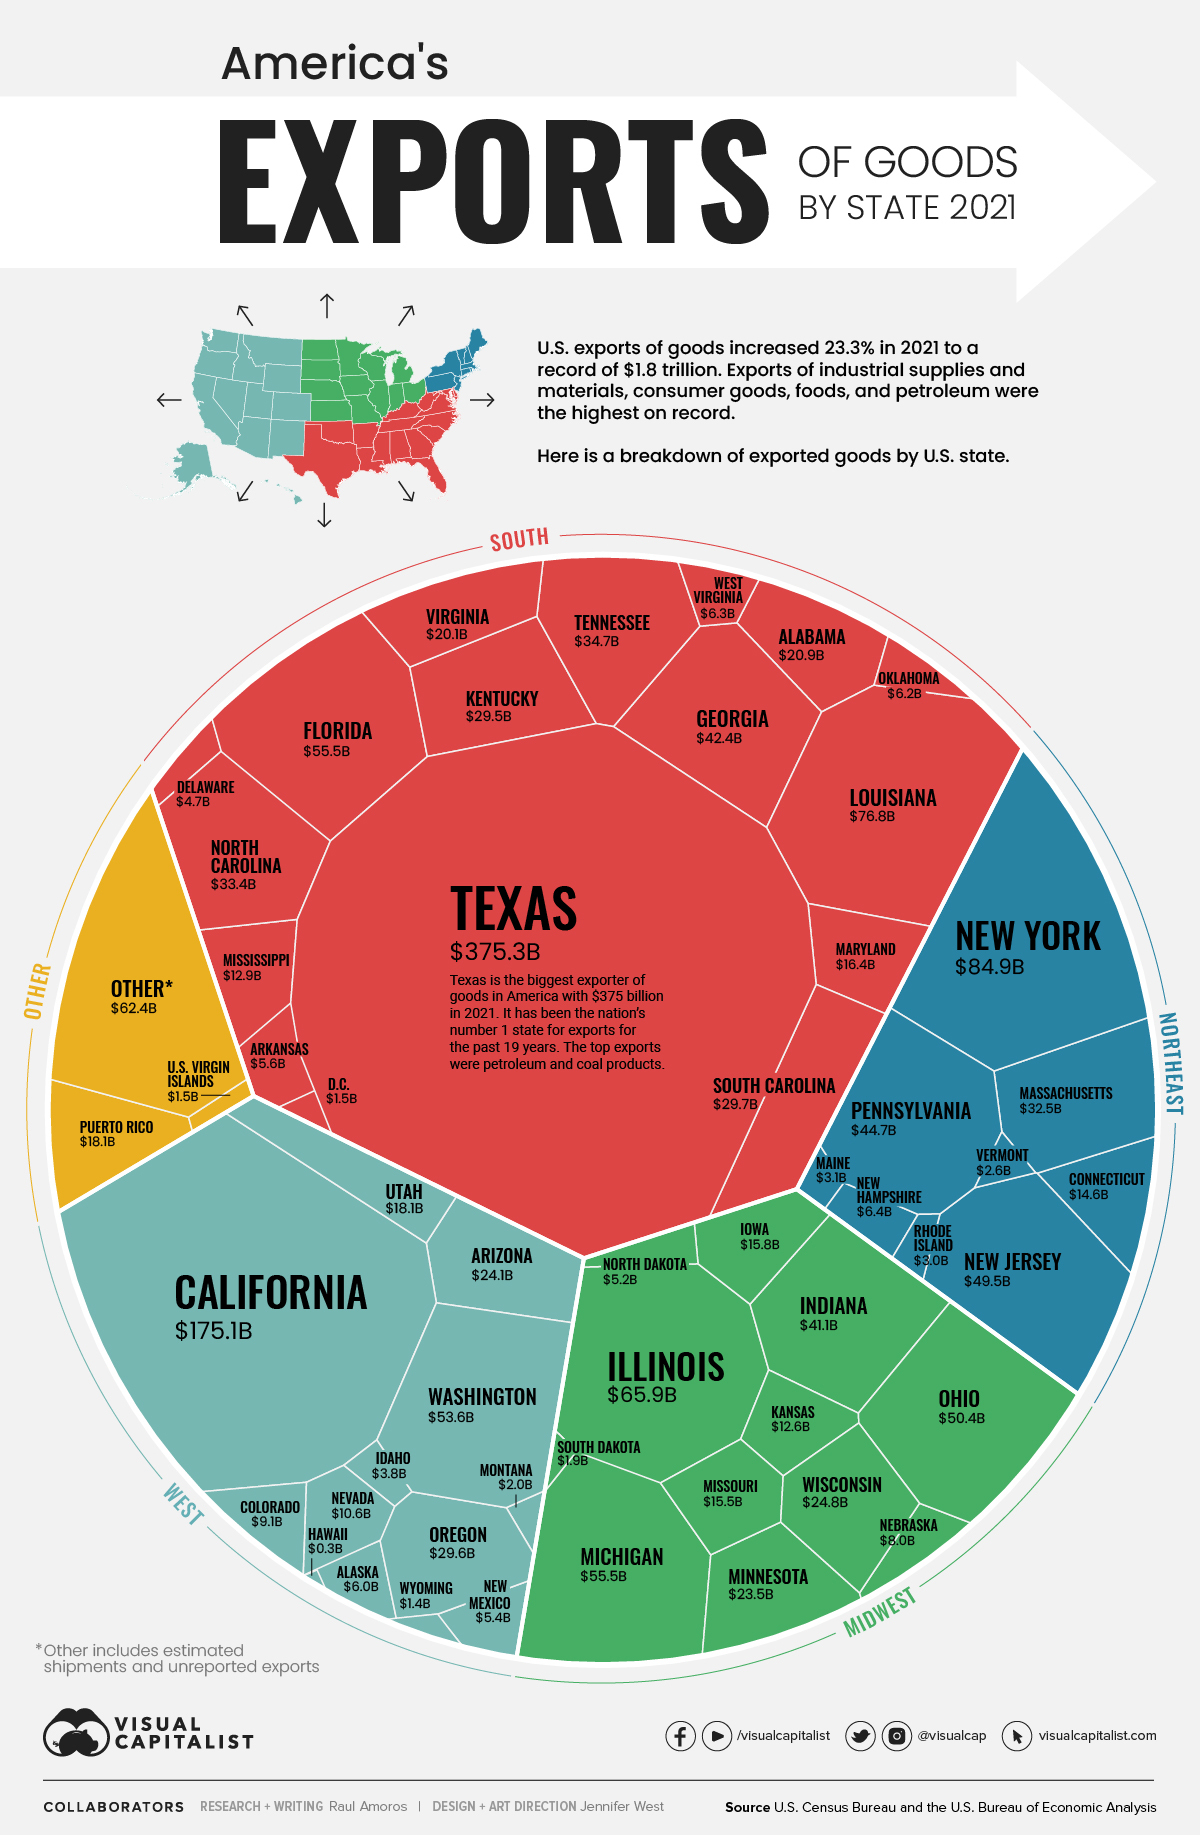
Using the latest data on international trade from the U.S. Census Bureau and the U.S. Bureau of Economic Analysis, we’ve visualized the value of America’s goods exports by state.
Top 10 Exporter States
Here are the top 10 American states that exported the highest dollar value worth of goods during 2021. Combined, these export-leading states represent 59.4% of the nation’s total exports.
| Rank | State | Total Exports Value | % share |
|---|---|---|---|
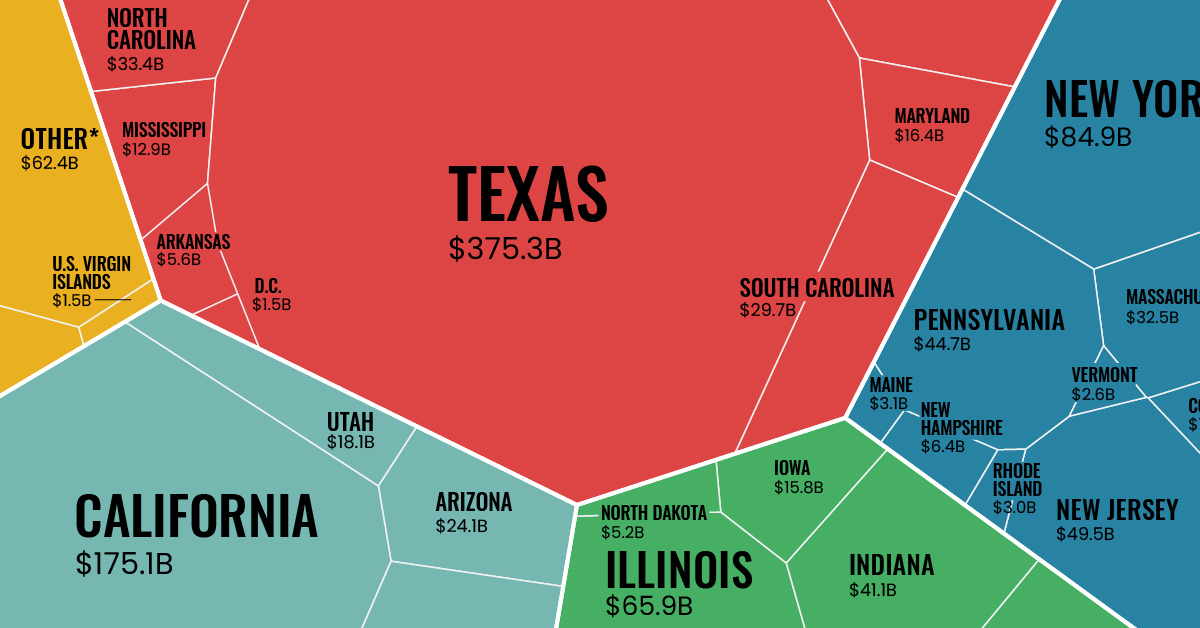
| #1 | Texas | $375.3 billion | 21.4% |
| #2 | California | $175.1 billion | 10.0% |
| #3 | New York | $84.9 billion | 4.8% |
| #4 | Louisiana | $76.8 billion | 4.4% |
| #5 | Illinois | $65.9 billion | 3.8% |
| #6 | Michigan | $55.5 billion | 3.2% |
| #7 | Florida | $55.5 billion | 3.2% |
| #8 | Washington | $53.6 billion | 3.1% |
| #9 | Ohio | $50.4 billion | 2.9% |
| #10 | New Jersey | $49.5 billion | 2.8% |
| Top 10 States | $1.04 trillion | 59.4% |
Texas has been the top exporting state in the U.S. for an incredible 20 years in a row.
Last year, Texas exported $375 billion worth of goods, which is more than California ($175 billion), New York ($85 billion), and Louisiana ($77 billion) combined. The state’s largest manufacturing export category is petroleum and coal products, but it’s also important to mention that Texas led the nation in tech exports for the ninth straight year.
California was the second highest exporter of goods in 2021 with a total value of $175 billion, an increase of 12% from the previous year. The state’s main export by value was computer and electronic product manufacturing, representing 17.8% of the total U.S. exports of that industry. California was also second among all states in exports of machinery manufacturing, accounting for 13.9% of the U.S. total.
What Type of Goods are Exported?
Here is a breakdown of the biggest U.S. export categories by value in 2021.
| Rank | Product Group | Annual Export Value (2021) | Share of Total Exports |
|---|---|---|---|
| 1 | Mineral fuels including oil | $239.8 billion | 13.7% |
| 2 | Machinery including computers | $209.3 billion | 11.9% |
| 3 | Electrical machinery, equipment | $185.4 billion | 10.6% |
| 4 | Vehicles | $122.2 billion | 7.0% |
| 5 | Optical, technical, medical apparatus | $91.7 billion | 5.2% |
| 6 | Aircraft, spacecraft | $89.1 billion | 5.1% |
| 7 | Gems, precious metals | $82.3 billion | 4.7% |
| 8 | Pharmaceuticals | $78 billion | 4.4% |
| 9 | Plastics, plastic articles | $74.3 billion | 4.2% |
| 10 | Organic chemicals | $42.9 billion | 2.4% |
These top 10 export categories alone represent almost 70% of America’s total exports.
The biggest grower among this list is mineral fuels, up by 59% from last year. Pharmaceuticals saw the second biggest one-year increase (45%).
Top 10 U.S. Exports by Country of Destination
So who is buying “Made in America” products?
Unsurprisingly, neighboring countries Canada (17.5%) and Mexico (15.8%) are the two biggest buyers of American goods. Together, they purchase one-third of American exports.
| Rank | Destination Country | Share of U.S. Goods Exports |
|---|---|---|
| 1 | 🇨🇦 Canada | 17.5% |
| 2 | 🇲🇽 Mexico | 15.8% |
| 3 | 🇨🇳 China | 8.6% |
| 4 | 🇯🇵 Japan | 4.3% |
| 5 | 🇰🇷 South Korea | 3.7% |
| 6 | 🇩🇪 Germany | 3.7% |
| 7 | 🇬🇧 United Kingdom | 3.5% |
| 8 | 🇳🇱 Netherlands | 3.1% |
| 9 | 🇧🇷 Brazil | 2.7% |
| 10 | 🇮🇳 India | 2.3% |
Three Asian countries round out the top five list: China (8.6%), Japan (4.3%), and South Korea (3.7%). Together, the top five countries account for around half of all goods exports.


Politics
How Do Chinese Citizens Feel About Other Countries?
What is the Chinese public’s view of world powers? This visual breaks down Chinese sentiment towards other countries.
Public Opinion: How Chinese Citizens Feel About Other Countries
Tensions over Taiwan, the COVID-19 pandemic, trade, and the war in Ukraine have impacted Chinese sentiment towards other countries.
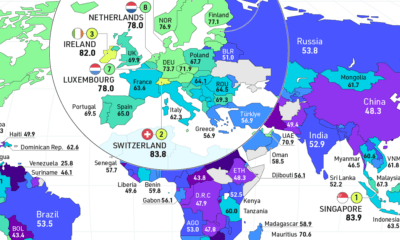
This visualization uses data from the Center for International Security and Strategy (CISS) at Tsinghua University to rank survey responses from the Chinese public on their attitudes towards countries and regions around the world.
Chinese Sentiment Towards Other Countries in 2023
In the Center’s opinion polls, which surveyed a random sample of more than 2,500 Chinese mainland adults in November 2022, Russia came out significantly ahead.
Just under 60% of respondents held Russia in a favorable view, with 19% seeing the country as “very favorable.” Contrast that to the mere 12% that viewed the U.S. in a positive light.
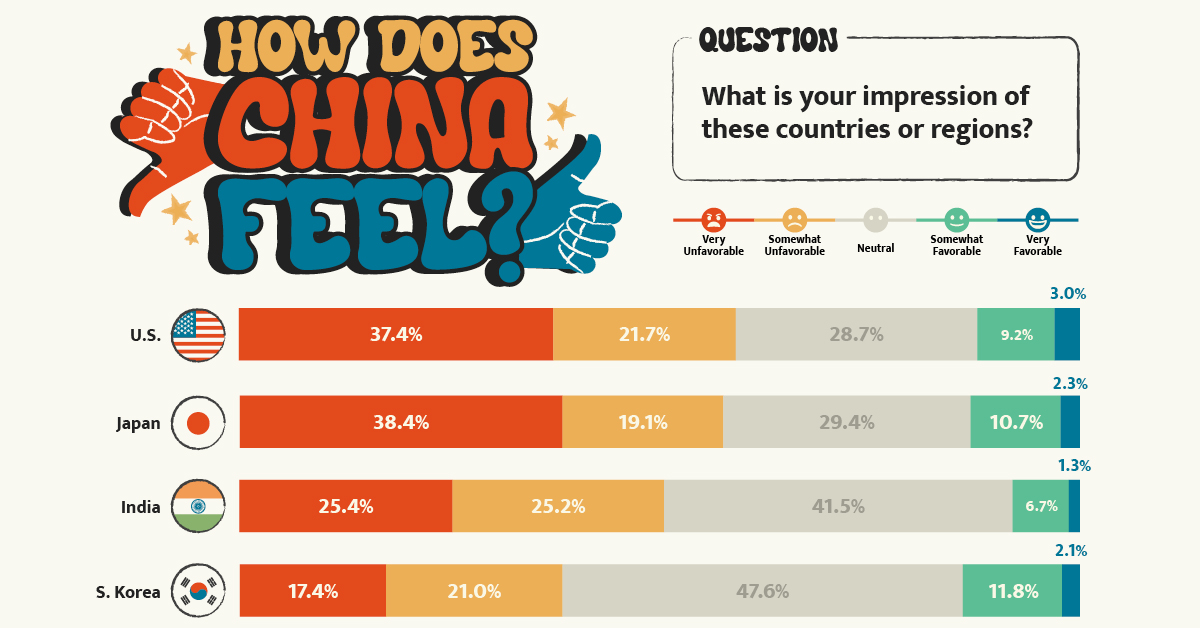
Here’s a closer look at the data. The percentages refer to the share of respondents that voted for said category.
| Country/Region | Very Unfavorable | Somewhat Unfavorable | Neutral | Somewhat Favorable | Very Favorable |
|---|---|---|---|---|---|
| 🇺🇸 United States | 37.4% | 21.7% | 28.7% | 9.2% | 3.0% |
| 🇯🇵 Japan | 38.4% | 19.1% | 29.4% | 10.7% | 2.3% |
| 🇮🇳 India | 25.4% | 25.2% | 41.5% | 6.7% | 1.3% |
| 🇰🇷 South Korea | 17.4% | 21.0% | 47.6% | 11.8% | 2.1% |
| 🇪🇺 European Union | 9.3% | 15.6% | 57.6% | 14.1% | 3.3% |
| Southeast Asia | 7.1% | 13.1% | 59.5% | 16.8% | 3.5% |
| 🇷🇺 Russia | 3.0% | 4.8% | 33.7% | 39.4% | 19.0% |
Japan ranked just below the U.S. in terms of overall unfavorability, though a slightly higher share of respondents saw Japan as “very unfavorable” compared to America. This is likely due to both modern tensions in the East China Sea over mutually claimed islands and historical tensions over the Sino-Japanese Wars.
Chinese sentiment towards India was also unfavorable at just over 50%, though notably the country also received the lowest favorability rating at just 8%.
Additional Survey Findings
The survey also found that 39% of Chinese people get their information on international security from Chinese state-run media (mainly through TV), with an additional 19% getting information from government websites and official social accounts. Conversely, only 1.7% get their news from foreign websites and foreign social media, partially due to the Great Firewall.
When asked about different international security issues, the biggest shares of Chinese citizens ranked the following as their top three:
- Pandemics (12.9%)
- Disputes over territory and territorial waters (12.9%)
- China-U.S. relations (12.0%)
The pandemic’s high score reflects the harsher impact COVID-19 had on China. Chinese borders were shut for years and the public faced intense measures to reduce spread.
In terms of other world events, the majority of Chinese people align with a more “Eastern” viewpoint. For example, in regards to the war in Ukraine, the report found that:
“About 80 percent of the respondents believe the U.S. and Western countries should be held most accountable [for the war], while less than ten percent of the respondents argue that Russia is mainly responsible.”– Center for International Security and Strategy, Tsinghua University
Overall, the views of the Chinese public reflect the opposite of those found in many Western countries. They provide an important insight that it is not just the Chinese government holding particular views about the world, but the Chinese public as well.

-

 Energy2 weeks ago
Who’s Still Buying Russian Fossil Fuels in 2023?
-

 VC+4 days ago
What’s New on VC+ in July
-

 Markets4 weeks ago
Visualizing BlackRock’s Top Equity Holdings
-

 apps2 weeks ago
Meet the Competing Apps Battling for Twitter’s Market Share
-

 Politics16 hours ago
How Do Chinese Citizens Feel About Other Countries?
-

 Markets4 weeks ago
Visualizing Every Company on the S&P 500 Index
-

 Markets2 weeks ago
Visualizing 1 Billion Square Feet of Empty Office Space
-

 Environment4 weeks ago
Life Cycle Emissions: EVs vs. Combustion Engine Vehicles