Markets
Ranked: Visualizing the Largest Trading Partners of the U.S.
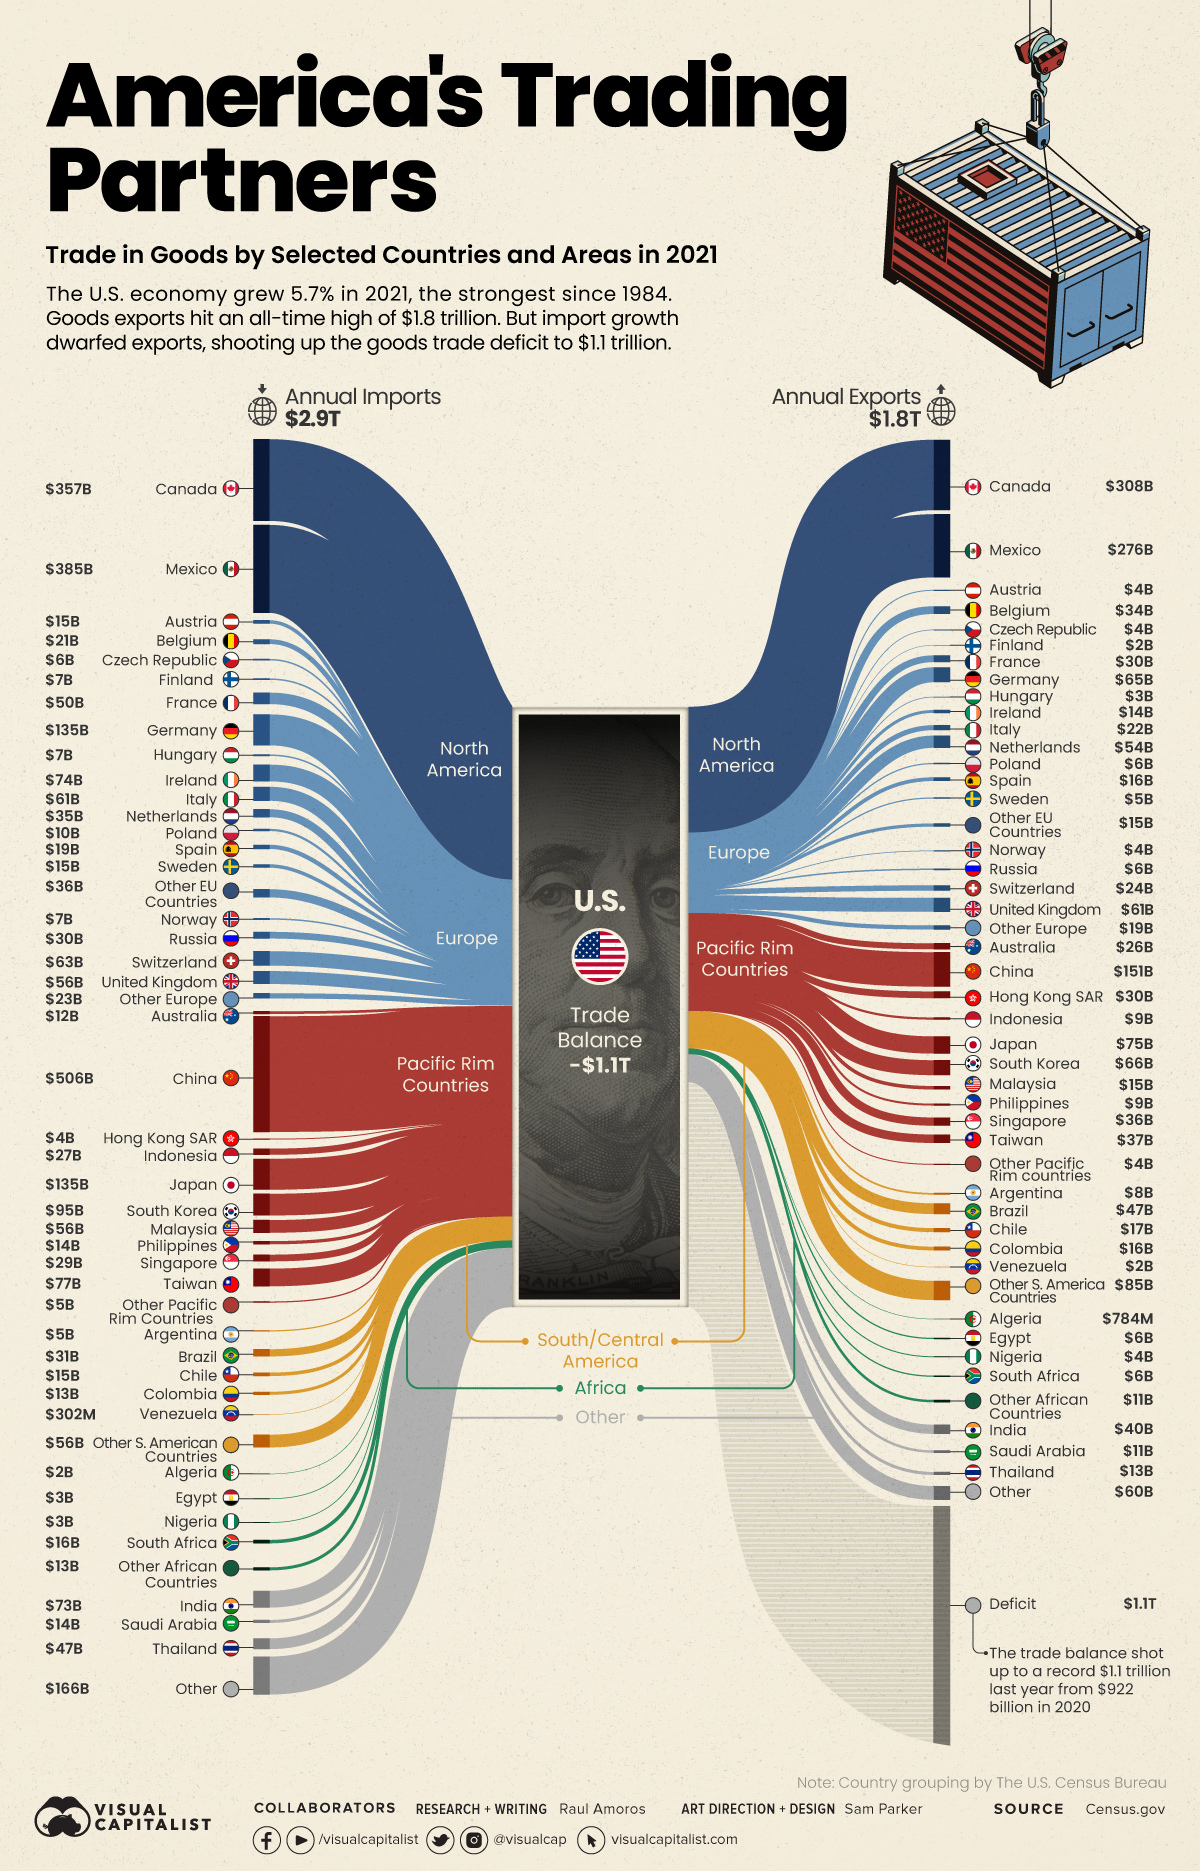


Ranked: The Largest Trading Partners of the U.S.
The U.S. economy grew 5.7% in 2021, the fastest pace since 1984, bouncing back from the economic downturn created by the pandemic. But as supply chain issues reared their head and international restrictions came in and out of play, how did the country’s trade situation shape up?
America’s trade deficit of goods shot up to a whopping record $1.1 trillion in 2021 from $922 billion in 2020, leading to its largest ever deficit. Imports dwarfed exports, reaching new highs of $2.9 trillion in 2021, while U.S. exports to other countries added up to $1.8 trillion.
Using the latest data on international trade from the U.S. Census Bureau, we’ve visualized the flow of America’s annual imports and exports for selected countries. The difference between the two measures is the country’s trade deficit for goods.
Who Does the U.S. Trade Most With?
In 2021, U.S trade of goods amounted to nearly $4.6 trillion and Canada, Mexico, and China were America’s largest trading partners. Those three countries alone combined for a total trade of $1.9 trillion, equal to about 41% of all trade of goods.
Let’s take a look at the 10 countries that trade the most with the United States:
| Rank | U.S. Trade Partners | Goods Imports (in billion U.S. dollars) | Goods Exports (in billion U.S. dollars) | Total Trade (in billion U.S. dollars) |
|---|---|---|---|---|
| #1 | 🇨🇦 Canada | $357.2 | $307.6 | $664.8 |
| #2 | 🇲🇽 Mexico | $384.7 | $276.5 | $661.2 |
| #3 | 🇨🇳 China | $506.4 | $151.1 | $657.5 |
| #4 | 🇯🇵 Japan | $135.1 | $75.0 | $210.1 |
| #5 | 🇩🇪 Germany | $135.2 | $65.2 | $200.4 |
| #6 | 🇰🇷 South Korea | $95 | $65.8 | $160.8 |
| #7 | 🇬🇧 United Kingdom | $56.4 | $61.5 | $117.9 |
| #8 | 🇹🇼 Taiwan | $77.1 | $36.9 | $114 |
| #9 | 🇮🇳 India | $73.3 | $40.1 | $113.4 |
| #10 | 🇻🇳 Vietnam | $101.9 | $10.9 | $112.8 |
| Total | $2.85 Trillion | $1.76 Trillion | $4.61 Trillion |
From a geographic perspective, the two largest trading partners are based in North America (Canada and Mexico). Meanwhile, six of the top 10 are based in Asia.
Which Countries Does the U.S. Have the Largest Trade Deficit With?
The largest trade deficit is undoubtedly with China, which accounts for more than 32% of the U.S. trade deficit in goods.
The $355 billion deficit with China comes from importing $506 billion in goods such as machinery, furniture, and bedding. Interestingly, many of those imports are made by American companies who outsource their production to China. These outsourcing activities are counted as imports even though they create profit for these U.S. companies.
Below we order U.S. trade partners by trade deficit of goods:
| Rank | U.S. Trade Partners | Goods Trade Deficit (in billion U.S. dollars) |
|---|---|---|
| #1 | 🇨🇳 China | $355.3 |
| #2 | 🇲🇽 Mexico | $108.2 |
| #3 | 🇻🇳 Vietnam | $91.0 |
| #4 | 🇩🇪 Germany | $70.1 |
| #5 | 🇯🇵 Japan | $60.2 |
| #6 | 🇮🇪 Ireland | $60.2 |
| #7 | 🇨🇦 Canada | $49.5 |
| #8 | 🇲🇾 Malaysia | $41.0 |
| #9 | 🇹🇼 Taiwan | $40.2 |
| #10 | 🇮🇹 Italy | $39.3 |
| Total Deficit | $1.09 Trillion |
The second largest U.S. trade deficit is with Mexico with $108 billion. The main imports from Mexico are cars, trucks, and auto parts. On the other side, the main exports are auto parts and petroleum products.
How Does a Trade Deficit Affect the U.S. Economy?
The U.S. has been running trade deficits since the late 1970s, so these latest numbers are a continuation of a long-term trend. Are these trade deficits a bad thing? The simple, unsatisfying answer is, it depends.
When any country spends more money on imports than it makes on exports, it must somehow make up the shortfall. Typically, this means takes the form of borrowing from foreign lenders or allowing foreign investment in domestic assets. In the U.S., the trade imbalance with China is a sore point, as millions of jobs in manufacturing have been lost due to offshoring in recent decades.
That said, running a trade surplus is no guarantee of strong economic performance. Germany is a prime example of a country with a massive trade surplus, but achieving only modest economic growth in recent years.


Markets
The 50 Best One-Year Returns on the S&P 500 (1980-2022)
The highest one-year return among the top S&P 500 stocks from 1980 to 2022 was a staggering 2,620%. Which stocks top the ranks?

The Top S&P 500 Stocks by Annual Returns
The average annual return of the S&P 500 was 10% from 1980-2022, excluding dividends. Of course, there are some companies that deliver much higher returns in any given year.
In this graphic using data from S&P Dow Jones Indices, we explore the top S&P 500 stocks with the best single year returns over the last four decades.
Ranking the Top S&P 500 Stocks
In order to find the top gainers, S&P took the top 10 best-performing stocks each year and then narrowed that list down to the top 50 overall. They ranked the top S&P 500 stocks by price returns, meaning that no dividends or stock distributions were included.
The best gains were clustered in a few select years, including the 1999 dot-com boom, the 2003 stock market rally, and the 2009 recovery from the Global Financial Crisis. None of the biggest gains happened in 2021 or 2022.
| Rank | Company | Sector | Return | Year |
|---|---|---|---|---|
| 1 | Qualcomm | Information Technology | 2620% | 1999 |
| 2 | Tesla | Consumer Discretionary | 743% | 2020 |
| 3 | DSC Communications | Communication Services | 468% | 1992 |
| 4 | Coleco Industries | Consumer Discretionary | 435% | 1982 |
| 5 | Avaya | Information Technology | 428% | 2003 |
| 6 | Chrysler | Consumer Discretionary | 426% | 1982 |
| 7 | XL Capital (Axa XL) | Financials | 395% | 2009 |
| 8 | Tenet Healthcare | Healthcare | 369% | 2009 |
| 9 | Dynegy | Utilities | 361% | 2000 |
| 10 | Advanced Micro Devices | Information Technology | 348% | 2009 |
| 11 | Sprint | Communication Services | 343% | 1999 |
| 12 | Ford | Consumer Discretionary | 337% | 2009 |
| 13 | NEXTEL Communications | Communication Services | 336% | 1999 |
| 14 | LSI Logic | Information Technology | 319% | 1999 |
| 15 | NVIDIA | Information Technology | 308% | 2001 |
| 16 | Nortel Networks | Communication Services | 304% | 1999 |
| 17 | Etsy | Consumer Discretionary | 302% | 2020 |
| 18 | Genworth Financial | Financials | 301% | 2009 |
| 19 | Micron Technology | Information Technology | 300% | 2009 |
| 20 | NetFlix | Communication Services | 298% | 2013 |
| 21 | Oracle | Information Technology | 290% | 1999 |
| 22 | Western Digital | Information Technology | 286% | 2009 |
| 23 | Network Appliance (NetApp) | Information Technology | 270% | 1999 |
| 24 | Data General | Information Technology | 267% | 1991 |
| 25 | Yahoo | Communication Services | 265% | 1999 |
| 26 | Williams Companies | Energy | 264% | 2003 |
| 27 | Novell | Information Technology | 264% | 1991 |
| 28 | Dynegy | Utilities | 263% | 2003 |
| 29 | Sun Microsystems | Information Technology | 262% | 1999 |
| 30 | PMC-Sierra | Information Technology | 262% | 2003 |
| 31 | Advanced Micro Devices | Information Technology | 259% | 1991 |
| 32 | Dell | Information Technology | 248% | 1998 |
| 33 | Global Marine | Energy | 247% | 1980 |
| 34 | Micron Technology | Information Technology | 243% | 2013 |
| 35 | Best Buy | Consumer Discretionary | 237% | 2013 |
| 36 | Reebok | Consumer Discretionary | 234% | 2000 |
| 37 | Freeport-McMoRan | Materials | 229% | 2009 |
| 38 | Biomet (Zimmer Biomet) | Healthcare | 226% | 1991 |
| 39 | NVIDIA | Information Technology | 224% | 2016 |
| 40 | Gap | Consumer Discretionary | 223% | 1991 |
| 41 | NetFlix | Communication Services | 219% | 2010 |
| 42 | Fleetwood Enterprises (Fleetwood RV) | Consumer Discretionary | 217% | 1982 |
| 43 | National Semiconductor | Information Technology | 217% | 1999 |
| 44 | Dell | Information Technology | 216% | 1997 |
| 45 | Tandy Corp (RadioShack) | Information Technology | 216% | 1980 |
| 46 | Novell | Information Technology | 215% | 2003 |
| 47 | Corning | Information Technology | 215% | 2003 |
| 48 | CB Richard Ellis (CBRE) | Real Estate | 214% | 2009 |
| 49 | AES Corp | Utilities | 213% | 2003 |
| 50 | Expedia | Consumer Discretionary | 212% | 2009 |
Qualcomm was by far the top-performer in any one calendar year window. The company had key patents for Code Division Multiple Access (CDMA) technology, which enabled fast wireless internet access and became the basis for 3G networks.
Its stock took off in 1999 as it shed less profitable business lines, resolved a patent dispute with competitor Ericsson, and joined the S&P 500 Index. At the time, CNN reported that one lucky investor who heard about Qualcomm from an investment-banker-turned-rabbi earned $17 million—roughly $30 million in today’s dollars.
The most recent stocks to make the rankings were both from 2020: well-known Tesla (#2) and lesser-known online marketplace Etsy (#17), which saw sales from independent creators surge during the early COVID-19 pandemic. The dollar value of items sold on Etsy more than doubled from $5.3 billion in 2019 to $10.3 billion in 2020, with mask sales accounting for 7% of the total.
Biggest Gainers in Each Sector
While information technology stocks made up nearly half of the list, there is representation from nine of the 11 S&P 500 sectors. No companies from the Industrials or Consumer Staples sectors made it into the ranks of the top S&P 500 stocks by annual returns.
Below, we show the stock with the best annual return for each sector.

Tesla was the top-performing Consumer Discretionary stock on the list. After meeting the requirement of four consecutive quarters of positive earnings, it joined the S&P 500 Index on December 21, 2020. The company’s performance was boosted by the announcement that it would be included in the S&P 500, along with strong performance in China, and general EV buzz as environmental regulations tightened worldwide.
In the realm of Communication Services, DSC Communications saw a sizable return in 1992. The telecommunications equipment company had contracts with major companies such as Bell and Motorola. Alcatel-Lucent (then Alcatel), a French producer of mobile phones, purchased DSC Communications in 1998.
Serial Success Stories
It’s impressive to make the list of the top S&P 500 stocks by calendar returns once, but there are seven companies that have done it twice.
Some stocks saw their repeated outperformance close together, with Dell making the ranks back-to-back in 1997 and 1998.

On the other hand, a select few have more staying power. Computing giant NVIDIA topped the charts in 2001 and triumphed again 15 years later in 2016. And this year might be another win, as the company has recently reached a $1 trillion market capitalization and has the highest year-to-date return in the S&P 500 as of July 6, 2023.

-

 Investor Education4 weeks ago
Visualizing BlackRock’s Top Equity Holdings
-

 Technology2 weeks ago
Meet the Competing Apps Battling for Twitter’s Market Share
-

 Public Opinion18 hours ago
How Do Chinese Citizens Feel About Other Countries?
-

 Markets4 weeks ago
Visualizing Every Company on the S&P 500 Index
-

 Markets2 weeks ago
Visualizing 1 Billion Square Feet of Empty Office Space
-

 Energy4 weeks ago
Life Cycle Emissions: EVs vs. Combustion Engine Vehicles
-

 Maps2 weeks ago
Vintage Viz: The World’s Rivers and Lakes, Organized Neatly
-

 Markets3 weeks ago
Visualized: The 100 Largest U.S. Banks by Consolidated Assets