Markets
Visualizing the Coming Shift in Global Economic Power (2006-2036p)


Visualizing the Shift in Global Economic Power
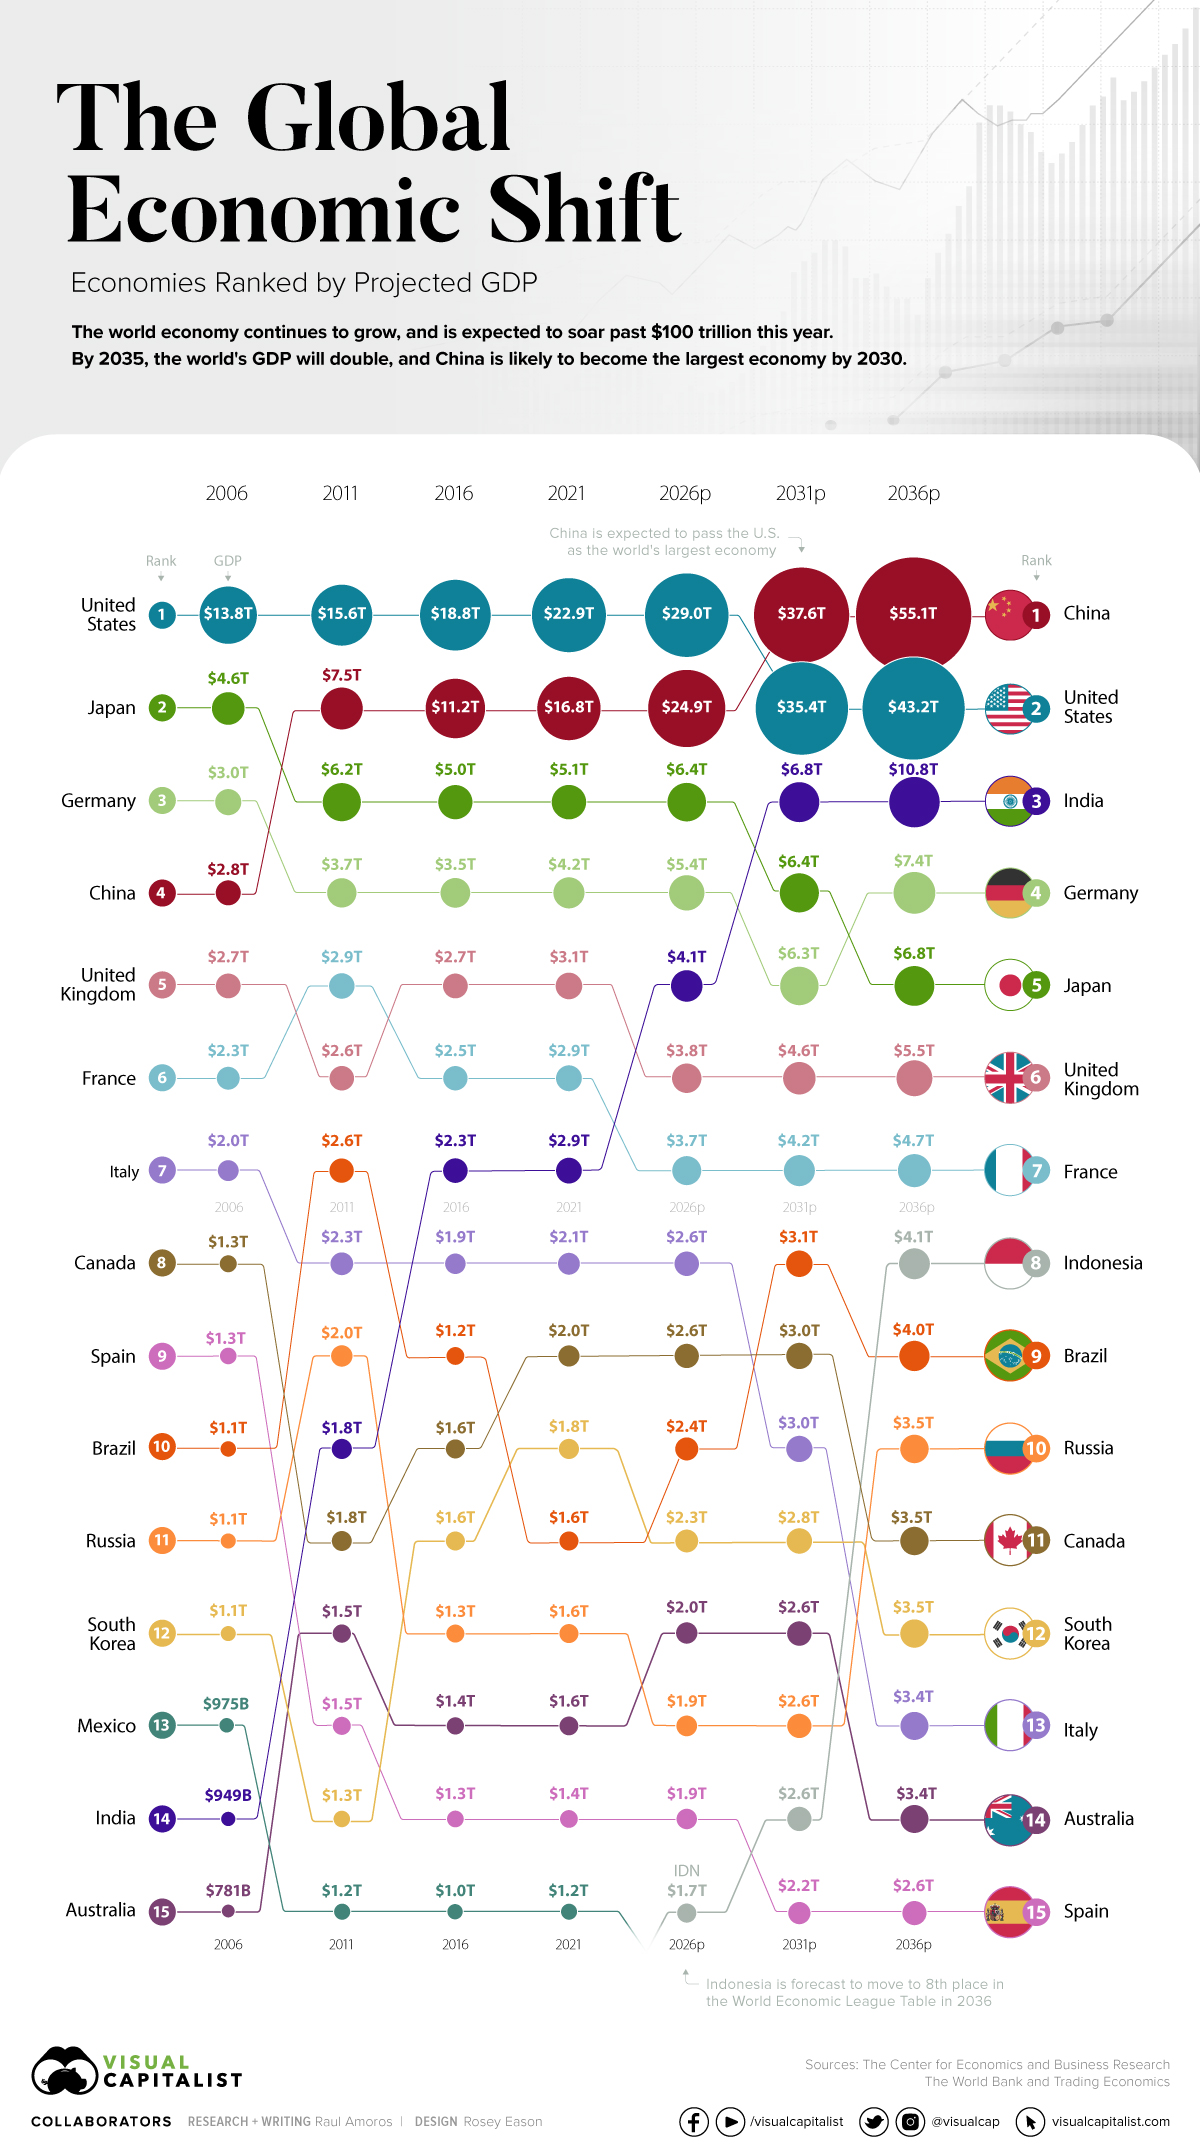
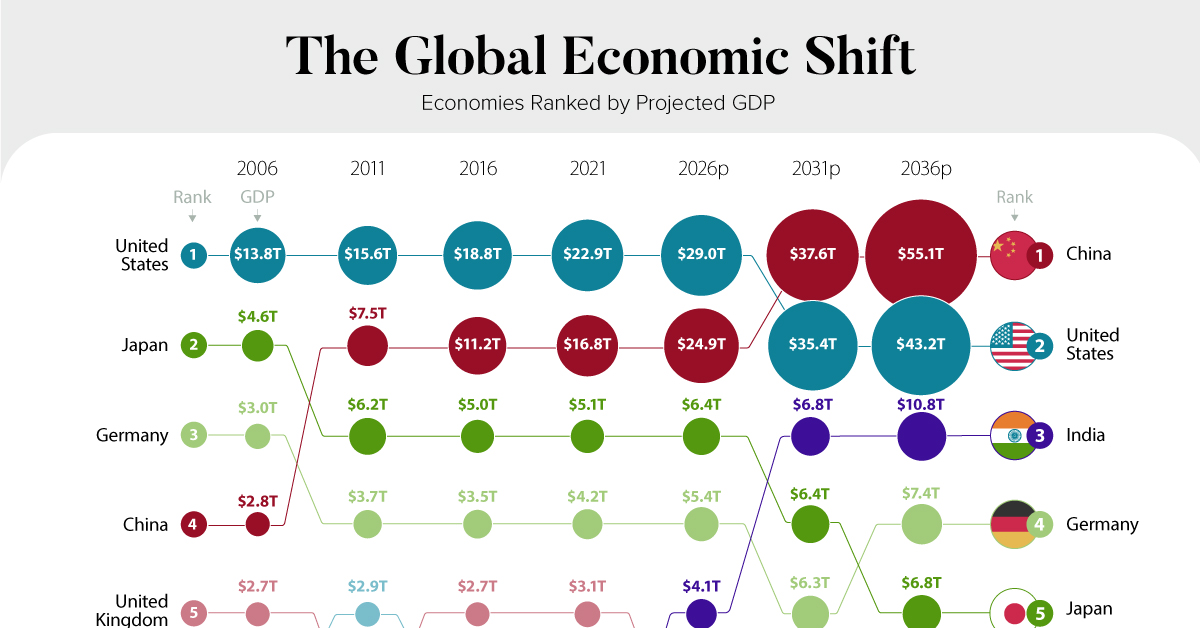
As the post-pandemic recovery chugs along, the global economy is set to see major changes in the coming decades. Most significantly, China is forecast to pass the United States to become the largest economy globally.
The world’s economic center has long been drifting from Europe and North America over to Asia. This global shift was kickstarted by lowered trade barriers and greater economic freedom, which attracted foreign direct investment (FDI). Another major driving factor was the improvements in infrastructure and communications, and a general increase in economic complexity in the region.
Our visualization uses data from the 13th edition of World Economic League Table 2022, a forecast published by the Center for Economics and Business Research (CEBR).
When Will China Become the Largest Economic Power?
China is expected to surpass the U.S. by the year 2030. A faster than expected recovery in the U.S. in 2021, and China’s struggles under the “Zero-COVID” policies have delayed the country taking the top spot by about two years.
China has maintained its positive GDP growth due to the stability provided by domestic demand. This has proven crucial in sustaining the country’s economic growth. China’s fiscal and economic policy had focused on this prior to the pandemic over fears of growing Western trade restrictions.
India is Primed for the #3 Spot
India is expected to become the third largest country in terms of GDP with $10.8 trillion projected in 2031.
Looking back, India had a GDP of just $949 billion in 2006. Fast forward to today and India’s GDP has more than tripled, reaching $3.1 trillion in 2022. Over the next 15 years, it’s expected to triple yet again. What is behind this impressive growth?
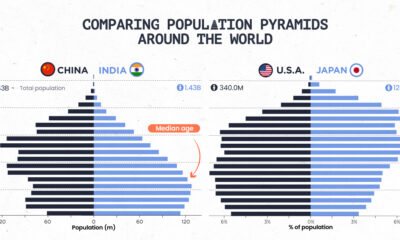
For starters, the country’s economy had a lot more room to improve than other nations. Demographics are also working in the country’s favor. While the median age in many mature economies is shooting up, India has a youthful workforce. In fact, India’s median age is a full 20 years lower than Japan, which is currently the third largest economy.
Over the last 60 years, the service industry has boomed to around 55% of India’s GDP. Telecommunications, software, and IT generate most of the revenue in this sector. IT alone produces 10% of the country’s GDP. India’s large tech-savvy, English-speaking workforce has proved attractive for international companies like Intel, Google, Meta, Microsoft, IBM, and many others, while the domestic startup scene continues to boom.
The Indian government is also pursuing “production-linked incentives” (i.e. subsidies) for multinational companies looking to diversify their production away from China. If these incentives prove successful, more of the world’s solar panels and smartphones will be produced within India’s borders.
How Will the Global Economy Look in 2031?
By the year 2031, there will be major changes in the global economic power rankings.
As we said before: China will have become the world’s largest economy in terms of GDP and India will be the world’s third largest economy. Let’s also take a look at the top 10 economies by 2031.
| Rank | Country | Region | Projected GDP in 2031 (in Trillions of USD) |
|---|---|---|---|
| 1 | 🇨🇳 China | Asia | $37.6 |
| 2 | 🇺🇸 United States | North America | $35.4 |
| 3 | 🇮🇳 India | Asia | $6.8 |
| 4 | 🇯🇵 Japan | Asia | $6.4 |
| 5 | 🇩🇪 Germany | Europe | $6.3 |
| 6 | 🇬🇧 United Kingdom | Europe | $4.6 |
| 7 | 🇫🇷 France | Europe | $4.2 |
| 8 | 🇧🇷 Brazil | South America | $3.1 |
| 9 | 🇨🇦 Canada | North America | $3.0 |
| 10 | 🇮🇹 Italy | Europe | $3.0 |
Out of the top five economies, three are located in Asia: China, India, and Japan—a clear demonstration of how economic power is shifting towards large population centers in Asia.
Europe will have four countries in the top 10: Germany, the United Kingdom, France, and Italy. From South America, only Brazil appears in the top 10.
Under these projections, Russia sits outside the top 10 in 2031. Of course, it remains to be seen how crushing sanctions and global isolation will affect the economic trajectory of the country.
Now, the big question. Is it inevitable that China takes the top spot in the global economy as predicted by this forecast? The truth is that nothing is guaranteed. Other projections have modeled reasonable alternative scenarios for China’s economy. A debt crisis, international isolation, or a shrinking population could keep China’s economy in second place for longer than expected.


Markets
The 50 Best One-Year Returns on the S&P 500 (1980-2022)
The highest one-year return among the top S&P 500 stocks from 1980 to 2022 was a staggering 2,620%. Which stocks top the ranks?

The Top S&P 500 Stocks by Annual Returns
The average annual return of the S&P 500 was 10% from 1980-2022, excluding dividends. Of course, there are some companies that deliver much higher returns in any given year.
In this graphic using data from S&P Dow Jones Indices, we explore the top S&P 500 stocks with the best single year returns over the last four decades.
Ranking the Top S&P 500 Stocks
In order to find the top gainers, S&P took the top 10 best-performing stocks each year and then narrowed that list down to the top 50 overall. They ranked the top S&P 500 stocks by price returns, meaning that no dividends or stock distributions were included.
The best gains were clustered in a few select years, including the 1999 dot-com boom, the 2003 stock market rally, and the 2009 recovery from the Global Financial Crisis. None of the biggest gains happened in 2021 or 2022.
| Rank | Company | Sector | Return | Year |
|---|---|---|---|---|
| 1 | Qualcomm | Information Technology | 2620% | 1999 |
| 2 | Tesla | Consumer Discretionary | 743% | 2020 |
| 3 | DSC Communications | Communication Services | 468% | 1992 |
| 4 | Coleco Industries | Consumer Discretionary | 435% | 1982 |
| 5 | Avaya | Information Technology | 428% | 2003 |
| 6 | Chrysler | Consumer Discretionary | 426% | 1982 |
| 7 | XL Capital (Axa XL) | Financials | 395% | 2009 |
| 8 | Tenet Healthcare | Healthcare | 369% | 2009 |
| 9 | Dynegy | Utilities | 361% | 2000 |
| 10 | Advanced Micro Devices | Information Technology | 348% | 2009 |
| 11 | Sprint | Communication Services | 343% | 1999 |
| 12 | Ford | Consumer Discretionary | 337% | 2009 |
| 13 | NEXTEL Communications | Communication Services | 336% | 1999 |
| 14 | LSI Logic | Information Technology | 319% | 1999 |
| 15 | NVIDIA | Information Technology | 308% | 2001 |
| 16 | Nortel Networks | Communication Services | 304% | 1999 |
| 17 | Etsy | Consumer Discretionary | 302% | 2020 |
| 18 | Genworth Financial | Financials | 301% | 2009 |
| 19 | Micron Technology | Information Technology | 300% | 2009 |
| 20 | NetFlix | Communication Services | 298% | 2013 |
| 21 | Oracle | Information Technology | 290% | 1999 |
| 22 | Western Digital | Information Technology | 286% | 2009 |
| 23 | Network Appliance (NetApp) | Information Technology | 270% | 1999 |
| 24 | Data General | Information Technology | 267% | 1991 |
| 25 | Yahoo | Communication Services | 265% | 1999 |
| 26 | Williams Companies | Energy | 264% | 2003 |
| 27 | Novell | Information Technology | 264% | 1991 |
| 28 | Dynegy | Utilities | 263% | 2003 |
| 29 | Sun Microsystems | Information Technology | 262% | 1999 |
| 30 | PMC-Sierra | Information Technology | 262% | 2003 |
| 31 | Advanced Micro Devices | Information Technology | 259% | 1991 |
| 32 | Dell | Information Technology | 248% | 1998 |
| 33 | Global Marine | Energy | 247% | 1980 |
| 34 | Micron Technology | Information Technology | 243% | 2013 |
| 35 | Best Buy | Consumer Discretionary | 237% | 2013 |
| 36 | Reebok | Consumer Discretionary | 234% | 2000 |
| 37 | Freeport-McMoRan | Materials | 229% | 2009 |
| 38 | Biomet (Zimmer Biomet) | Healthcare | 226% | 1991 |
| 39 | NVIDIA | Information Technology | 224% | 2016 |
| 40 | Gap | Consumer Discretionary | 223% | 1991 |
| 41 | NetFlix | Communication Services | 219% | 2010 |
| 42 | Fleetwood Enterprises (Fleetwood RV) | Consumer Discretionary | 217% | 1982 |
| 43 | National Semiconductor | Information Technology | 217% | 1999 |
| 44 | Dell | Information Technology | 216% | 1997 |
| 45 | Tandy Corp (RadioShack) | Information Technology | 216% | 1980 |
| 46 | Novell | Information Technology | 215% | 2003 |
| 47 | Corning | Information Technology | 215% | 2003 |
| 48 | CB Richard Ellis (CBRE) | Real Estate | 214% | 2009 |
| 49 | AES Corp | Utilities | 213% | 2003 |
| 50 | Expedia | Consumer Discretionary | 212% | 2009 |
Qualcomm was by far the top-performer in any one calendar year window. The company had key patents for Code Division Multiple Access (CDMA) technology, which enabled fast wireless internet access and became the basis for 3G networks.
Its stock took off in 1999 as it shed less profitable business lines, resolved a patent dispute with competitor Ericsson, and joined the S&P 500 Index. At the time, CNN reported that one lucky investor who heard about Qualcomm from an investment-banker-turned-rabbi earned $17 million—roughly $30 million in today’s dollars.
The most recent stocks to make the rankings were both from 2020: well-known Tesla (#2) and lesser-known online marketplace Etsy (#17), which saw sales from independent creators surge during the early COVID-19 pandemic. The dollar value of items sold on Etsy more than doubled from $5.3 billion in 2019 to $10.3 billion in 2020, with mask sales accounting for 7% of the total.
Biggest Gainers in Each Sector
While information technology stocks made up nearly half of the list, there is representation from nine of the 11 S&P 500 sectors. No companies from the Industrials or Consumer Staples sectors made it into the ranks of the top S&P 500 stocks by annual returns.
Below, we show the stock with the best annual return for each sector.

Tesla was the top-performing Consumer Discretionary stock on the list. After meeting the requirement of four consecutive quarters of positive earnings, it joined the S&P 500 Index on December 21, 2020. The company’s performance was boosted by the announcement that it would be included in the S&P 500, along with strong performance in China, and general EV buzz as environmental regulations tightened worldwide.
In the realm of Communication Services, DSC Communications saw a sizable return in 1992. The telecommunications equipment company had contracts with major companies such as Bell and Motorola. Alcatel-Lucent (then Alcatel), a French producer of mobile phones, purchased DSC Communications in 1998.
Serial Success Stories
It’s impressive to make the list of the top S&P 500 stocks by calendar returns once, but there are seven companies that have done it twice.
Some stocks saw their repeated outperformance close together, with Dell making the ranks back-to-back in 1997 and 1998.

On the other hand, a select few have more staying power. Computing giant NVIDIA topped the charts in 2001 and triumphed again 15 years later in 2016. And this year might be another win, as the company has recently reached a $1 trillion market capitalization and has the highest year-to-date return in the S&P 500 as of July 6, 2023.

-

 Energy2 weeks ago
Who’s Still Buying Russian Fossil Fuels in 2023?
-

 VC+5 days ago
What’s New on VC+ in July
-

 Investor Education4 weeks ago
Visualizing BlackRock’s Top Equity Holdings
-

 Technology2 weeks ago
Meet the Competing Apps Battling for Twitter’s Market Share
-

 China18 hours ago
How Do Chinese Citizens Feel About Other Countries?
-

 Markets4 weeks ago
Visualizing Every Company on the S&P 500 Index
-

 Markets2 weeks ago
Visualizing 1 Billion Square Feet of Empty Office Space
-

 Energy4 weeks ago
Life Cycle Emissions: EVs vs. Combustion Engine Vehicles