Markets
The $100 Trillion Global Economy in One Chart
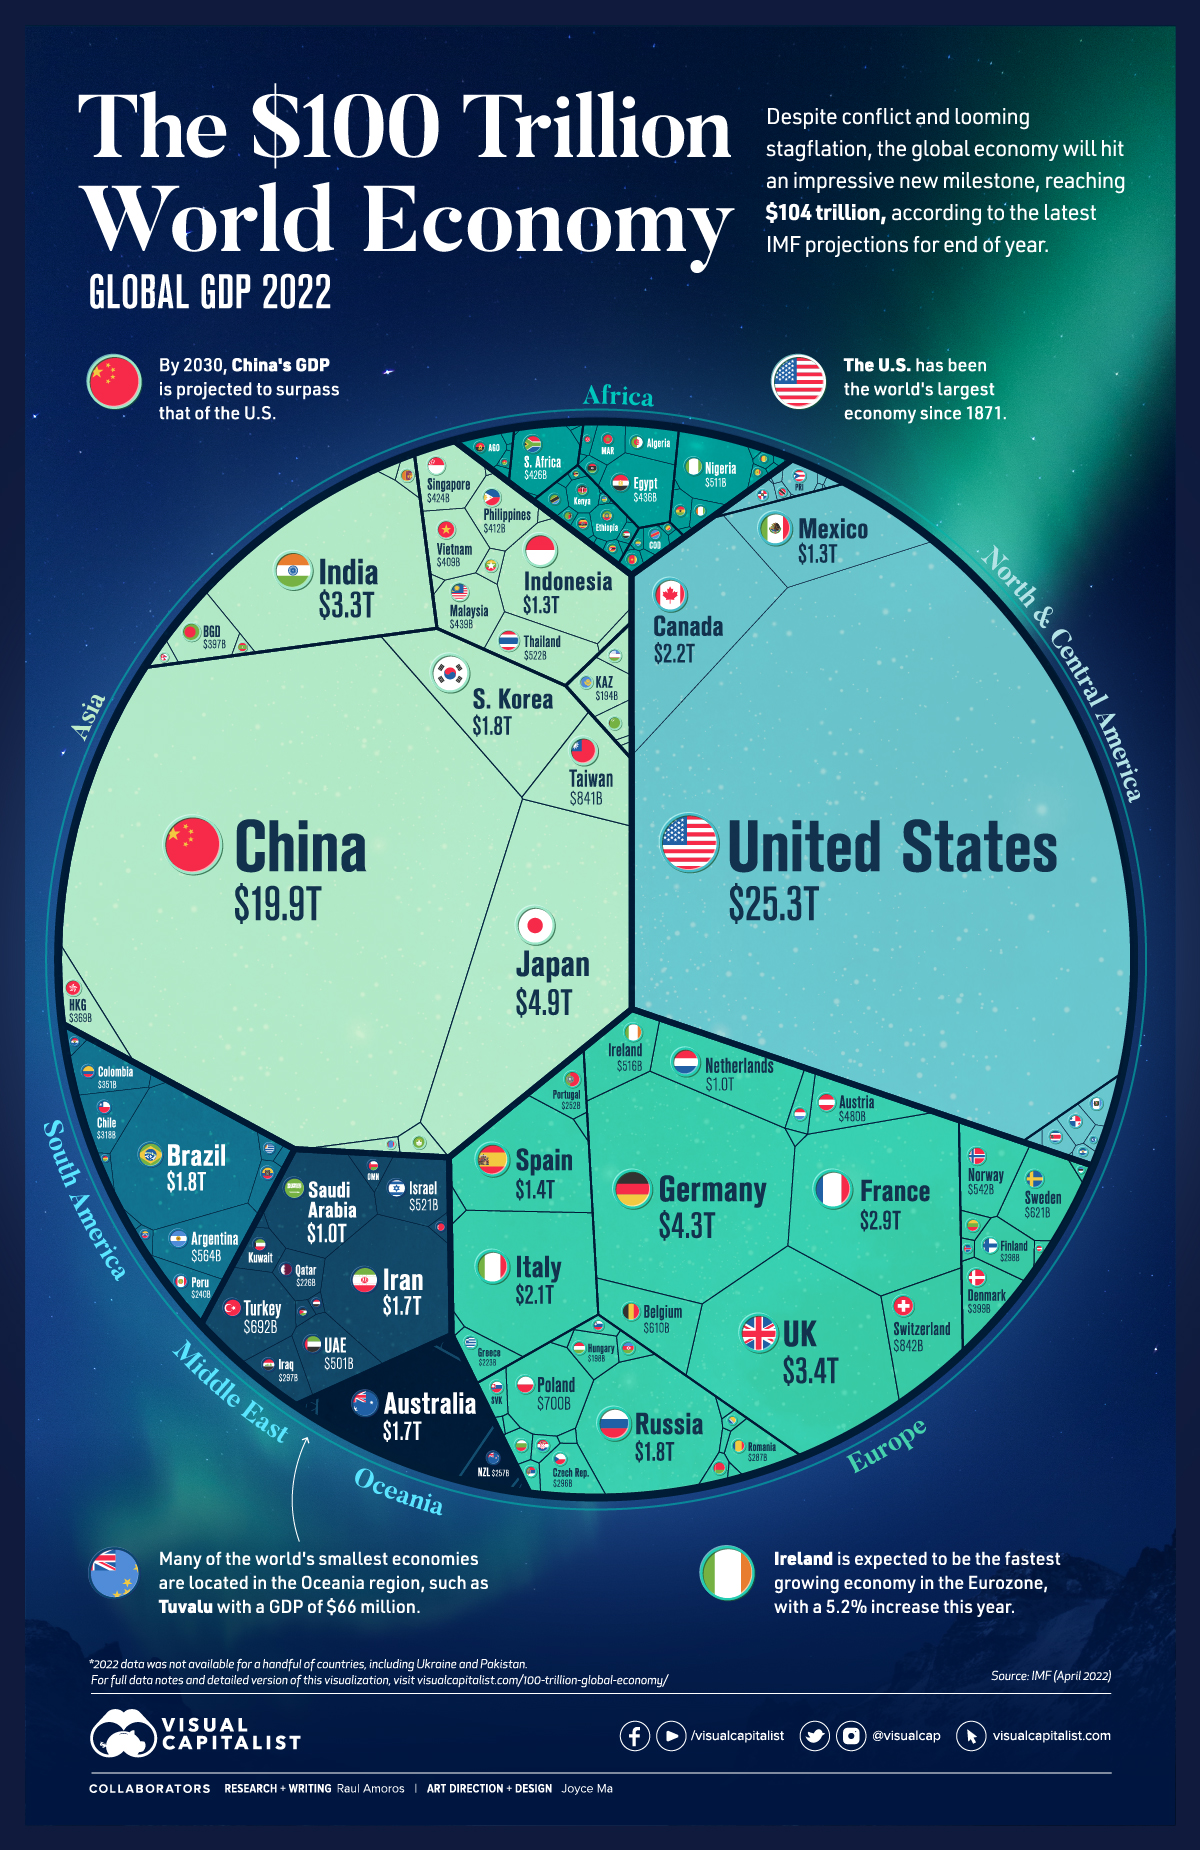


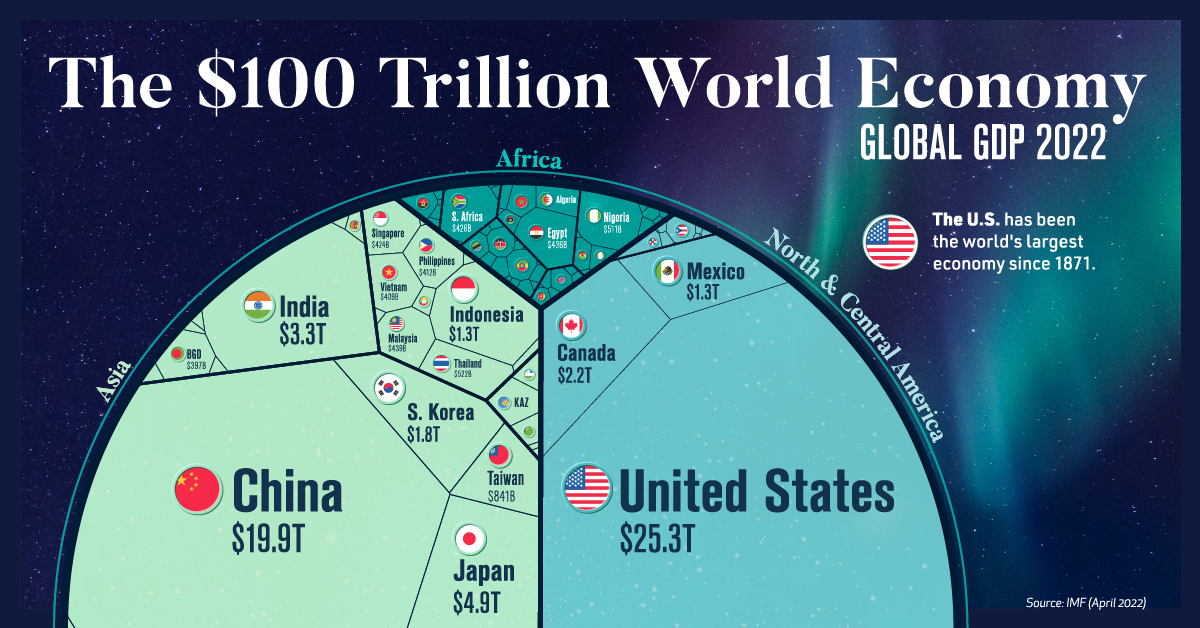
Visualizing the $100 Trillion Global Economy in One Chart
Surpassing the $100 trillion mark is a new milestone for global economic output.
We’ve covered this topic in the past when the world’s GDP was $88 trillion (2020) and then $94 trillion (2021), and now according to the latest projections, the IMF expects the global economy to reach nearly $104 trillion in nominal value by the end of 2022.
Although growth keeps trending upwards, the recovery that was expected in the post-pandemic period is looking strained. Because of recent conflicts, supply chain bottlenecks, and subsequent inflation, global economic projections are getting revised downwards.
Global annual GDP growth for 2022 was initially projected to be 4.4% as of January, but this has since been adjusted to 3.6%.
Note: This data from the IMF represents the most recent nominal projections for end of year as of April 2022.
The 50 Largest Economies in the World
The United States is still the economic leader worldwide, with a GDP of $25.3 trillion—making up nearly one quarter of the global economy. China follows close behind at $19.9 trillion. Here’s a look at the top 50 countries in terms of GDP:
| Rank | Country | GDP (current prices, USD) |
|---|---|---|
| #1 | 🇺🇸 United States | $25.3 trillion |
| #2 | 🇨🇳 China | $19.9 trillion |
| #3 | 🇯🇵 Japan | $4.9 trillion |
| #4 | 🇩🇪 Germany | $4.3 trillion |
| #5 | 🇬🇧 United Kingdom | $3.4 trillion |
| #6 | 🇮🇳 India | $3.3 trillion |
| #7 | 🇫🇷 France | $2.9 trillion |
| #8 | 🇨🇦 Canada | $2.2 trillion |
| #9 | 🇮🇹 Italy | $2.1 trillion |
| #10 | 🇧🇷 Brazil | $1.8 trillion |
| #11 | 🇷🇺 Russia | $1.8 trillion |
| #12 | 🇰🇷 South Korea | $1.8 trillion |
| #13 | 🇦🇺 Australia | $1.7 trillion |
| #14 | 🇮🇷 Iran | $1.7 trillion |
| #15 | 🇪🇸 Spain | $1.4 trillion |
| #16 | 🇲🇽 Mexico | $1.3 trillion |
| #17 | 🇮🇩 Indonesia | $1.3 trillion |
| #18 | 🇸🇦 Saudi Arabia | $1.0 trillion |
| #19 | 🇳🇱 Netherlands | $1.0 trillion |
| #20 | 🇨🇭 Switzerland | $842 billion |
| #21 | 🇹🇼 Taiwan | $841 billion |
| #22 | 🇵🇱 Poland | $700 billion |
| #23 | 🇹🇷 Turkey | $692 billion |
| #24 | 🇸🇪 Sweden | $621 billion |
| #25 | 🇧🇪 Belgium | $610 billion |
| #26 | 🇦🇷 Argentina | $564 billion |
| #27 | 🇳🇴 Norway | $542 billion |
| #28 | 🇹🇭 Thailand | $522 billion |
| #29 | 🇮🇱 Israel | $521 billion |
| #30 | 🇮🇪 Ireland | $516 billion |
| #31 | 🇳🇬 Nigeria | $511 billion |
| #32 | 🇦🇪 United Arab Emirates | $501 billion |
| #33 | 🇦🇹 Austria | $480 billion |
| #34 | 🇲🇾 Malaysia | $439 billion |
| #35 | 🇪🇬 Egypt | $436 billion |
| #36 | 🇿🇦 South Africa | $426 billion |
| #37 | 🇸🇬 Singapore | $424 billion |
| #38 | 🇵🇭 Philippines | $412 billion |
| #39 | 🇻🇳 Vietnam | $409 billion |
| #40 | 🇩🇰 Denmark | $399 billion |
| #41 | 🇧🇩 Bangladesh | $397 billion |
| #42 | 🇭🇰 Hong Kong SAR | $369 billion |
| #43 | 🇨🇴 Colombia | $351 billion |
| #44 | 🇨🇱 Chile | $318 billion |
| #45 | 🇫🇮 Finland | $298 billion |
| #46 | 🇮🇶 Iraq | $297 billion |
| #47 | 🇨🇿 Czechia | $296 billion |
| #48 | 🇷🇴 Romania | $287 billion |
| #49 | 🇳🇿 New Zealand | $257 billion |
| #50 | 🇵🇹 Portugal | $252 billion |
The frontrunner in Europe is Germany at $4.3 trillion, with the UK coming in second place. One significant change since the last reported figures is that Brazil now cracks the top 10, having surpassed South Korea. Russia falls just outside, in 11th place, with a GDP of $1.8 trillion.
While China’s GDP growth has slowed in recent years, projections still indicate that the country will overtake the U.S. by 2030, dethroning the world’s economic leader.
One region also expected to experience growth in the near future is the Middle East and North Africa, thanks to higher oil prices—Iraq and Saudi Arabia in particular are leading this charge. Regional GDP growth in the area is expected to be around 5% in 2022.
The 50 Smallest Economies in the World
Some of the world’s smallest economies were hit particularly hard by the pandemic, and have subsequently been the most affected by the inflation and food supply shortages resulting from the war in Ukraine.
Here’s a look at the countries worldwide with the lowest GDP in 2022:
| Rank | Country | GDP (current prices, USD) |
|---|---|---|
| #191 | 🇹🇻 Tuvalu | $66 million |
| #190 | 🇳🇷 Nauru | $134 million |
| #189 | 🇰🇮 Kiribati | $216 million |
| #188 | 🇵🇼 Palau | $244 million |
| #187 | 🇲🇭 Marshall Islands | $267 million |
| #186 | 🇫🇲 Micronesia | $427 million |
| #185 | 🇸🇹 São Tomé and Príncipe | $1 billion |
| #184 | 🇹🇴 Tonga | $1 billion |
| #183 | 🇩🇲 Dominica | $1 billion |
| #182 | 🇼🇸 Samoa | $1 billion |
| #181 | 🇻🇨 Saint Vincent and the Grenadines | $1 billion |
| #180 | 🇻🇺 Vanuatu | $1 billion |
| #179 | 🇰🇳 Saint Kitts and Nevis | $1 billion |
| #178 | 🇬🇩 Grenada | $1 billion |
| #177 | 🇰🇲 Comoros | $1 billion |
| #176 | 🇦🇬 Antigua and Barbuda | $2 billion |
| #175 | 🇬🇼 Guinea-Bissau | $2 billion |
| #174 | 🇸🇧 Solomon Islands | $2 billion |
| #173 | 🇸🇲 San Marino | $2 billion |
| #172 | 🇸🇨 Seychelles | $2 billion |
| #171 | 🇹🇱 Timor-Leste | $2 billion |
| #170 | 🇧🇿 Belize | $2 billion |
| #169 | 🇨🇻 Cabo Verde | $2 billion |
| #168 | 🇱🇨 Saint Lucia | $2 billion |
| #167 | 🇬🇲 The Gambia | $2 billion |
| #166 | 🇱🇸 Lesotho | $3 billion |
| #165 | 🇪🇷 Eritrea | $3 billion |
| #164 | 🇨🇫 Central African Republic | $3 billion |
| #163 | 🇧🇹 Bhutan | $3 billion |
| #162 | 🇸🇷 Suriname | $3 billion |
| #161 | 🇦🇼 Aruba | $3 billion |
| #160 | 🇦🇩 Andorra | $3 billion |
| #159 | 🇧🇮 Burundi | $3 billion |
| #158 | 🇱🇷 Liberia | $4 billion |
| #157 | 🇩🇯 Djibouti | $4 billion |
| #156 | 🇸🇱 Sierra Leone | $4 billion |
| #155 | 🇸🇿 Eswatini | $5 billion |
| #154 | 🇫🇯 Fiji | $5 billion |
| #153 | 🇲🇻 Maldives | $6 billion |
| #152 | 🇧🇧 Barbados | $6 billion |
| #151 | 🇸🇸 South Sudan | $6 billion |
| #150 | 🇲🇪 Montenegro | $6 billion |
| #149 | 🇹🇯 Tajikistan | $8 billion |
| #148 | 🇸🇴 Somalia | $8 billion |
| #147 | 🇹🇬 Togo | $9 billion |
| #146 | 🇰🇬 Kyrgyzstan | $9 billion |
| #145 | 🇲🇷 Mauritania | $9 billion |
| #144 | 🇽🇰 Kosovo | $10 billion |
| #143 | 🇲🇺 Mauritius | $11 billion |
| #142 | 🇲🇼 Malawi | $12 billion |
The smallest economy in the world measured in the IMF rankings is Tuvalu at $66 million. Most of the bottom 50 are considered low- to middle-income and emerging/developing countries. According to the World Bank, in developing countries, the level of per capita income in 2022 will be about 5% below the pre-pandemic trends.
Some countries are actually projected to experience negative GDP growth this year, particularly emerging and developing economies in Europe.
For example, Russia is expected to experience a GDP growth rate of -8.5% in 2022, though it still remains to be seen how the cost of war and increasingly harsh global sanctions impact the country’s economic prospects.
Inflation, Stagflation, Recession – How Bad is it?
While global economic growth has already been revised downwards, it’s possible the situation could be even more serious. Organizations like the World Bank say that risks of stagflation are rising. Stagflation, which hasn’t occurred since the 1970s, is defined as an economy that’s experiencing rising inflation combined with a stagnant economic output.
Currently, global consumer inflation is currently pegged at 7%. Daily goods are becoming increasingly difficult to purchase and interest rates are on the rise as central banks worldwide try to control the situation. As recent events in Sri Lanka demonstrate, low-income countries are particularly at risk to economic volatility.


Markets
The 50 Best One-Year Returns on the S&P 500 (1980-2022)
The highest one-year return among the top S&P 500 stocks from 1980 to 2022 was a staggering 2,620%. Which stocks top the ranks?

The Top S&P 500 Stocks by Annual Returns
The average annual return of the S&P 500 was 10% from 1980-2022, excluding dividends. Of course, there are some companies that deliver much higher returns in any given year.
In this graphic using data from S&P Dow Jones Indices, we explore the top S&P 500 stocks with the best single year returns over the last four decades.
Ranking the Top S&P 500 Stocks
In order to find the top gainers, S&P took the top 10 best-performing stocks each year and then narrowed that list down to the top 50 overall. They ranked the top S&P 500 stocks by price returns, meaning that no dividends or stock distributions were included.
The best gains were clustered in a few select years, including the 1999 dot-com boom, the 2003 stock market rally, and the 2009 recovery from the Global Financial Crisis. None of the biggest gains happened in 2021 or 2022.
| Rank | Company | Sector | Return | Year |
|---|---|---|---|---|
| 1 | Qualcomm | Information Technology | 2620% | 1999 |
| 2 | Tesla | Consumer Discretionary | 743% | 2020 |
| 3 | DSC Communications | Communication Services | 468% | 1992 |
| 4 | Coleco Industries | Consumer Discretionary | 435% | 1982 |
| 5 | Avaya | Information Technology | 428% | 2003 |
| 6 | Chrysler | Consumer Discretionary | 426% | 1982 |
| 7 | XL Capital (Axa XL) | Financials | 395% | 2009 |
| 8 | Tenet Healthcare | Healthcare | 369% | 2009 |
| 9 | Dynegy | Utilities | 361% | 2000 |
| 10 | Advanced Micro Devices | Information Technology | 348% | 2009 |
| 11 | Sprint | Communication Services | 343% | 1999 |
| 12 | Ford | Consumer Discretionary | 337% | 2009 |
| 13 | NEXTEL Communications | Communication Services | 336% | 1999 |
| 14 | LSI Logic | Information Technology | 319% | 1999 |
| 15 | NVIDIA | Information Technology | 308% | 2001 |
| 16 | Nortel Networks | Communication Services | 304% | 1999 |
| 17 | Etsy | Consumer Discretionary | 302% | 2020 |
| 18 | Genworth Financial | Financials | 301% | 2009 |
| 19 | Micron Technology | Information Technology | 300% | 2009 |
| 20 | NetFlix | Communication Services | 298% | 2013 |
| 21 | Oracle | Information Technology | 290% | 1999 |
| 22 | Western Digital | Information Technology | 286% | 2009 |
| 23 | Network Appliance (NetApp) | Information Technology | 270% | 1999 |
| 24 | Data General | Information Technology | 267% | 1991 |
| 25 | Yahoo | Communication Services | 265% | 1999 |
| 26 | Williams Companies | Energy | 264% | 2003 |
| 27 | Novell | Information Technology | 264% | 1991 |
| 28 | Dynegy | Utilities | 263% | 2003 |
| 29 | Sun Microsystems | Information Technology | 262% | 1999 |
| 30 | PMC-Sierra | Information Technology | 262% | 2003 |
| 31 | Advanced Micro Devices | Information Technology | 259% | 1991 |
| 32 | Dell | Information Technology | 248% | 1998 |
| 33 | Global Marine | Energy | 247% | 1980 |
| 34 | Micron Technology | Information Technology | 243% | 2013 |
| 35 | Best Buy | Consumer Discretionary | 237% | 2013 |
| 36 | Reebok | Consumer Discretionary | 234% | 2000 |
| 37 | Freeport-McMoRan | Materials | 229% | 2009 |
| 38 | Biomet (Zimmer Biomet) | Healthcare | 226% | 1991 |
| 39 | NVIDIA | Information Technology | 224% | 2016 |
| 40 | Gap | Consumer Discretionary | 223% | 1991 |
| 41 | NetFlix | Communication Services | 219% | 2010 |
| 42 | Fleetwood Enterprises (Fleetwood RV) | Consumer Discretionary | 217% | 1982 |
| 43 | National Semiconductor | Information Technology | 217% | 1999 |
| 44 | Dell | Information Technology | 216% | 1997 |
| 45 | Tandy Corp (RadioShack) | Information Technology | 216% | 1980 |
| 46 | Novell | Information Technology | 215% | 2003 |
| 47 | Corning | Information Technology | 215% | 2003 |
| 48 | CB Richard Ellis (CBRE) | Real Estate | 214% | 2009 |
| 49 | AES Corp | Utilities | 213% | 2003 |
| 50 | Expedia | Consumer Discretionary | 212% | 2009 |
Qualcomm was by far the top-performer in any one calendar year window. The company had key patents for Code Division Multiple Access (CDMA) technology, which enabled fast wireless internet access and became the basis for 3G networks.
Its stock took off in 1999 as it shed less profitable business lines, resolved a patent dispute with competitor Ericsson, and joined the S&P 500 Index. At the time, CNN reported that one lucky investor who heard about Qualcomm from an investment-banker-turned-rabbi earned $17 million—roughly $30 million in today’s dollars.
The most recent stocks to make the rankings were both from 2020: well-known Tesla (#2) and lesser-known online marketplace Etsy (#17), which saw sales from independent creators surge during the early COVID-19 pandemic. The dollar value of items sold on Etsy more than doubled from $5.3 billion in 2019 to $10.3 billion in 2020, with mask sales accounting for 7% of the total.
Biggest Gainers in Each Sector
While information technology stocks made up nearly half of the list, there is representation from nine of the 11 S&P 500 sectors. No companies from the Industrials or Consumer Staples sectors made it into the ranks of the top S&P 500 stocks by annual returns.
Below, we show the stock with the best annual return for each sector.

Tesla was the top-performing Consumer Discretionary stock on the list. After meeting the requirement of four consecutive quarters of positive earnings, it joined the S&P 500 Index on December 21, 2020. The company’s performance was boosted by the announcement that it would be included in the S&P 500, along with strong performance in China, and general EV buzz as environmental regulations tightened worldwide.
In the realm of Communication Services, DSC Communications saw a sizable return in 1992. The telecommunications equipment company had contracts with major companies such as Bell and Motorola. Alcatel-Lucent (then Alcatel), a French producer of mobile phones, purchased DSC Communications in 1998.
Serial Success Stories
It’s impressive to make the list of the top S&P 500 stocks by calendar returns once, but there are seven companies that have done it twice.
Some stocks saw their repeated outperformance close together, with Dell making the ranks back-to-back in 1997 and 1998.

On the other hand, a select few have more staying power. Computing giant NVIDIA topped the charts in 2001 and triumphed again 15 years later in 2016. And this year might be another win, as the company has recently reached a $1 trillion market capitalization and has the highest year-to-date return in the S&P 500 as of July 6, 2023.

-

 Markets2 weeks ago
Ranked: The Most Profitable U.S. Companies, by Sector
-

 apps5 days ago
How Long it Took for Popular Apps to Reach 100 Million Users
-

 Markets4 weeks ago
The World’s Biggest Mutual Fund and ETF Providers
-

 Markets2 weeks ago
Brand Reputations: Ranking the Best and Worst in 2023
-

 Environment5 days ago
Hotter Than Ever: 2023 Sets New Global Temperature Records
-

 Datastream4 weeks ago
Can You Calculate Your Daily Carbon Footprint?
-

 Energy2 weeks ago
Who’s Still Buying Russian Fossil Fuels in 2023?
-

 VC+5 days ago
What’s New on VC+ in July