Maps
Mapped: European Colonial Shipping Lanes (1700‒1850)
Article/Editing:
Click to view this graphic in a higher-resolution.
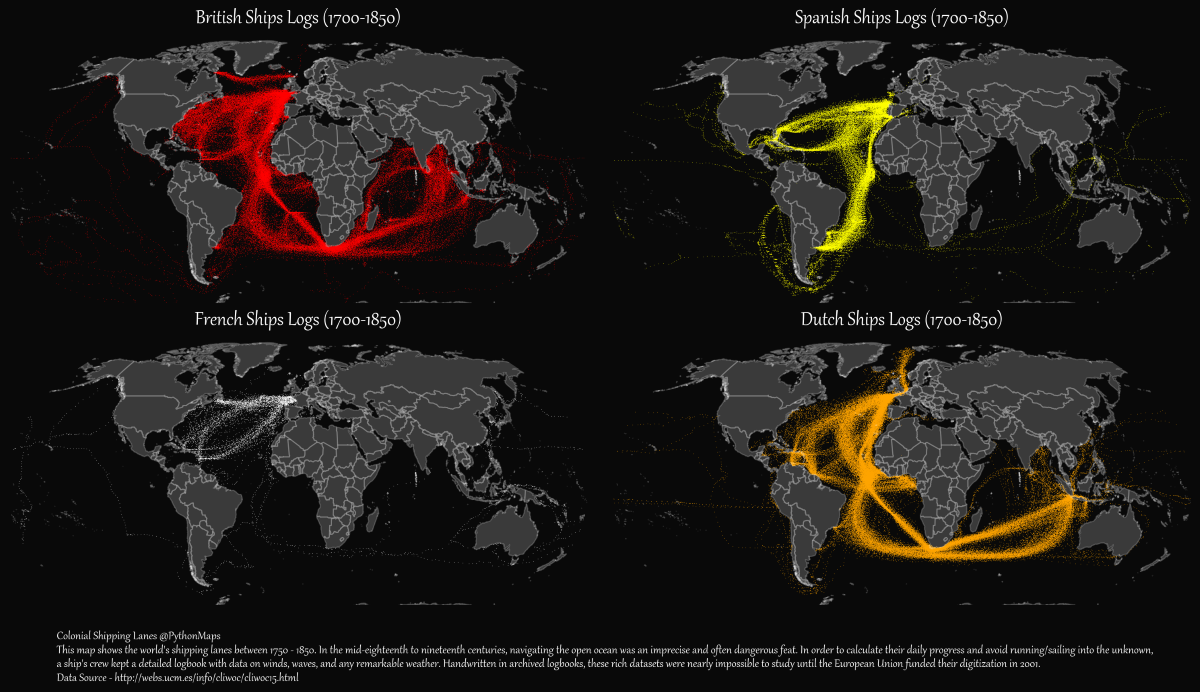
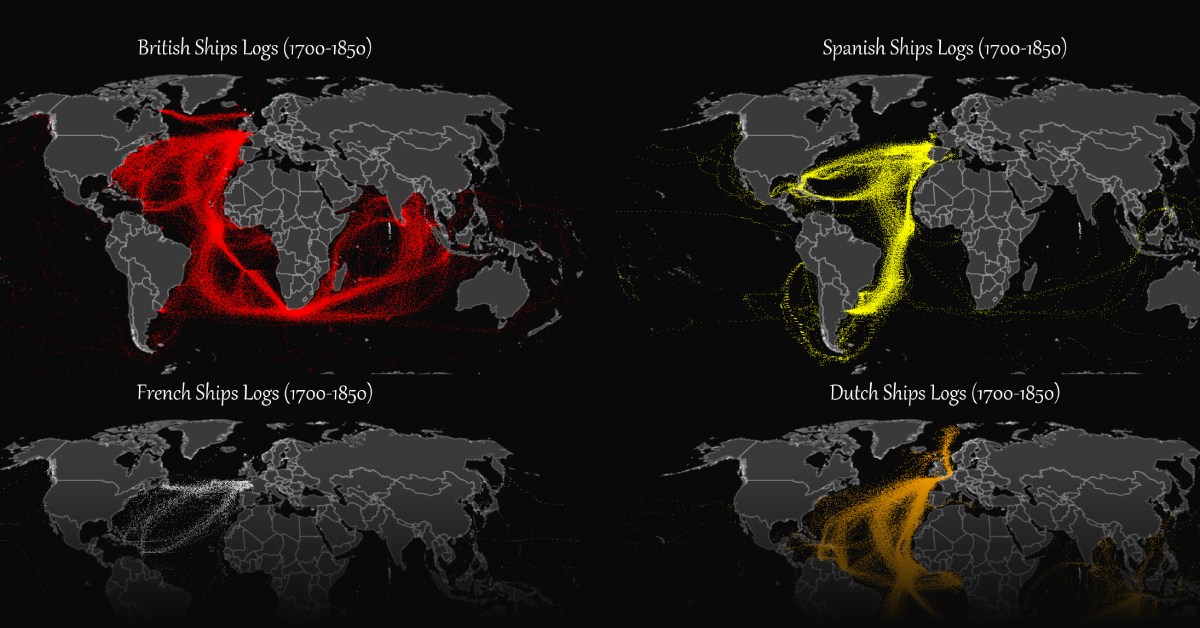
European Colonial Shipping Lanes (1700‒1850)
Every year, thousands of ships ferry passengers and transport goods across the world’s oceans and seas.
200 years ago, the ships navigating these waters looked very different. Explorers and traders sailed from coast to coast to expand colonial empires, find personal riches, or both.
Before modern technology simplified bookkeeping, many ships kept detailed logbooks to navigate, tracking the winds, waves, and any remarkable weather. Recently, these handwritten logbooks were fully digitized into the CLIWOC database as part of a UN-funded project by the University of Madrid.
In this graphic, Adam Symington uses this database to visualize the British, French, Spanish, and Dutch shipping routes between 1700 and 1850.
Colonial Shipping Lanes
In the 18th and 19th centuries, the British, French, Spanish, and Dutch empires dominated global trade through their colonial shipping lanes.
All four nations sailed across the Atlantic Ocean with some frequency over that timeframe, but these fleets were also very active in the Pacific and Indian Oceans as well.
The table below reflects the record of days spent by digitized logbooks from each nation.
| Country | N. Atlantic | S. Atlantic | Indian Ocean | Pacific | All Oceans |
|---|---|---|---|---|---|
| 🇪🇸 Spain | 28,635 | 11,812 | 620 | 1,703 | 42,770 |
| 🇬🇧 U.K. | 40,873 | 17,732 | 23,106 | 1,481 | 83,192 |
| 🇳🇱 Netherlands | 51,977 | 23,457 | 31,759 | 1,481 | 108,674 |
| 🇫🇷 France | 3,930 | 186 | 205 | 896 | 5,217 |
| Total | 125,415 | 53,187 | 55,690 | 5,561 | 239,853 |
Does this mean that the Netherlands had the widest colonial reach at the time? Not at all, as researchers noted that there were thousands of logbooks from each country that weren’t able to be digitized, and thousands more that were lost to time. The days simply reflect the amount of data that was available to examine from each country.
But they can still give us an accurate look at critical shipping routes between European countries, their trade partners, and their colonies and territories.
Let’s now take a closer look at the colonial powers and their preferred routes.
The British
The British shipping map shows a steady presence across the Atlantic and the Indian Ocean. They utilized many of Europe’s ports for ease of trade, with strong pre-independence connections to the U.S., Canada, and India.
One of the most frequented shipping routes on the map seen is a triangular trade route that enabled the trans-Atlantic slave trade. This route facilitated the transportation of slaves from Africa to the Americas, raw materials such as sugar, tobacco, and cotton from the American colonies to Europe, and arms, textiles, and wine from Europe to the colonies.
The Spanish
During this period, Spanish maritime trade with its colonies was an essential economic component of the Kingdom of Spain (as with other colonial empires).
We can see the largest concentration of Spanish ships around Central and South America leading up to the Spanish American wars of independence, as those colonies were especially important suppliers of raw materials such as gold, silver, sugar, tobacco, and cotton. There are some lanes visible to Pacific colonies like the Philippines.
The French
Of the four empires, France’s maritime logbooks were the most sparse. The records that were digitized show frequent travel and trade across the North Atlantic Ocean to Canada and the Caribbean.
The French empire at the time included colonies in the Caribbean, Indian Ocean, and West Africa. Their trade routes were used to transport goods like sugar, coffee, rum, and spices, while also relying on the slave trade to maintain plantation economies. The French colony of Saint-Domingue (now Haiti) was one of the world’s wealthiest colonies in the late 18th century.
The Dutch
Dutch shipping routes from the time had the most detail and breadth of any country, reflective of the Dutch East India Trading Company’s position as the world’s dominant company and trade force.
These include massive traffic to the Dutch East Indies (now Indonesia), Cape Colony (now South Africa), and the Guianas in South America.
Interestingly, researchers from Leiden University found that the Dutch empire was a “string of pearls” consisting mostly of strategic trading hubs stretched along the edges of the continents and focused on maritime power.

This article was published as a part of Visual Capitalist's Creator Program, which features data-driven visuals from some of our favorite Creators around the world.


Crime
Mapped: The Safest Cities in the U.S.
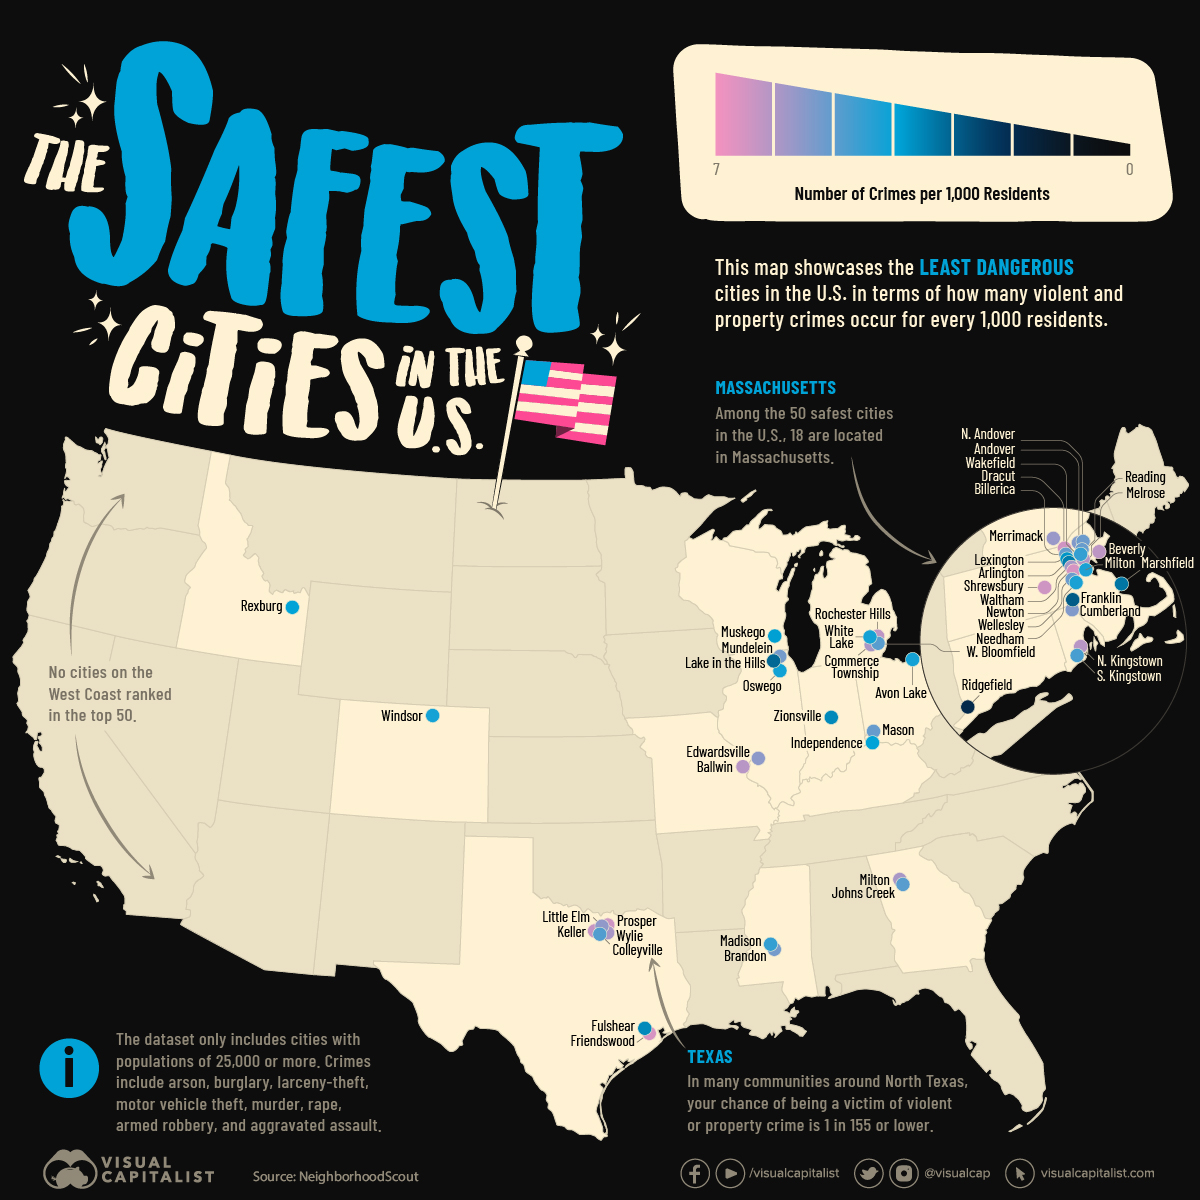
How safe is small town America? This map reveals the safest cities in the U.S. in terms of the total crime rate per every 1,000 residents.
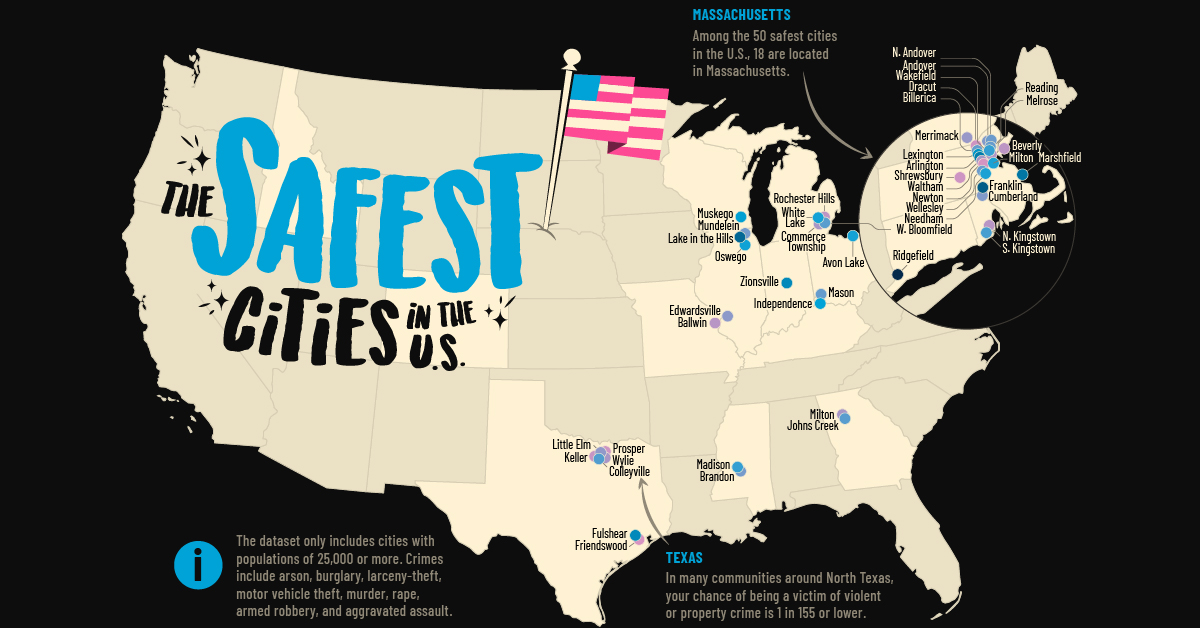
Mapped: The Safest Cities in America
The phrase “small town America” often conjures up images of white picket fences, well-trimmed lawns, and big houses. But how safe is modern-day suburbia in America?
Some of the smallest places in the country can actually be among the most dangerous. Take for example Bessemer, Alabama, with a population of around 26,000 and a violent crime rate of 33.1 per every 1,000 residents.
That said, there are many small cities that are true havens for families across the United States. This map showcases the safest cities in the U.S., using FBI data and Census Bureau populations compiled by NeighborhoodScout in 2023.
Note: The source only considered cities with a population of 25,000 or higher. This report is based on total index crimes reported in each city, which includes arson, burglary, larceny-theft, motor vehicle theft, murder, rape, armed robbery, and aggravated assault.
Top 100 Safest Cities in the U.S.
40% of the cities in the ranking are located in Northeastern states, which are typically rated the “safest” based on FBI data.
Here’s a closer look at the full list:
| Rank | City | State | Total Crime Rate(per 1,000 residents) | Chance of Beinga Victim |
|---|---|---|---|---|
| 1 | Ridgefield | Connecticut | 1.9 | 1 in 510 |
| 2 | Franklin | Massachusetts | 2.9 | 1 in 344 |
| 3 | Lake in the Hills | Illinois | 3.1 | 1 in 321 |
| 4 | Marshfield | Massachusetts | 3.3 | 1 in 300 |
| 5 | Arlington | Massachusetts | 3.4 | 1 in 292 |
| 6 | Fulshear | Texas | 3.6 | 1 in 276 |
| 7 | Zionsville | Indiana | 3.6 | 1 in 275 |
| 8 | Lexington | Massachusetts | 3.7 | 1 in 270 |
| 9 | Muskego | Wisconsin | 3.8 | 1 in 265 |
| 10 | Rexburg | Idaho | 3.9 | 1 in 253 |
| 11 | Independence | Kentucky | 3.9 | 1 in 253 |
| 12 | Oswego | Illinois | 4.1 | 1 in 238 |
| 13 | Milton | Massachusetts | 4.2 | 1 in 233 |
| 14 | Needham | Massachusetts | 4.2 | 1 in 233 |
| 15 | White Lake | Michigan | 4.2 | 1 in 233 |
| 16 | Avon Lake | Ohio | 4.3 | 1 in 232 |
| 17 | Madison | Mississippi | 4.5 | 1 in 221 |
| 18 | Wakefield | Massachusetts | 4.5 | 1 in 218 |
| 19 | Windsor | Colorado | 4.5 | 1 in 218 |
| 20 | South Kingstown | Rhode Island | 4.7 | 1 in 212 |
| 21 | Colleyville | Texas | 4.8 | 1 in 206 |
| 22 | West Bloomfield | Michigan | 4.9 | 1 in 204 |
| 23 | Johns Creek | Georgia | 4.9 | 1 in 202 |
| 24 | Billerica | Massachusetts | 5.1 | 1 in 195 |
| 25 | Mason | Ohio | 5.1 | 1 in 192 |
| 26 | Reading | Massachusetts | 5.1 | 1 in 192 |
| 27 | North Andover | Massachusetts | 5.2 | 1 in 190 |
| 28 | Wellesley | Massachusetts | 5.2 | 1 in 189 |
| 29 | Mundelein | Illinois | 5.3 | 1 in 187 |
| 30 | Brandon | Mississippi | 5.3 | 1 in 186 |
| 31 | Cumberland | Rhode Island | 5.4 | 1 in 184 |
| 32 | Andover | Massachusetts | 5.4 | 1 in 182 |
| 33 | Edwardsville | Illinois | 5.5 | 1 in 178 |
| 34 | Little Elm | Texas | 5.6 | 1 in 176 |
| 35 | Merrimack | New Hampshire | 5.7 | 1 in 172 |
| 36 | Waltham | Massachusetts | 5.8 | 1 in 169 |
| 37 | Wylie | Texas | 5.9 | 1 in 169 |
| 38 | Commerce Township | Michigan | 5.9 | 1 in 169 |
| 39 | Milton | Georgia | 5.9 | 1 in 167 |
| 40 | Melrose | Massachusetts | 6.0 | 1 in 164 |
| 41 | Ballwin | Missouri | 6.1 | 1 in 162 |
| 42 | North Kingstown | Rhode Island | 6.1 | 1 in 162 |
| 43 | Beverly | Massachusetts | 6.2 | 1 in 161 |
| 44 | Rochester Hills | Michigan | 6.2 | 1 in 160 |
| 45 | Keller | Texas | 6.3 | 1 in 158 |
| 46 | Shrewsbury | Massachusetts | 6.4 | 1 in 156 |
| 47 | Dracut | Massachusetts | 6.4 | 1 in 155 |
| 48 | Prosper | Texas | 6.4 | 1 in 155 |
| 49 | Newton | Massachusetts | 6.5 | 1 in 152 |
| 50 | Friendswood | Texas | 6.5 | 1 in 152 |
| 51 | McHenry | Illinois | 6.5 | 1 in 152 |
| 52 | Fort Mill | South Carolina | 6.6 | 1 in 151 |
| 53 | Wallingford | Connecticut | 6.8 | 1 in 146 |
| 54 | Caledonia | Wisconsin | 6.9 | 1 in 144 |
| 55 | Belmont | Massachusetts | 6.9 | 1 in 144 |
| 56 | De Pere | Wisconsin | 6.9 | 1 in 143 |
| 57 | Flower Mound | Texas | 7.0 | 1 in 142 |
| 58 | Easton | Massachusetts | 7.0 | 1 in 141 |
| 59 | Highland Park | Illinois | 7.0 | 1 in 141 |
| 60 | Carmel | Indiana | 7.2 | 1 in 138 |
| 61 | Sachse | Texas | 7.2 | 1 in 138 |
| 62 | Algonquin | Illinois | 7.2 | 1 in 137 |
| 63 | Hendersonville | Tennessee | 7.2 | 1 in 137 |
| 64 | San Luis | Arizona | 7.3 | 1 in 136 |
| 65 | Fishers | Indiana | 7.3 | 1 in 135 |
| 66 | Perrysburg | Ohio | 7.4 | 1 in 135 |
| 67 | Lake Stevens | Washington | 7.4 | 1 in 134 |
| 68 | Cheshire | Connecticut | 7.4 | 1 in 134 |
| 69 | Milford | Massachusetts | 7.5 | 1 in 132 |
| 70 | Saratoga Springs | Utah | 7.5 | 1 in 132 |
| 71 | Bella Vista | Arkansas | 7.5 | 1 in 132 |
| 72 | Princeton | New Jersey | 7.5 | 1 in 131 |
| 73 | Bluffton | South Carolina | 7.6 | 1 in 130 |
| 74 | Novi | Michigan | 7.6 | 1 in 130 |
| 75 | Chelmsford | Massachusetts | 7.6 | 1 in 130 |
| 76 | Amherst | Massachusetts | 7.7 | 1 in 129 |
| 77 | Rosemount | Minnesota | 7.7 | 1 in 129 |
| 78 | Gloucester | Massachusetts | 7.7 | 1 in 129 |
| 79 | Syracuse | Utah | 7.8 | 1 in 127 |
| 80 | Waukee | Iowa | 7.8 | 1 in 126 |
| 81 | Mequon | Wisconsin | 7.9 | 1 in 126 |
| 82 | Westfield | Indiana | 7.9 | 1 in 126 |
| 83 | Spring Hill | Tennessee | 7.9 | 1 in 126 |
| 84 | Upper Arlington | Ohio | 7.9 | 1 in 126 |
| 85 | Rahway | New Jersey | 7.9 | 1 in 125 |
| 86 | Montclair | New Jersey | 7.9 | 1 in 125 |
| 87 | Greenwich | Connecticut | 8.0 | 1 in 125 |
| 88 | Hutto | Texas | 8.0 | 1 in 124 |
| 89 | Vestavia Hills | Alabama | 8.0 | 1 in 123 |
| 90 | Brownsburg | Indiana | 8.1 | 1 in 123 |
| 91 | Wilmette | Illinois | 8.1 | 1 in 123 |
| 92 | New Milford | Connecticut | 8.1 | 1 in 122 |
| 93 | Hilliard | Ohio | 8.2 | 1 in 120 |
| 94 | Royal Oak | Michigan | 8.2 | 1 in 120 |
| 95 | Derry | New Hampshire | 8.3 | 1 in 121 |
| 96 | Dublin | Ohio | 8.3 | 1 in 120 |
| 97 | West Warwick | Rhode Island | 8.5 | 1 in 116 |
| 98 | Watertown | Massachusetts | 8.5 | 1 in 116 |
| 99 | Walpole | Massachusetts | 8.6 | 1 in 115 |
| 100 | Kaysville | Utah | 8.6 | 1 in 115 |
One quarter of the safest cities are located in Massachusetts, with the vast majority clustered around Boston.
The median population of the cities and towns in the top 100 is just 32,000, and few widely-recognized cities make the list. Carmel, Indiana (#60) is the only city with a population above 100,000 to make the rankings. This would seem to follow the logic that bigger cities are more dangerous, but our map covering the most dangerous cities in America shows that many small cities were just as dangerous, and some even more.
Regardless, small towns can truly be idyllic. For example, a person’s chance of falling victim to crime in Ridgefield, Connecticut, the safest ranked city in the U.S., is just 1-in-510. That’s an overall rate of fewer than two incidents of crime per every 1,000 residents.
One surprising observation from the data is that many of the safest U.S. cities are in very close proximity to some of the most dangerous.
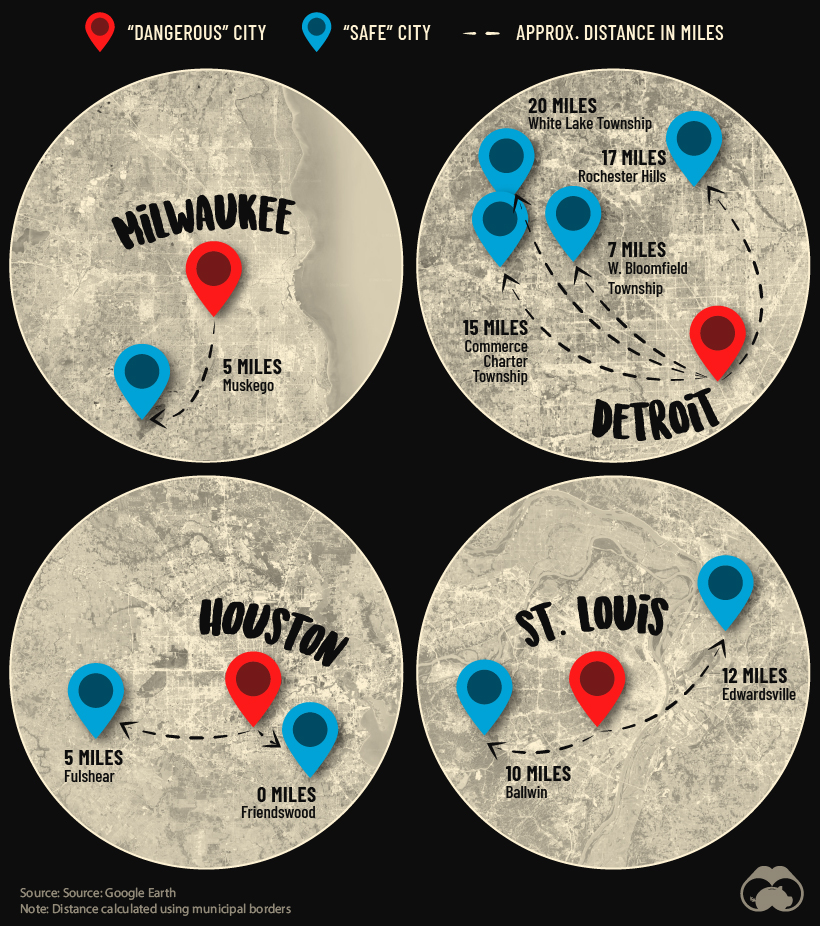
One example that illustrates this is Detroit, which ranks as the sixth most dangerous city in America. Despite this, as shown on the map above, there are four communities nearby that have some of the lowest crime rates in America.
In other words, America’s metro areas contain much contrast, and these insights provide valuable information for individuals and families seeking secure places to live across the country.

-

 Environment5 days ago
Hotter Than Ever: 2023 Sets New Global Temperature Records
-

 Datastream4 weeks ago
Can You Calculate Your Daily Carbon Footprint?
-

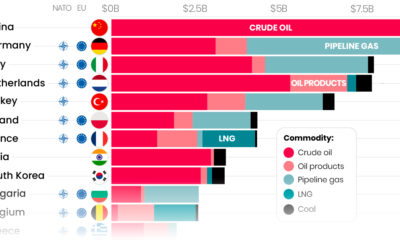
 Energy2 weeks ago
Who’s Still Buying Russian Fossil Fuels in 2023?
-

 VC+4 days ago
What’s New on VC+ in July
-

 Investor Education4 weeks ago
Visualizing BlackRock’s Top Equity Holdings
-

 Technology2 weeks ago
Meet the Competing Apps Battling for Twitter’s Market Share
-

 Public Opinion15 hours ago
How Do Chinese Citizens Feel About Other Countries?
-

 Markets4 weeks ago
Visualizing Every Company on the S&P 500 Index