

This graphic describes new U.S. renewable energy installations by state along with nameplate capacity, planned to come online in 2023.
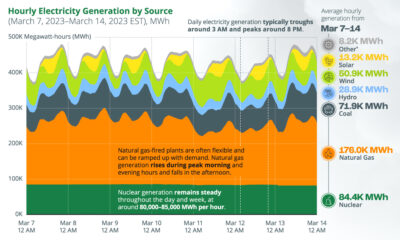

This chart tracks U.S. hourly electricity generation over one week, with various sources producing electricity at different times of the day.


A look at the flow of energy-related CO2 emissions from the sources that generate energy to the sectors that use it.
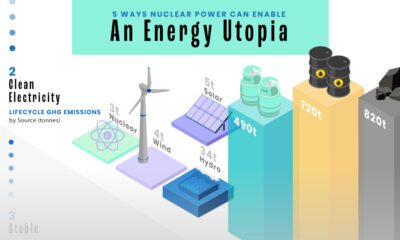

From clean electricity to high reliability, this graphic explores the five key advantages of nuclear power in the clean energy transition.


Asia is on its way to account for half of the world’s electricity generation by 2025. How is this growing demand currently being met?


As Europe and the EU shift away from fossil fuels, which energy sources are European countries depending on for their electricity generation?
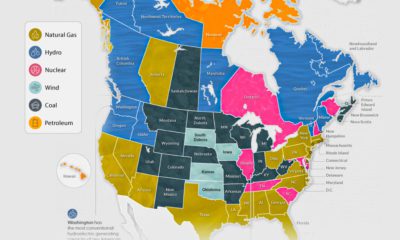

The U.S. and Canada rely on a different makeup of sources to generate their electricity. How does each state and province make theirs?
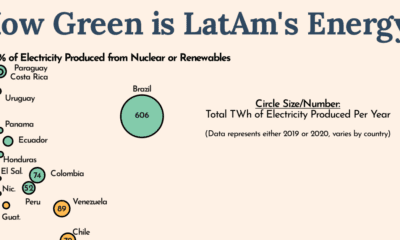

Countries around the world are looking to decarbonize, but Latin America is leading the charge in green energy usage.
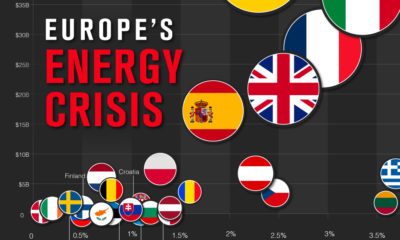

As European gas prices soar, countries are introducing policies to try and curb the energy crisis.
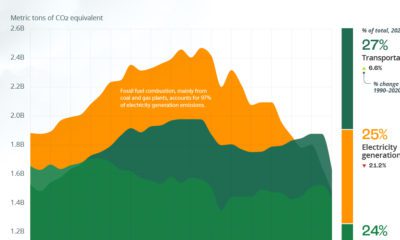

The U.S. emits about 6 billion metric tons of greenhouse gases a year. Here's how these emissions rank by sector.


 Creator Program