Demographics
The World Population in 2100, by Country


The World Population in 2100, by Country
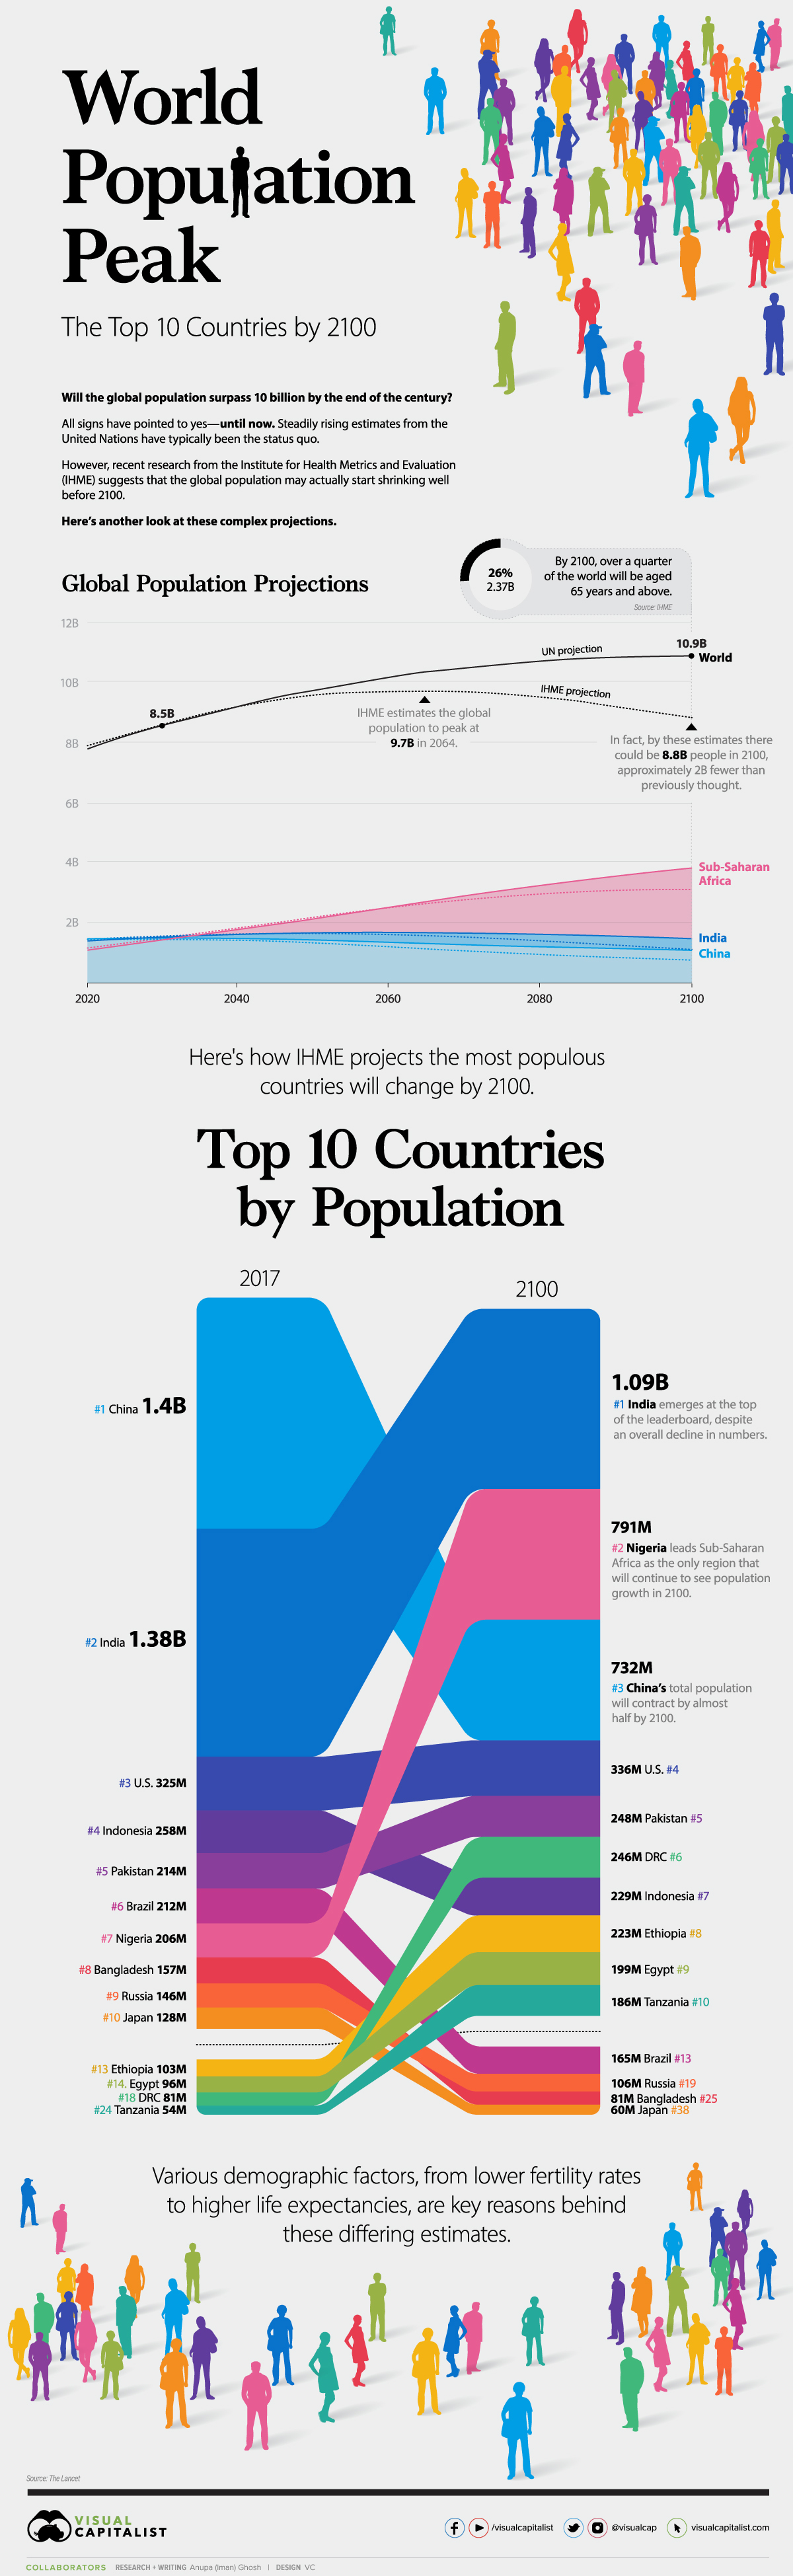
In 2015, the United Nations predicted that the global population could surpass 11 billion by the end of the century.
Last year, the UN revised these estimates, but the numbers it came up with were still well above 10 billion. These regular projections from the UN have been the status quo—until now.
Plenty of signs have pointed to there being a population plateau, but recent research from the Institute for Health Metrics and Evaluation (IHME), published in The Lancet, suggests that the number of people on this planet may actually start to shrink well before the year 2100.
Here’s a closer look at these complex projections.
UN vs. IHME Population Estimates
According to the UN, the world population is set to steadily rise over the years:
- 2030: 8.5 billion
- 2050: 9.7 billion
- 2100: 10.9 billion
In contrast, IHME paints a different picture. It projects the population to actually peak at 9.7 billion in 2064. Following this trajectory, there could be 8.8 billion people in 2100, approximately 2 billion fewer than previously thought.
Various demographic factors are behind these differences—higher life expectancies, migration rates, and lower fertility rates. For this last factor, independent drivers including contraceptive access and higher educational attainment were also considered.
A shifting age structure is also a key aspect of this transition. By 2100, over a quarter of the world or nearly 2.37 billion will be aged 65 years and above.
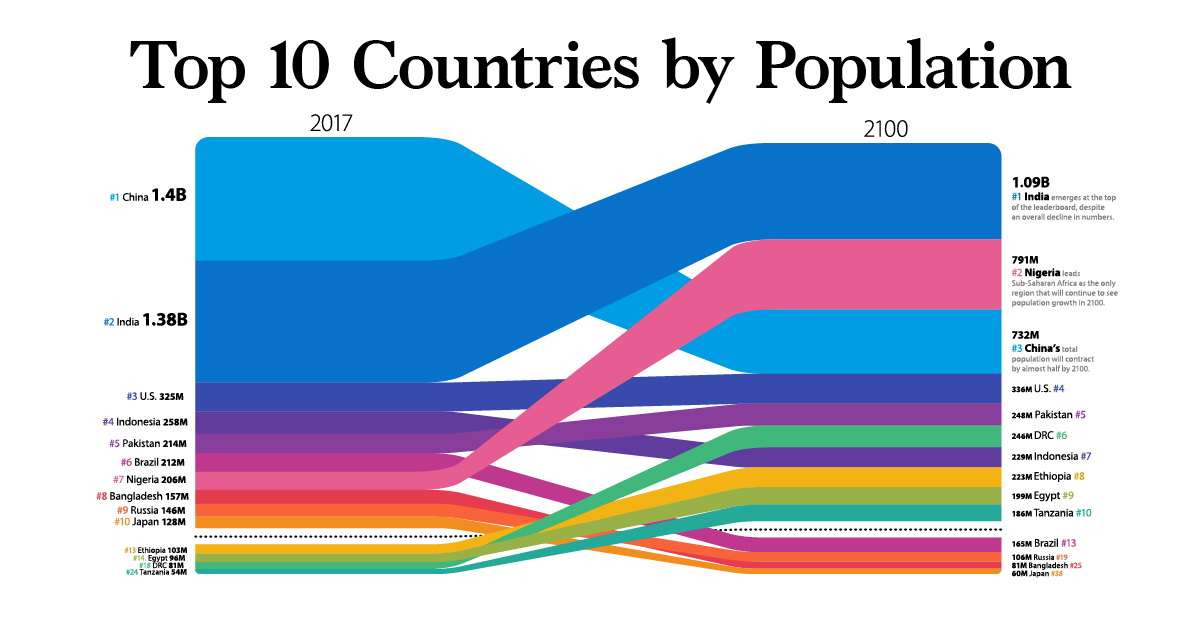
The Most Populous Countries in 2100
Amid all these demographic sea changes, which countries will come out on top?
Despite an overall decline in numbers to 1.09 billion people in 2100, India moves up from second to first place on the population leaderboard.
| Rank | Country | Population (2017) | Rank | Country | Population (2100E) |
|---|---|---|---|---|---|
| #1 | 🇨🇳 China | 1.4B | #1 | 🇮🇳 India | 1.09B |
| #2 | 🇮🇳 India | 1.38B | #2 | 🇳🇬 Nigeria | 791M |
| #3 | 🇺🇸 U.S. | 325M | #3 | 🇨🇳 China | 732M |
| #4 | 🇮🇩 Indonesia | 258M | #4 | 🇺🇸 U.S. | 336M |
| #5 | 🇵🇰 Pakistan | 214M | #5 | 🇵🇰 Pakistan | 248M |
| #6 | 🇧🇷 Brazil | 212M | #6 | 🇨🇩 DR Congo | 246M |
| #7 | 🇳🇬 Nigeria | 206M | #7 | 🇮🇩 Indonesia | 229M |
| #8 | 🇧🇩 Bangladesh | 157M | #8 | 🇪🇹 Ethiopia | 223M |
| #9 | 🇷🇺 Russia | 146M | #9 | 🇪🇬 Egypt | 199M |
| #10 | 🇯🇵 Japan | 128M | #10 | 🇹🇿 Tanzania | 186M |
The populations of both India and China will begin to contract after the mid-century—and it’s predicted that China’s total population will drop by almost half to 732 million by 2100.
Led by Nigeria, Sub-Saharan Africa is the only region that will continue to see growth by century’s end. In fact, four of the top 10 countries in the world in terms of population count will be located in Sub-Saharan Africa.
Tightly Packed Together
One final thing to consider is how population density may look in 2100, with many more people clustered in the same areas. For example, Nigeria is dealing with a land area nearly 11 times smaller than the U.S.—but it will have more than double the population.
| Country | 2100 Pop. | Area (Millions, km²/mi²) | Population Density per km² (mi²) |
|---|---|---|---|
| 🇳🇬 Nigeria | 791M | 0.92M km² (0.36M mi²) | 856.3 (2217.7) |
| 🇮🇳 India | 1.09B | 3.29M km² (1.27M mi²) | 331.6 (858.8) |
| 🇵🇰 Pakistan | 248M | 0.88M km² (0.34M mi²) | 281.2 (728.3) |
| 🇪🇹 Ethiopia | 223M | 1.10M km² (0.42M mi²) | 202.7 (531.0) |
| 🇪🇬 Egypt | 199M | 1.01M km² (0.39M mi²) | 197.0 (510.1) |
| 🇹🇿 Tanzania | 186M | 0.95M km² (0.37M mi²) | 196.3 (508.5) |
| 🇮🇩 Indonesia | 229M | 1.90M km² (0.74M mi²) | 120.2 (311.4) |
| 🇨🇩 DR Congo | 246M | 2.35M km² (0.91M mi²) | 104.9 (271.7) |
| 🇨🇳 China | 732M | 9.60M km² (3.70M mi²) | 76.3 (197.8) |
| 🇺🇸 U.S. | 336M | 9.83M km² (3.80M mi²) | 34.2 (88.5) |
Regardless of how the future population count shakes out, it’s clear that these heavyweight countries will undergo significant transformation in the coming decades.


Countries
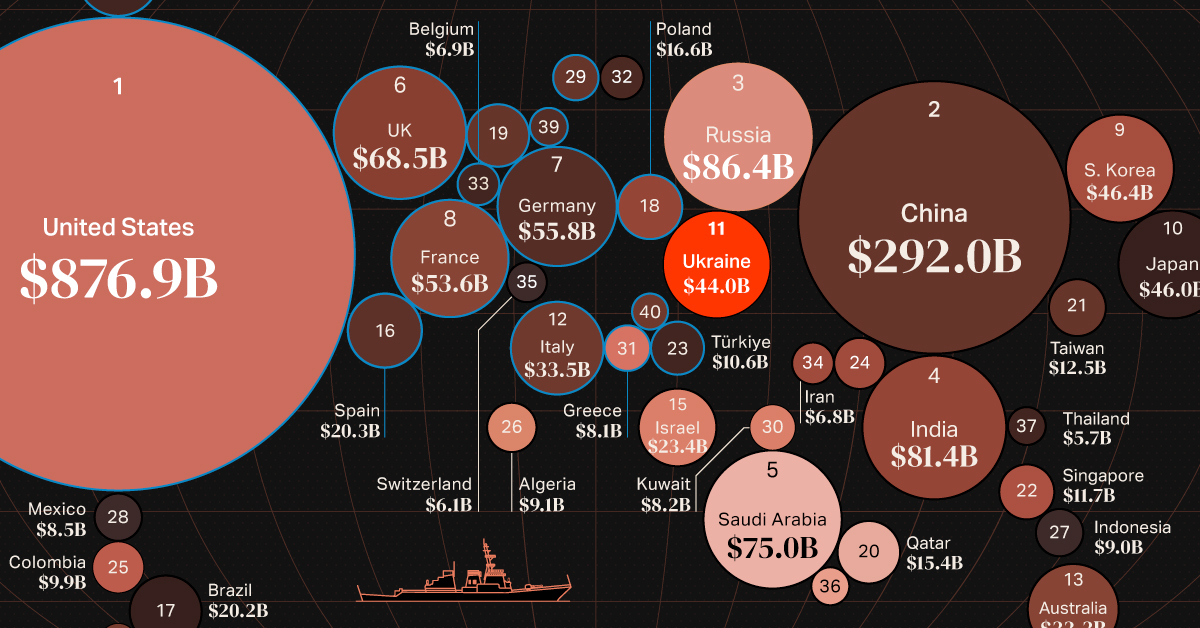
Mapped: World’s Top 40 Largest Military Budgets
War in Europe has caused Ukraine’s military spend to jump up by 640%. How do the world’s largest military budgets compare?
Mapped: World’s Top 40 Largest Military Budgets
In the final year of World War II, the U.S. spent about 38% of its GDP on its military. When adjusted for inflation, the military budget over those four years of war came to a staggering $4.1 trillion in 2020 dollars.
Almost 80 years later, modern day military spending isn’t much of a far cry from World War II budgets. The top spenders have continued to increase their military capabilities, while war in Ukraine has caused countries in the region to re-evaluate their budgets as well.
In 2022, global military budgets hit an all-time high of $2.2 trillion, according to data released by Stockholm International Peace Research Institute (SIPRI), the eighth consecutive year of increase. This post looks at the top 40 largest military budgets in the world.
The Largest Military Budgets in 2022
The United States accounts for almost 40% of global military expenditures, with its 2022 spend coming to $877 billion.
Here are the top 40 largest military budgets in the world for 2022 in U.S. dollars:
| Rank | Country | Military Budget (Billions) | % of World Military Spend |
|---|---|---|---|
| 1 | 🇺🇸 U.S. | $876.9 | 39.0% |
| 2 | 🇨🇳 China | $292.0 | 13.0% |
| 3 | 🇷🇺 Russia | $86.4 | 3.9% |
| 4 | 🇮🇳 India | $81.4 | 3.6% |
| 5 | 🇸🇦 Saudi Arabia | $75.0 | 3.3% |
| 6 | 🇬🇧 UK | $68.5 | 3.1% |
| 7 | 🇩🇪 Germany | $55.8 | 2.5% |
| 8 | 🇫🇷 France | $53.6 | 2.4% |
| 9 | 🇰🇷 South Korea | $46.4 | 2.1% |
| 10 | 🇯🇵 Japan | $46.0 | 2.1% |
| 11 | 🇺🇦 Ukraine | $44.0 | 2.0% |
| 12 | 🇮🇹 Italy | $33.5 | 1.5% |
| 13 | 🇦🇺 Australia | $32.3 | 1.4% |
| 14 | 🇨🇦 Canada | $26.9 | 1.2% |
| 15 | 🇮🇱 Israel | $23.4 | 1.0% |
| 16 | 🇪🇸 Spain | $20.3 | 0.9% |
| 17 | 🇧🇷 Brazil | $20.2 | 0.9% |
| 18 | 🇵🇱 Poland | $16.6 | 0.7% |
| 19 | 🇳🇱 Netherlands | $15.6 | 0.7% |
| 20 | 🇶🇦 Qatar | $15.4 | 0.7% |
| 21 | 🇹🇼 Taiwan | $12.5 | 0.6% |
| 22 | 🇸🇬 Singapore | $11.7 | 0.5% |
| 23 | 🇹🇷 Türkiye | $10.6 | 0.5% |
| 24 | 🇵🇰 Pakistan | $10.3 | 0.5% |
| 25 | 🇨🇴 Colombia | $9.9 | 0.4% |
| 26 | 🇩🇿 Algeria | $9.1 | 0.4% |
| 27 | 🇮🇩 Indonesia | $9.0 | 0.4% |
| 28 | 🇲🇽 Mexico | $8.5 | 0.4% |
| 29 | 🇳🇴 Norway | $8.4 | 0.4% |
| 30 | 🇰🇼 Kuwait | $8.2 | 0.4% |
| 31 | 🇬🇷 Greece | $8.1 | 0.4% |
| 32 | 🇸🇪 Sweden | $7.7 | 0.3% |
| 33 | 🇧🇪 Belgium | $6.9 | 0.3% |
| 34 | 🇮🇷 Iran | $6.8 | 0.3% |
| 35 | 🇨🇭 Switzerland | $6.1 | 0.3% |
| 36 | 🇴🇲 Oman | $5.8 | 0.3% |
| 37 | 🇹🇭 Thailand | $5.7 | 0.3% |
| 38 | 🇨🇱 Chile | $5.6 | 0.2% |
| 39 | 🇩🇰 Denmark | $5.5 | 0.2% |
| 40 | 🇷🇴 Romania | $5.2 | 0.2% |
China, ranked second in absolute terms, accounts for another 13% of world military expenditure at $292 billion.
Russia, India and Saudi Arabia round out the top five biggest military budgets in 2022. Add in the UK to the mix (#6 rank), and these countries all had military expenditures that made up at least 3% of global spend.
Comparatively, the lowest budgets on the top 40 ranged include Romania at $5.2 billion, Denmark at $5.5 billion, and Chile at $5.6 billion. They each account for just 0.2% of the world’s military budgets in 2022, and of course there are many countries with even smaller spends.
Largest Military Budget Increases in 2022
Russia’s position as the third-largest military spender is a recent development, as the country’s military spend had a 9% increase between 2021 and 2022, according to SIPRI estimates.
On the other side of Russia’s invasion, Ukraine was the top 40 military budget with the largest annual increase in 2022, surging nearly six and a half times above its 2021 expenditures.
| Country | % Change (2021-2022) | Rank Change (2021-2022) |
|---|---|---|
| 🇺🇦 Ukraine | 640% | +25 |
| 🇶🇦 Qatar | 27% | +2 |
| 🇸🇦 Saudi Arabia | 16% | +3 |
| 🇧🇪 Belgium | 13% | 0 |
| 🇳🇱 Netherlands | 12% | 0 |
| 🇸🇪 Sweden | 12% | -1 |
| 🇵🇱 Poland | 11% | 0 |
| 🇷🇺 Russia | 9.2% | +2 |
| 🇩🇰 Denmark | 8.8% | +3 |
| 🇪🇸 Spain | 7.3% | -1 |
| 🇳🇴 Norway | 6.2% | 0 |
| 🇮🇳 India | 6.0% | -1 |
| 🇯🇵 Japan | 5.9% | -1 |
| 🇮🇷 Iran | 4.6% | +5 |
| 🇨🇳 China | 4.2% | 0 |
| 🇬🇧 UK | 3.7% | -2 |
| 🇨🇦 Canada | 3.0% | -1 |
| 🇸🇬 Singapore | 2.8% | +1 |
| 🇩🇪 Germany | 2.3% | 0 |
| 🇮🇩 Indonesia | 1.3% | 0 |
| 🇨🇴 Colombia | 1.1% | -1 |
| 🇺🇸 U.S. | 0.7% | 0 |
| 🇫🇷 France | 0.6% | -2 |
| 🇬🇷 Greece | 0.6% | -1 |
| 🇨🇭 Switzerland | 0.4% | -1 |
| 🇹🇼 Taiwan | 0.4% | -1 |
| 🇦🇺 Australia | 0.3% | -1 |
| 🇵🇰 Pakistan | -2.0% | -3 |
| 🇰🇷 South Korea | -2.5% | +1 |
| 🇷🇴 Romania | -2.6% | +1 |
| 🇴🇲 Oman | -3.0% | +1 |
| 🇩🇿 Algeria | -3.7% | -1 |
| 🇮🇱 Israel | -4.2% | -1 |
| 🇮🇹 Italy | -4.5% | -1 |
| 🇨🇱 Chile | -6.2% | -3 |
| 🇧🇷 Brazil | -7.9% | -1 |
| 🇲🇽 Mexico | -9.7% | 0 |
| 🇰🇼 Kuwait | -11% | -4 |
| 🇹🇭 Thailand | -11% | -5 |
| 🇹🇷 Türkiye | -26% | -6 |
Ukraine’s dramatic increase represents the highest single-year jump ever recorded by SIPRI, painting a vivid before-and-after picture of a nation engaged in conflict.
Although no other country comes close in matching Ukraine’s surge in defense spending, Qatar saw a substantial increase of 27% over the last year, marking a continuing trend over the last decade of significantly bolstering its military.
Additionally, Saudi Arabia, along with four European nations (Belgium, the Netherlands, Sweden, and Poland), have registered year-over-year changes of over 10%.
On the flipside, 13 of the nations with the largest military budgets decreased spend from 2021, including top 15 spenders such as South Korea, Italy, and Israel.
The largest drop was seen by Türkiye, with an estimated 26% reduction in military budget. This drop may be linked to Türkiye’s inflation problem, which saw prices rise 72.3% in 2022—effectively decreasing the purchasing power of their currency in relative terms to other nations.
The Specter of War in Europe
With an ongoing conflict in the region and large financial powerhouses, its no surprise that eight of the top 10 countries with the most significant increases in military spending are located in Europe.
Consequently, European military budgets have reached levels not witnessed since the end of the Cold War.
And amid escalating geopolitical concerns, countries in Asia such as India, Japan, and China have also ramped up their defense spending. This is an indication of simmering global flashpoints such as India and China’s border skirmishes, the longstanding South China Sea territorial conflict, and concerns surrounding Taiwan’s sovereignty.
Source: Stockholm International Peace Research Institute (SIPRI).
Data note: SIPRI’s military expenditure data collection began in 1949, thus its records do not account for all expenditure that occurred during both World Wars.
Please see SIPRI’s methodologies page for more details on how they collect their data and create estimates.
-

 Environment5 days ago
Hotter Than Ever: 2023 Sets New Global Temperature Records
-

 Datastream4 weeks ago
Can You Calculate Your Daily Carbon Footprint?
-

 Energy2 weeks ago
Who’s Still Buying Russian Fossil Fuels in 2023?
-

 VC+5 days ago
What’s New on VC+ in July
-

 Stocks4 weeks ago
Visualizing BlackRock’s Top Equity Holdings
-

 Technology2 weeks ago
Meet the Competing Apps Battling for Twitter’s Market Share
-

 Politics18 hours ago
How Do Chinese Citizens Feel About Other Countries?
-

 Markets4 weeks ago
Visualizing Every Company on the S&P 500 Index