Markets
Mapped: The Top Export in Every Country
Click to view a larger version of this infographic
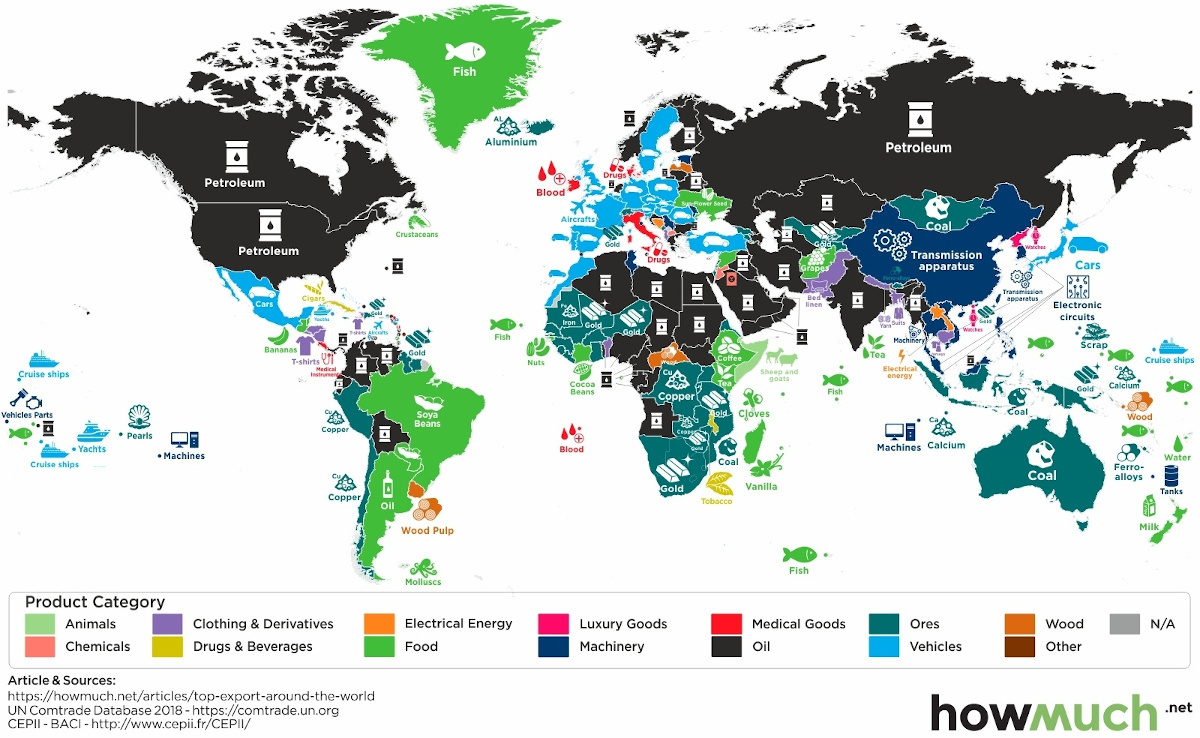
Mapped: The Top Export in Every Country
View the high resolution of this infographic by clicking here.
Today, exports make up roughly 25% of total global production.
One of the common influences on these exports, unsurprisingly, is oil. In fact, petroleum is the top export across over 50 nations, and along with many other resource-driven materials makes up a sizable share of the global export market. Since 2000, the total value of all exported global trade of goods and services has tripled to $19.5 trillion.
This infographic from HowMuch.net shows the top export in every country by value, according to the most recent global data from 2018.
Top Exports, by Region
Let’s dive into some particular regions, to see how top exports can vary:
Editor’s note: for even larger versions of each regional infographic below, visit HowMuch.net. All export data is from 2018 and comes from CEPII, a leading French center of economic analysis.
North America
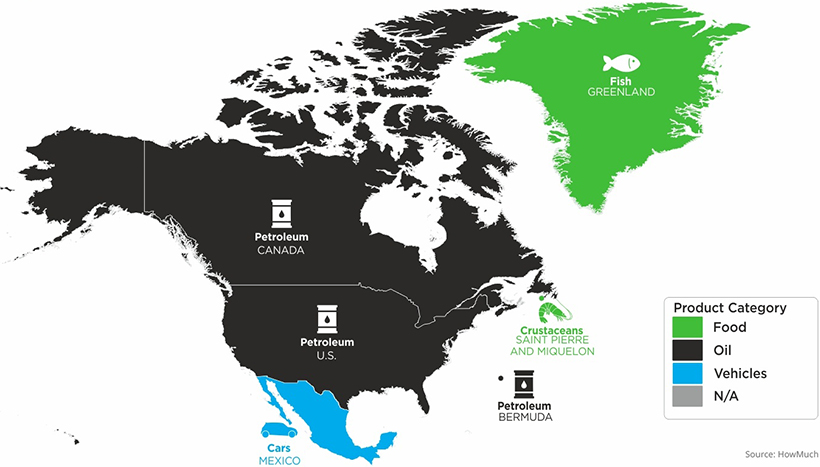
In the U.S. petroleum outpaces all other exports, with crude oil accounting for 35% of total petroleum exports. Canada too, lists petroleum at the top.
| Country | Top Export |
|---|---|
| Canada | Petroleum |
| Greenland | Fish |
| Mexico | Cars |
| Saint Pierre and Quelon | Crustaceans |
| U.S. | Petroleum |
With a market valued at $50.7 billion, Mexico’s top export is cars—making it the fourth largest exporter worldwide.
Africa
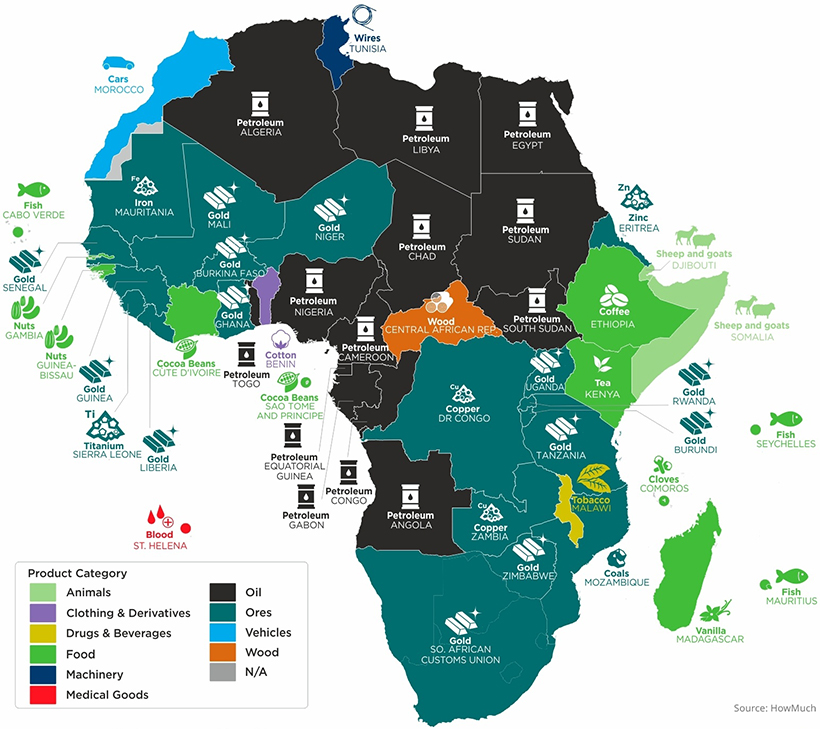
From Egypt to Senegal, Africa has a diverse spectrum of exports. Primarily, these are resource-driven, with the top five exports being petroleum, gold, diamonds, natural gas, and coal.
| Country | Top Export |
|---|---|
| Algeria | Petroleum |
| Angola | Petroleum |
| Benin | Cotton |
| Burkina Faso | Gold |
| Burundi | Gold |
| Cabo Verde | Fish |
| Cameroon | Petroleum |
| Central African Republic | Wood |
| Chad | Petroleum |
| Comoros | Cloves |
| Congo | Petroleum |
| Cote D'Ivoire | Cocoa Beans |
| Dijibouti | Sheep and goats |
| DR Congo | Copper |
| Egypt | Petroleum |
| Eritrea | Zinc |
| Ethiopia | Coffee |
| Gambia | Nuts |
| Ghana | Gold |
| Guinea | Gold |
| Guinea-Bissau | Nuts |
| Kenya | Tea |
| Liberia | Gold |
| Libya | Petroleum |
| Madagascar | Vanilla |
| Malawi | Tobacco |
| Mali | Gold |
| Mauritania | Iron |
| Mauritus | Fish |
| Morocco | Cars |
| Mozambique | Cloves |
| Niger | Gold |
| Nigeria | Petroleum |
| Rwanda | Gold |
| Senegal | Gold |
| Seychelles | Fish |
| Sierra Leone | Titanium |
| Somalia | Sheep and goats |
| South African Customs Union | Gold |
| South Sudan | Petroleum |
| St. Helena | Blood |
| Sudan | Petroleum |
| Tanzana | Gold |
| Togo | Petroleum |
| Tunisia | Wires |
| Uganda | Gold |
| Zambia | Copper |
| Zimbabwe | Gold |
Meanwhile, Ethiopia’s top export is coffee, shipping nearly $1 billion alone in 2018. Similarly, off the east coast, Madagascar is the world’s largest producer of vanilla.
Asia
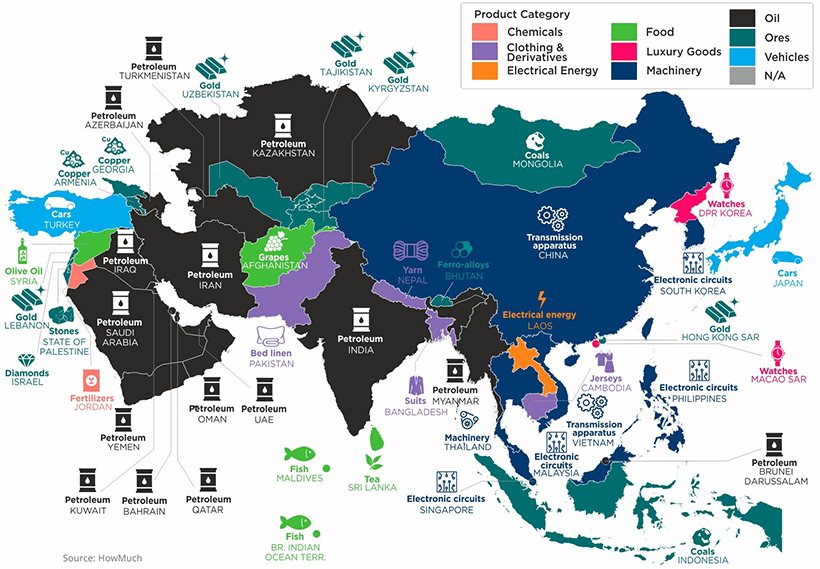
While petroleum is also a dominant export across many countries in Asia, the region’s export landscape is a lot more tech-focused.
In South Korea, electronic circuits are the largest export. Samsung, headquartered in Seoul, is a major supplier to Apple for multiple electronic components. With one of the highest export ratios in Asia, 40% of South Korea’s economic output is derived from its export market.
Here are the top exports across other Asian countries.
| Country | Top Export |
|---|---|
| Afghanistan | Grapes |
| Armenia | Copper |
| Azerbaijan | Petroleum |
| Bahrain | Petroleum |
| Bangladesh | Suits |
| Bhutan | Ferro-alloys |
| Br. Indian Ocean Terr. | Fish |
| Brunei Darussalam | Petroleum |
| Cambodia | Jerseys |
| China | Transmission apparatus |
| DPR Korea | Watches |
| Georgia | Copper |
| Hong Kong SAR | Gold |
| Indonesia | Coals |
| Iran | Petroleum |
| Iraq | Petroleum |
| Israel | Diamonds |
| Japan | Cars |
| Jordan | Fertilizers |
| Kazakhstan | Petroleum |
| Kuwait | Petroleum |
| Kyrgyzstan | Gold |
| Laos | Electrical energy |
| Lebanon | Gold |
| Macao SAR | Watches |
| Malaysia | Electronic circuits |
| Maldives | Fish |
| Mongolia | Coals |
| Myanmar | Petroleum |
| Nepal | Yarn |
| Oman | Petroleum |
| Pakistan | Bed linen |
| Philippines | Electronic circuits |
| Qatar | Petroleum |
| Saudi Arabia | Petroleum |
| Singapore | Electronic circuits |
| South Korea | Electronic circuits |
| Sri Lanka | Tea |
| State of Palestine | Stones |
| Syria | Olive oil |
| Tajikistan | Gold |
| Thailand | Machinery |
| Turkmenistan | Petroleum |
| Turkey | Cars |
| UAE | Petroleum |
| Uzbekistan | Gold |
| Vietnam | Transmission apparatus |
| Yemen | Petroleum |
In Afghanistan, grapes are the top export, valued at $237 million. Almost one-fifth of Afghanistan’s exports come from the grape industry.
Europe
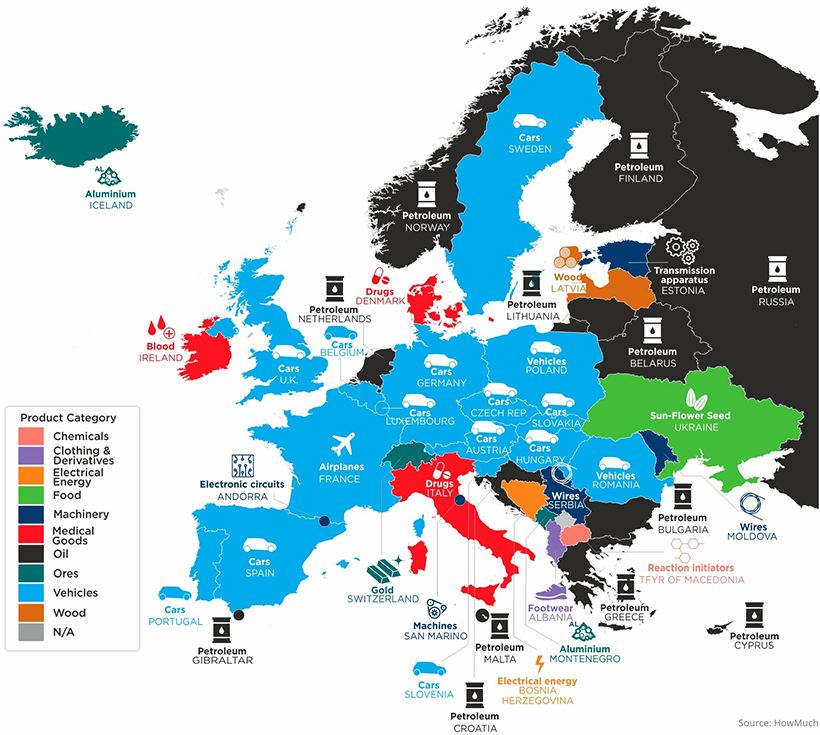
Across the European continent, the automotive industry stands out as a primary driver of exports, with 14 countries having cars or vehicles as their most exported good.
In fact, in 2019, the European Union exported a total of 5.6 million motor vehicles. Of these, 28% were shipped to the U.S. and 16.5% to China.
| Country | Top Export |
|---|---|
| Albania | Footwear |
| Andorra | Electronic circults |
| Austria | Cars |
| Belarus | Petroleum |
| Belgium | Cars |
| Bosnia Herzegovina | Electrical energy |
| Bulgaria | Petroleum |
| Croatia | Petroleum |
| Cyprus | Petroleum |
| Czech Republic | Cars |
| Denmark | Drugs |
| Estonia | Transmission apparatus |
| Finland | Petroleum |
| France | Airplanes |
| Germany | Cars |
| Gibraltar | Petroleum |
| Greece | Petroleum |
| Hungary | Cars |
| Iceland | Aluminium |
| Ireland | Blood |
| Italy | Drugs |
| Latvia | Wood |
| Lithuania | Petroleum |
| Luxembourg | Cars |
| Malta | Petroleum |
| Moldova | Wires |
| Montenegro | Aluminium |
| Netherlands | Petroleum |
| Norway | Petroleum |
| Poland | Vehicles |
| Portugal | Cars |
| Romania | Vehicles |
| Russia | Petroleum |
| San Marino | Machines |
| Serbia | Wires |
| Slovakia | Cars |
| Slovenia | Cars |
| Spain | Cars |
| Sweden | Cars |
| Switzerland | Gold |
| TFYR of Macedonia | Reaction initiators |
| U.K. | Cars |
| Ukraine | Sun-Flower Seed |
The Balkan nation of Albania has footwear as its top export. Overall, nearly 80% of the nation’s GDP relies on goods and services exports.
France, on the other hand, has airplanes as its highest export while Italy and Denmark’s highest are drugs. Italy is the top producer of pharmaceuticals in Europe, an industry which employs 66,500 across the country. Globally, it makes up 2.8% of pharmaceutical sales.
Due to its cheap electricity prices, companies have flocked to Iceland to produce aluminum. Iceland’s dams, which generate power from glacial water, produce electricity as much as 30% cheaper than in America.
Latin America & the Caribbean Islands
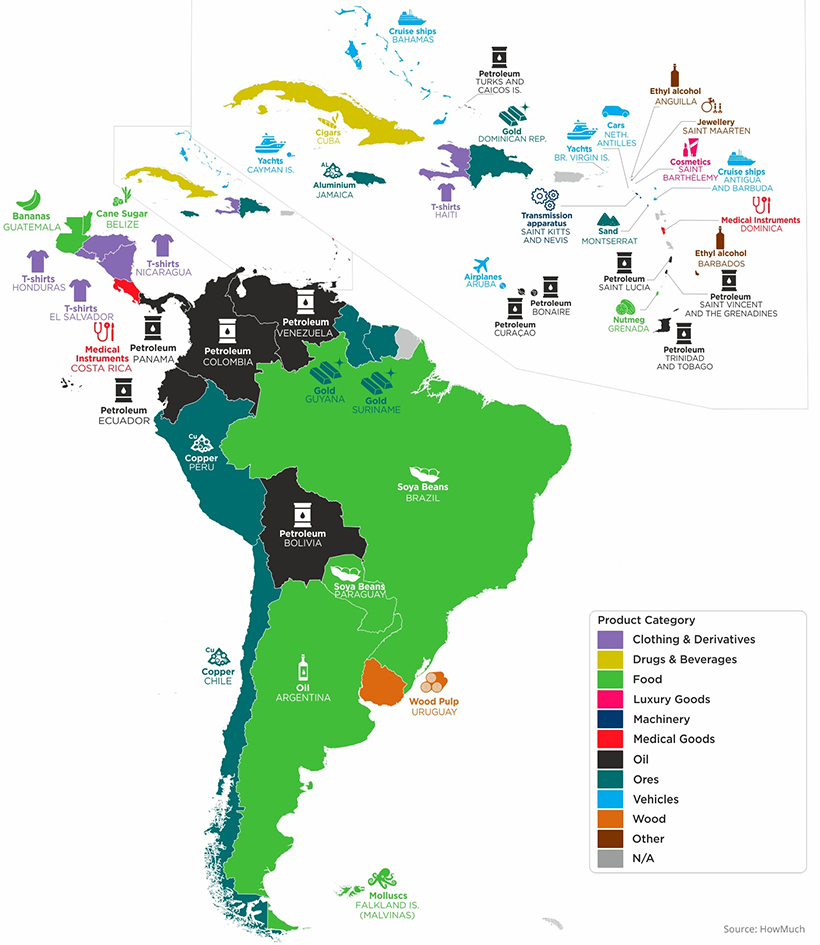
Like other regions, petroleum stands out as a key export in countries across Latin America.
Take Venezuela. With the largest oil reserves in the world, its oil exports were valued at $90 billion annually ten years ago. Since the pandemic, however, earnings are projected to reach just a fraction of this total—only $2.3 billion this year.
Along with this, the U.S. has imposed sanctions on president Nicolás Maduro and Venezuela’s state oil company, PDVSA, causing oil exports to slump to their lowest point in nearly 80 years.
| Country | Top Export |
|---|---|
| Anguilla | Ethyl alcohol |
| Antigua and Barbuda | Cruise ships |
| Argentina | Oil |
| Aruba | Airplanes |
| Bahamas | Cruise ships |
| Barbados | Ethyl alcohol |
| Belize | Cane sugar |
| Bolivia | Petroleum |
| Bonaire | Petroleum |
| Brazil | Soya beans |
| British Virgin Islands | Yachts |
| Cayman Islands | Yachts |
| Chile | Copper |
| Colombia | Petroleum |
| Costa Rica | Medical instruments |
| Cuba | Cigars |
| Curacao | Petroleum |
| Dominica | Medical instruments |
| Dominican Republic | Gold |
| Ecuador | Petroleum |
| El Salvador | T-shirts |
| Falkland Is. (Malvinas) | Molluscs |
| Grenada | Nutmeg |
| Guatemala | Bananas |
| Guyana | Gold |
| Haiti | T-shirts |
| Honduras | T-shirts |
| Jamaica | Aluminium |
| Montserrat | Sand |
| Neth. Antilles | Cars |
| Nicaragua | T-shirts |
| Panama | Petroleum |
| Paraguay | Soya beans |
| Peru | Copper |
| Saint Barthelemy | Cosmetics |
| Saint Kitts and Nevis | Transmission apparatus |
| Saint Lucia | Petroleum |
| Saint Maarten | Jewellery |
Saint Vincent and the Grenadines | Petroleum |
| Suriname | Gold |
| Trinidad and Tobago | Petroleum |
| Turks and Caicos Is. | Petroleum |
| Uruguay | Wood pulp |
| Venezuela | Petroleum |
For Caribbean nations, unsurprisingly, many top exports in this region are linked to tourism.
Cruise ships stood out as a primary export in the Bahamas, while yachts were most significant in the Cayman Islands. However, due to the pandemic, many of these national economies are at heightened risk, with some economies across the region projected to contract 10% in 2020.
Oceania
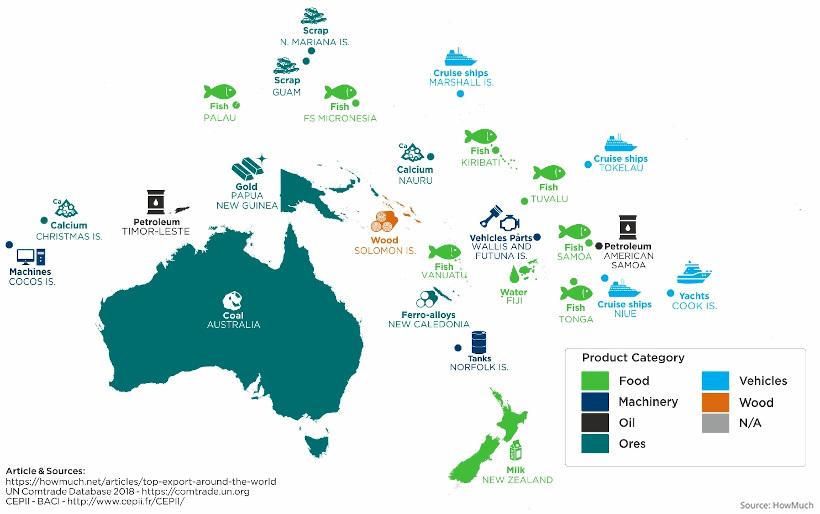
Finally, in Oceania, Australia had coal as it’s top export in 2018 (though it has since switched to iron ore in 2019), while New Zealand sends milk abroad.
For many of the smaller islands throughout the Pacific, it can be seen that fish, cruise ships, water, and yachts are key exports.
The Future of Trade
Now, COVID-19 and a host of other factors are changing the way the world trades. Unexpected shocks, trade wars, the carbon footprint, and labor standards are influencing firms to build more resilient supply chains.
According to The Economist, it’s estimated that over the next five years that 16-26% of exported goods production could shift locations.


Markets
The 50 Best One-Year Returns on the S&P 500 (1980-2022)
The highest one-year return among the top S&P 500 stocks from 1980 to 2022 was a staggering 2,620%. Which stocks top the ranks?

The Top S&P 500 Stocks by Annual Returns
The average annual return of the S&P 500 was 10% from 1980-2022, excluding dividends. Of course, there are some companies that deliver much higher returns in any given year.
In this graphic using data from S&P Dow Jones Indices, we explore the top S&P 500 stocks with the best single year returns over the last four decades.
Ranking the Top S&P 500 Stocks
In order to find the top gainers, S&P took the top 10 best-performing stocks each year and then narrowed that list down to the top 50 overall. They ranked the top S&P 500 stocks by price returns, meaning that no dividends or stock distributions were included.
The best gains were clustered in a few select years, including the 1999 dot-com boom, the 2003 stock market rally, and the 2009 recovery from the Global Financial Crisis. None of the biggest gains happened in 2021 or 2022.
| Rank | Company | Sector | Return | Year |
|---|---|---|---|---|
| 1 | Qualcomm | Information Technology | 2620% | 1999 |
| 2 | Tesla | Consumer Discretionary | 743% | 2020 |
| 3 | DSC Communications | Communication Services | 468% | 1992 |
| 4 | Coleco Industries | Consumer Discretionary | 435% | 1982 |
| 5 | Avaya | Information Technology | 428% | 2003 |
| 6 | Chrysler | Consumer Discretionary | 426% | 1982 |
| 7 | XL Capital (Axa XL) | Financials | 395% | 2009 |
| 8 | Tenet Healthcare | Healthcare | 369% | 2009 |
| 9 | Dynegy | Utilities | 361% | 2000 |
| 10 | Advanced Micro Devices | Information Technology | 348% | 2009 |
| 11 | Sprint | Communication Services | 343% | 1999 |
| 12 | Ford | Consumer Discretionary | 337% | 2009 |
| 13 | NEXTEL Communications | Communication Services | 336% | 1999 |
| 14 | LSI Logic | Information Technology | 319% | 1999 |
| 15 | NVIDIA | Information Technology | 308% | 2001 |
| 16 | Nortel Networks | Communication Services | 304% | 1999 |
| 17 | Etsy | Consumer Discretionary | 302% | 2020 |
| 18 | Genworth Financial | Financials | 301% | 2009 |
| 19 | Micron Technology | Information Technology | 300% | 2009 |
| 20 | NetFlix | Communication Services | 298% | 2013 |
| 21 | Oracle | Information Technology | 290% | 1999 |
| 22 | Western Digital | Information Technology | 286% | 2009 |
| 23 | Network Appliance (NetApp) | Information Technology | 270% | 1999 |
| 24 | Data General | Information Technology | 267% | 1991 |
| 25 | Yahoo | Communication Services | 265% | 1999 |
| 26 | Williams Companies | Energy | 264% | 2003 |
| 27 | Novell | Information Technology | 264% | 1991 |
| 28 | Dynegy | Utilities | 263% | 2003 |
| 29 | Sun Microsystems | Information Technology | 262% | 1999 |
| 30 | PMC-Sierra | Information Technology | 262% | 2003 |
| 31 | Advanced Micro Devices | Information Technology | 259% | 1991 |
| 32 | Dell | Information Technology | 248% | 1998 |
| 33 | Global Marine | Energy | 247% | 1980 |
| 34 | Micron Technology | Information Technology | 243% | 2013 |
| 35 | Best Buy | Consumer Discretionary | 237% | 2013 |
| 36 | Reebok | Consumer Discretionary | 234% | 2000 |
| 37 | Freeport-McMoRan | Materials | 229% | 2009 |
| 38 | Biomet (Zimmer Biomet) | Healthcare | 226% | 1991 |
| 39 | NVIDIA | Information Technology | 224% | 2016 |
| 40 | Gap | Consumer Discretionary | 223% | 1991 |
| 41 | NetFlix | Communication Services | 219% | 2010 |
| 42 | Fleetwood Enterprises (Fleetwood RV) | Consumer Discretionary | 217% | 1982 |
| 43 | National Semiconductor | Information Technology | 217% | 1999 |
| 44 | Dell | Information Technology | 216% | 1997 |
| 45 | Tandy Corp (RadioShack) | Information Technology | 216% | 1980 |
| 46 | Novell | Information Technology | 215% | 2003 |
| 47 | Corning | Information Technology | 215% | 2003 |
| 48 | CB Richard Ellis (CBRE) | Real Estate | 214% | 2009 |
| 49 | AES Corp | Utilities | 213% | 2003 |
| 50 | Expedia | Consumer Discretionary | 212% | 2009 |
Qualcomm was by far the top-performer in any one calendar year window. The company had key patents for Code Division Multiple Access (CDMA) technology, which enabled fast wireless internet access and became the basis for 3G networks.
Its stock took off in 1999 as it shed less profitable business lines, resolved a patent dispute with competitor Ericsson, and joined the S&P 500 Index. At the time, CNN reported that one lucky investor who heard about Qualcomm from an investment-banker-turned-rabbi earned $17 million—roughly $30 million in today’s dollars.
The most recent stocks to make the rankings were both from 2020: well-known Tesla (#2) and lesser-known online marketplace Etsy (#17), which saw sales from independent creators surge during the early COVID-19 pandemic. The dollar value of items sold on Etsy more than doubled from $5.3 billion in 2019 to $10.3 billion in 2020, with mask sales accounting for 7% of the total.
Biggest Gainers in Each Sector
While information technology stocks made up nearly half of the list, there is representation from nine of the 11 S&P 500 sectors. No companies from the Industrials or Consumer Staples sectors made it into the ranks of the top S&P 500 stocks by annual returns.
Below, we show the stock with the best annual return for each sector.

Tesla was the top-performing Consumer Discretionary stock on the list. After meeting the requirement of four consecutive quarters of positive earnings, it joined the S&P 500 Index on December 21, 2020. The company’s performance was boosted by the announcement that it would be included in the S&P 500, along with strong performance in China, and general EV buzz as environmental regulations tightened worldwide.
In the realm of Communication Services, DSC Communications saw a sizable return in 1992. The telecommunications equipment company had contracts with major companies such as Bell and Motorola. Alcatel-Lucent (then Alcatel), a French producer of mobile phones, purchased DSC Communications in 1998.
Serial Success Stories
It’s impressive to make the list of the top S&P 500 stocks by calendar returns once, but there are seven companies that have done it twice.
Some stocks saw their repeated outperformance close together, with Dell making the ranks back-to-back in 1997 and 1998.

On the other hand, a select few have more staying power. Computing giant NVIDIA topped the charts in 2001 and triumphed again 15 years later in 2016. And this year might be another win, as the company has recently reached a $1 trillion market capitalization and has the highest year-to-date return in the S&P 500 as of July 6, 2023.

-

 Markets2 weeks ago
Ranked: The Most Profitable U.S. Companies, by Sector
-

 Technology5 days ago
How Long it Took for Popular Apps to Reach 100 Million Users
-

 Markets4 weeks ago
The World’s Biggest Mutual Fund and ETF Providers
-

 Markets2 weeks ago
Brand Reputations: Ranking the Best and Worst in 2023
-

 Environment5 days ago
Hotter Than Ever: 2023 Sets New Global Temperature Records
-

 Datastream4 weeks ago
Can You Calculate Your Daily Carbon Footprint?
-

 Energy2 weeks ago
Who’s Still Buying Russian Fossil Fuels in 2023?
-

 VC+5 days ago
What’s New on VC+ in July