Inequality
Mapped: Minimum Wage Around the World
Mapped: Minimum Wage Around the World
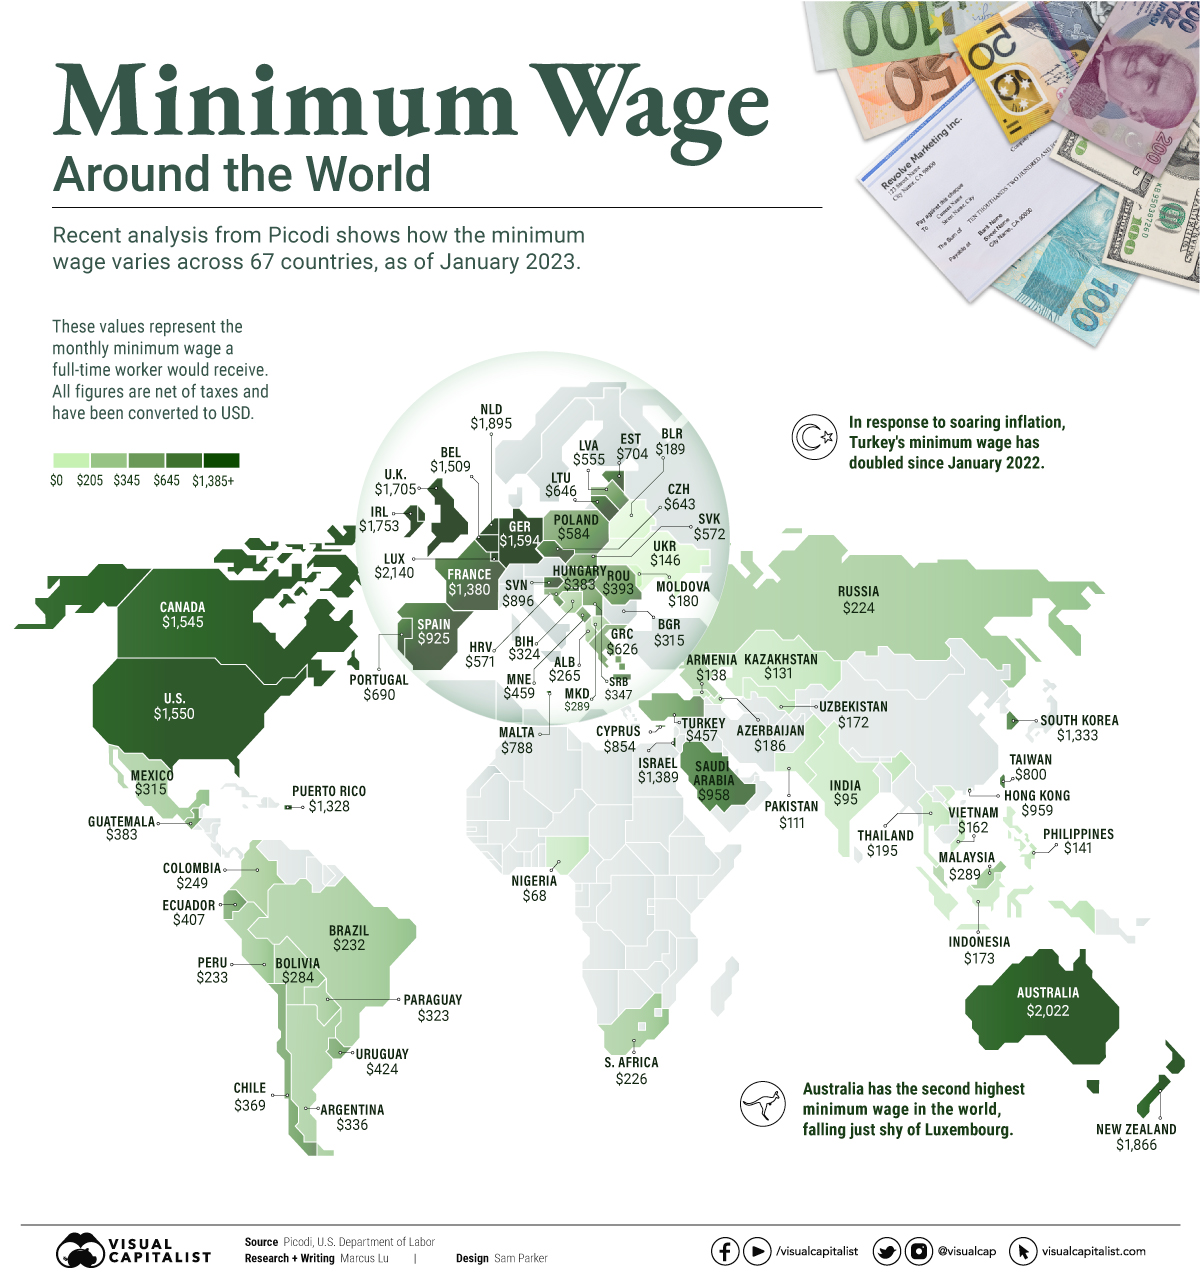
The purpose of a minimum wage is to establish a baseline income level for workers in a given jurisdiction. Ideally it’s enough to cover basic needs like food and housing, but this isn’t always a guarantee.
To see how the minimum wage differs around the world, we’ve visualized data from Picodi, which includes values for 67 countries as of January 2023.
Monthly Minimum Wage, by Country
The following table includes all of the data used in this infographic.
Each value represents the monthly minimum wage a full-time worker would receive in each country. Picodi states that these figures are net of taxes and have been converted to USD.
| Country | Increase compared to Jan 2022 | Minimum wage as of Jan 2023 (full-time, USD) |
|---|---|---|
| Argentina | 104.5% | $336 |
| Turkey | 100.0% | $457 |
| Moldova | 32.5% | $180 |
| Latvia | 27.1% | $555 |
| Malaysia | 25.8% | $289 |
| Pakistan | 24.6% | $111 |
| Romania | 24.5% | $393 |
| Germany | 21.9% | $1,594 |
| Belarus | 21.2% | $189 |
| Lithuania | 18.8% | $646 |
| North Macedonia | 18.5% | $298 |
| Mexico | 17.4% | $315 |
| Chile | 17.1% | $369 |
| Russia | 16.9% | $224 |
| Kazakhstan | 16.6% | $131 |
| Colombia | 16.4% | $249 |
| Hungary | 16.0% | $383 |
| Netherlands | 15.3% | $1,895 |
| Poland | 14.6% | $584 |
| Belgium | 14.3% | $1,509 |
| Serbia | 14.3% | $347 |
| Estonia | 14.2% | $704 |
| Azerbaijan | 14.2% | $186 |
| Albania | 13.3% | $265 |
| Slovenia | 12.9% | $896 |
| US | 12.6% | $1,550 |
| Croatia | 12.0% | $571 |
| Uzbekistan | 11.9% | $72 |
| Paraguay | 11.4% | $323 |
| Armenia | 11.4% | $138 |
| Peru | 10.3% | $233 |
| Bosnia and Herzegovina | 10.0% | $324 |
| Bulgaria | 9.9% | $315 |
| Luxembourg | 9.3% | $2,140 |
| Philippines | 9.2% | $141 |
| Uruguay | 9.0% | $424 |
| Brazil | 8.9% | $232 |
| India | 8.5% | $95 |
| Indonesia | 8.1% | $173 |
| Greece | 7.9% | $626 |
| Portugal | 7.8% | $690 |
| UK | 7.3% | $1,705 |
| Slovakia | 7.2% | $572 |
| South Africa | 6.9% | $226 |
| France | 6.6% | $1,380 |
| Czechia | 6.6% | $643 |
| Vietnam | 6.0% | $162 |
| Ecuador | 5.7% | $407 |
| New Zealand | 5.6% | $1,866 |
| Ireland | 5.4% | $1,753 |
| Canada | 5.1% | $1,545 |
| Thailand | 5.0% | $195 |
| Australia | 4.8% | $2,022 |
| South Korea | 4.7% | $1,333 |
| Taiwan | 4.6% | $800 |
| Bolivia | 4.0% | $284 |
| Guatemala | 3.9% | $383 |
| Malta | 3.6% | $788 |
| Ukraine | 3.1% | $146 |
| Israel | 0.0% | $1,389 |
| Puerto Rico | 0.0% | $1,328 |
| Hong Kong | 0.0% | $959 |
| Saudi Arabia | 0.0% | $958 |
| Spain | 0.0% | $925 |
| Montenegro | 0.0% | $459 |
| Nigeria | 0.0% | $68 |
| Cyprus | -- | $854 |
Generally speaking, developed countries have a higher cost of living, and thus require a higher minimum wage.
Two outliers in this dataset are Argentina and Turkey, which have increased their minimum wages by 100% or more from January 2022 levels.
Turkey is suffering from an ongoing currency crisis, with the lira losing over 40% of its value in 2021. Prices of basic goods have increased considerably as the Turkish lira continues to plummet. In fact, a 2022 survey found that 70% of people in Turkey were struggling to pay for food.
Argentina, South America’s second-biggest economy, is also suffering from very high inflation. In response, the country announced three minimum wage increases throughout 2022.
Minimum Wage in the U.S.
Within the U.S., minimum wage varies significantly by state. We’ve visualized each state’s basic minimum rate (hourly) using January 2023 data from the U.S. Department of Labor.

2023-03-17 Update: This map was updated to fix several incorrect values. We apologize for any confusion this may have caused.
America’s federal minimum wage has remained unchanged since 2009 at $7.25 per hour.
Each state is allowed to set their own minimum wage, as long as it’s higher than the federal minimum. In states that do not set their own minimum, the federal minimum applies.
If we assume someone works 40 hours a week, the federal minimum wage of $7.25 translates to an annual figure of just $15,080 before taxes. California’s minimum wage of $15.50 translates to $32,240 before taxes.
For further perspective, check out our 2022 infographic on the salary needed to buy a home across 50 U.S. cities.


Personal Finance
Where People Borrow Money From, by Country Income Level
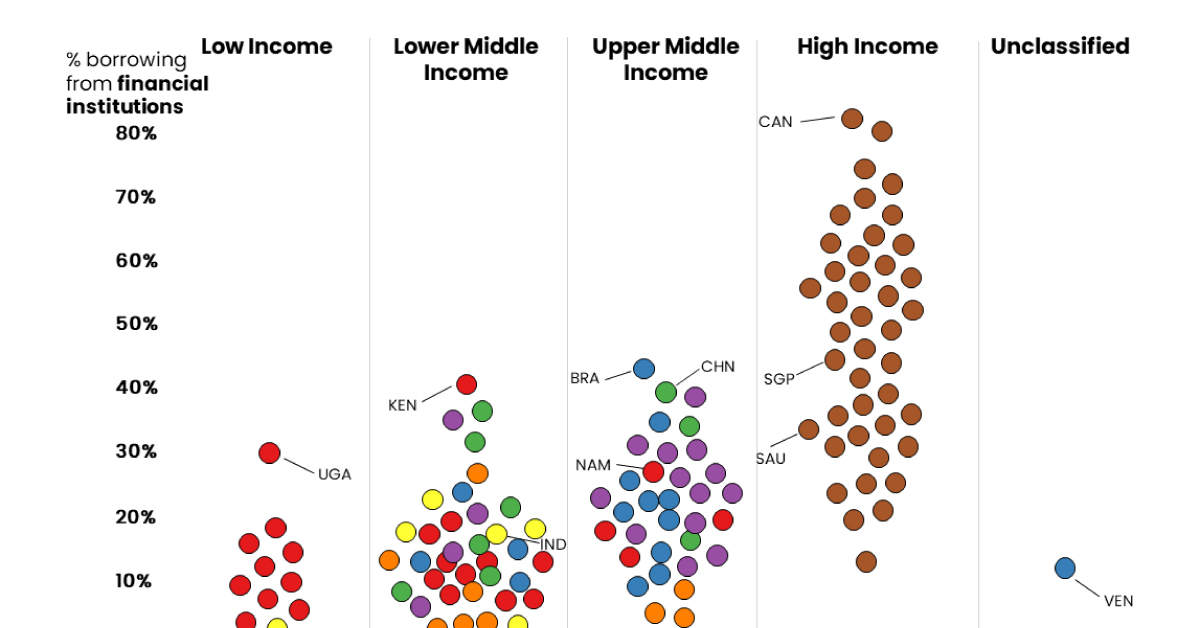
These graphics shed light on which people borrow money from financial institutions, and which rely on friends and family for monetary help.
 Creator Program
When making the decision to borrow money, do you turn to friends and family for financial help, or do you go to a financial institution like a bank or credit card company?
On a country-to-country basis, this choice often depends on a mix of various factors, including the availability of financial services, financial literacy, and the cultural approach to the very concept of lending itself.
In these graphics, Richie Lionell sheds some light on where people borrow money from, using the 2021 Global Findex Database published by the World Bank.
Borrowing From Financial Institutions
To compare borrowing practices across both location and income level, the dataset features survey results from respondents aged 15+ and groups countries by region except for high-income countries, which are grouped together.
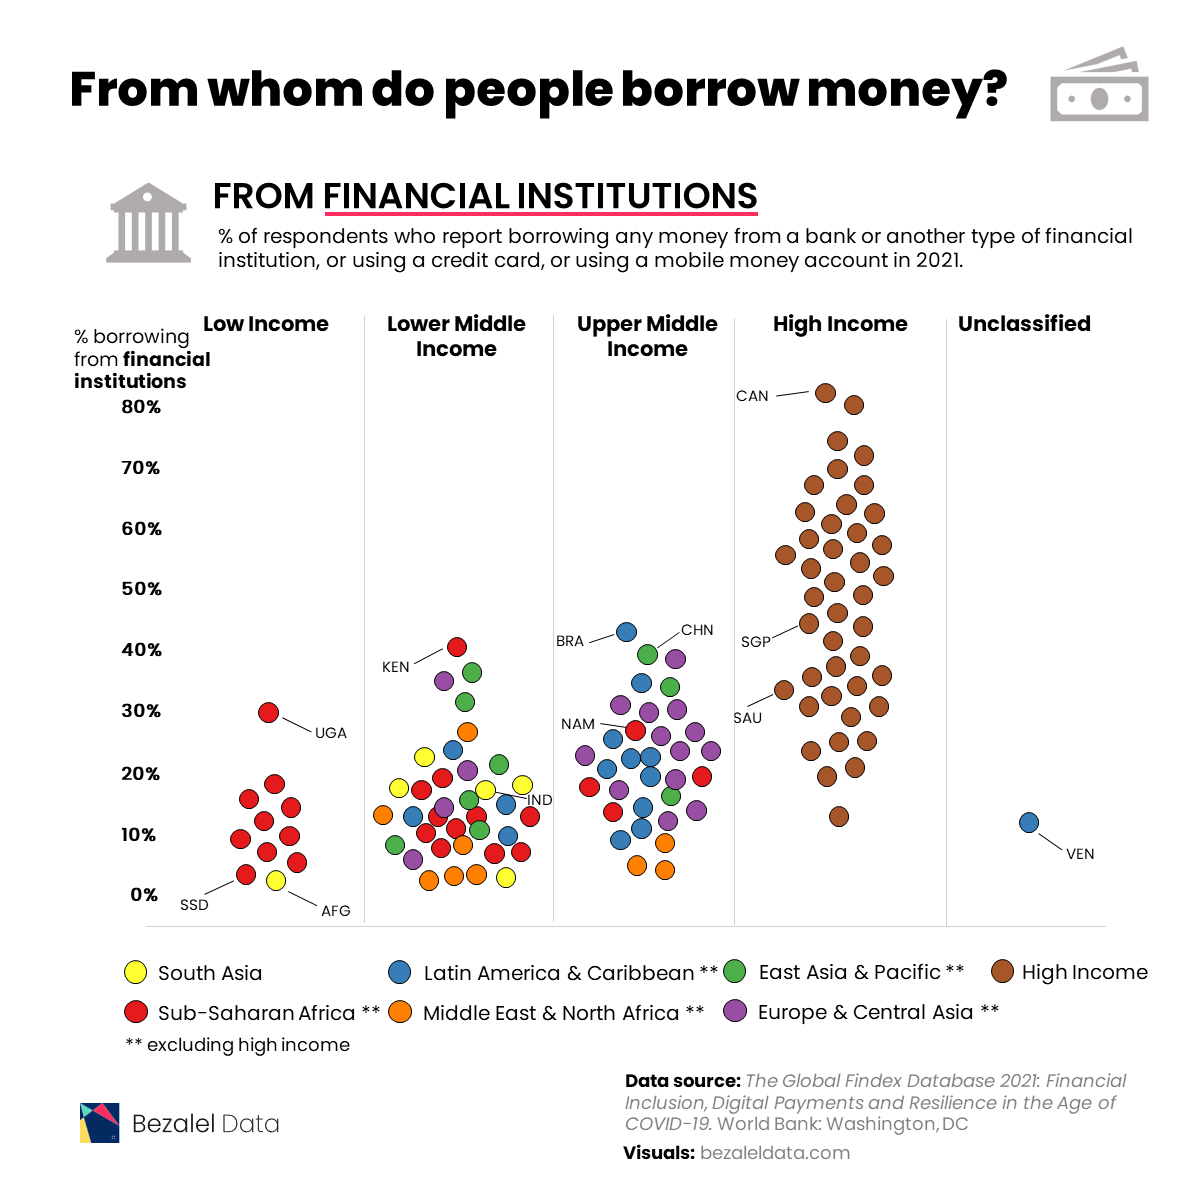
In 2021, most individuals in high income economies borrowed money from formal financial institutions.
| Country | Region | Borrowed from a financial institution |
|---|---|---|
| Canada | High income | 81.01% |
| Israel | High income | 79.52% |
| Iceland | High income | 73.36% |
| Hong Kong SAR, China | High income | 70.01% |
| Korea, Rep. | High income | 68.64% |
| Norway | High income | 66.82% |
| United States | High income | 66.21% |
| Taiwan, China | High income | 61.95% |
| Switzerland | High income | 61.40% |
| Japan | High income | 61.19% |
| New Zealand | High income | 60.38% |
| Australia | High income | 57.29% |
| Austria | High income | 56.52% |
| Italy | High income | 55.01% |
| United Kingdom | High income | 54.98% |
| Germany | High income | 54.68% |
| Ireland | High income | 54.11% |
| Denmark | High income | 53.16% |
| Finland | High income | 52.98% |
| Spain | High income | 51.92% |
| Sweden | High income | 48.69% |
| Belgium | High income | 47.98% |
| France | High income | 44.37% |
| Singapore | High income | 42.82% |
| Slovenia | High income | 42.36% |
| Uruguay | High income | 42.01% |
| Brazil | Latin America & Caribbean (excluding high income) | 40.75% |
| China | East Asia & Pacific (excluding high income) | 39.19% |
| Malta | High income | 38.95% |
| Türkiye | Europe & Central Asia (excluding high income) | 37.84% |
| Netherlands | High income | 34.45% |
| Slovak Republic | High income | 34.41% |
| Mongolia | East Asia & Pacific (excluding high income) | 34.39% |
| Ukraine | Europe & Central Asia (excluding high income) | 34.13% |
| Estonia | High income | 33.64% |
| Croatia | High income | 33.03% |
| Saudi Arabia | High income | 32.38% |
| Poland | High income | 31.92% |
| Czech Republic | High income | 31.33% |
| Cyprus | High income | 31.25% |
| Cambodia | East Asia & Pacific (excluding high income) | 30.89% |
| Argentina | Latin America & Caribbean (excluding high income) | 30.81% |
| Portugal | High income | 30.44% |
| Kazakhstan | Europe & Central Asia (excluding high income) | 29.76% |
| Russian Federation | Europe & Central Asia (excluding high income) | 29.75% |
| Thailand | East Asia & Pacific (excluding high income) | 28.26% |
| Bulgaria | Europe & Central Asia (excluding high income) | 26.36% |
| Armenia | Europe & Central Asia (excluding high income) | 26.17% |
| Iran, Islamic Rep. | Middle East & North Africa (excluding high income) | 25.11% |
| Chile | High income | 24.20% |
| Georgia | Europe & Central Asia (excluding high income) | 23.89% |
| Ecuador | Latin America & Caribbean (excluding high income) | 23.23% |
| Latvia | High income | 22.74% |
| United Arab Emirates | High income | 22.46% |
| Kenya | Sub-Saharan Africa (excluding high income) | 22.18% |
| North Macedonia | Europe & Central Asia (excluding high income) | 22.10% |
| Peru | Latin America & Caribbean (excluding high income) | 21.95% |
| Dominican Republic | Latin America & Caribbean (excluding high income) | 21.65% |
| Bosnia and Herzegovina | Europe & Central Asia (excluding high income) | 21.30% |
| Sri Lanka | South Asia | 21.29% |
| Namibia | Sub-Saharan Africa (excluding high income) | 20.97% |
| Serbia | Europe & Central Asia (excluding high income) | 20.65% |
| Greece | High income | 20.11% |
| Mauritius | Sub-Saharan Africa (excluding high income) | 20.09% |
| Bolivia | Latin America & Caribbean (excluding high income) | 19.30% |
| Romania | Europe & Central Asia (excluding high income) | 19.14% |
| Hungary | High income | 18.93% |
| Uganda | Sub-Saharan Africa (excluding high income) | 18.62% |
| South Africa | Sub-Saharan Africa (excluding high income) | 18.22% |
| Colombia | Latin America & Caribbean (excluding high income) | 18.10% |
| Kyrgyz Republic | Europe & Central Asia (excluding high income) | 17.73% |
| Kosovo | Europe & Central Asia (excluding high income) | 17.61% |
| Costa Rica | Latin America & Caribbean (excluding high income) | 17.46% |
| Philippines | East Asia & Pacific (excluding high income) | 17.45% |
| Liberia | Sub-Saharan Africa (excluding high income) | 15.42% |
| Bangladesh | South Asia | 14.22% |
| Nepal | South Asia | 14.11% |
| Malaysia | East Asia & Pacific (excluding high income) | 13.48% |
| Albania | Europe & Central Asia (excluding high income) | 13.39% |
| Moldova | Europe & Central Asia (excluding high income) | 13.18% |
| Indonesia | East Asia & Pacific (excluding high income) | 12.86% |
| Tajikistan | Europe & Central Asia (excluding high income) | 12.43% |
| Paraguay | Latin America & Caribbean (excluding high income) | 12.39% |
| Nicaragua | Latin America & Caribbean (excluding high income) | 12.19% |
| Jamaica | Latin America & Caribbean (excluding high income) | 12.04% |
| Lithuania | High income | 11.95% |
| India | South Asia | 11.79% |
| Mali | Sub-Saharan Africa (excluding high income) | 10.99% |
| El Salvador | Latin America & Caribbean (excluding high income) | 10.56% |
| Panama | Latin America & Caribbean (excluding high income) | 10.39% |
| Honduras | Latin America & Caribbean (excluding high income) | 10.32% |
| Mozambique | Sub-Saharan Africa (excluding high income) | 10.27% |
| Senegal | Sub-Saharan Africa (excluding high income) | 9.98% |
| Tunisia | Middle East & North Africa (excluding high income) | 9.89% |
| Jordan | Middle East & North Africa (excluding high income) | 9.86% |
| Lao PDR | East Asia & Pacific (excluding high income) | 9.15% |
| Venezuela, RB | Latin America & Caribbean (excluding high income) | 8.83% |
| Benin | Sub-Saharan Africa (excluding high income) | 8.21% |
| Malawi | Sub-Saharan Africa (excluding high income) | 7.99% |
| Uzbekistan | Europe & Central Asia (excluding high income) | 7.50% |
| Togo | Sub-Saharan Africa (excluding high income) | 7.42% |
| Ghana | Sub-Saharan Africa (excluding high income) | 7.40% |
| Egypt, Arab Rep. | Middle East & North Africa (excluding high income) | 7.30% |
| Myanmar | East Asia & Pacific (excluding high income) | 7.06% |
| Cameroon | Sub-Saharan Africa (excluding high income) | 6.99% |
| Zambia | Sub-Saharan Africa (excluding high income) | 6.76% |
| Burkina Faso | Sub-Saharan Africa (excluding high income) | 6.66% |
| Nigeria | Sub-Saharan Africa (excluding high income) | 6.40% |
| Congo, Rep. | Sub-Saharan Africa (excluding high income) | 6.19% |
| Guinea | Sub-Saharan Africa (excluding high income) | 6.11% |
| Gabon | Sub-Saharan Africa (excluding high income) | 5.48% |
| Morocco | Middle East & North Africa (excluding high income) | 4.99% |
| West Bank and Gaza | Middle East & North Africa (excluding high income) | 4.94% |
| Tanzania | Sub-Saharan Africa (excluding high income) | 4.45% |
| Sierra Leone | Sub-Saharan Africa (excluding high income) | 4.29% |
| Cote d'Ivoire | Sub-Saharan Africa (excluding high income) | 4.10% |
| Algeria | Middle East & North Africa (excluding high income) | 3.80% |
| Iraq | Middle East & North Africa (excluding high income) | 3.64% |
| Pakistan | South Asia | 3.51% |
| Lebanon | Middle East & North Africa (excluding high income) | 3.31% |
| Zimbabwe | Sub-Saharan Africa (excluding high income) | 2.89% |
| South Sudan | Sub-Saharan Africa (excluding high income) | 2.48% |
| Afghanistan | South Asia | 2.05% |
With 81% of respondents borrowing from financial institutions, Canada tops this list. Meanwhile, Israel (80%), Iceland (73%), Hong Kong (70%), and South Korea (69%) are not far behind.
This is not surprising for richer nations, as financial services in these countries are more available and accessible. This, coupled with higher financial literacy, including a general understanding of interest rates and credit-building opportunities, contribute to the popularity of financial institutions.
Also, it’s worth noting that some countries have cultural practices that factor in. For example, 61% of respondents in Japan used formal financial institutions, which are a more socially acceptable option than asking to borrow money from friends and family (just 6% of people in Japan).
Borrowing from Friends and Family
In contrast, more individuals in lower income economies approached family and friends in order to borrow money.
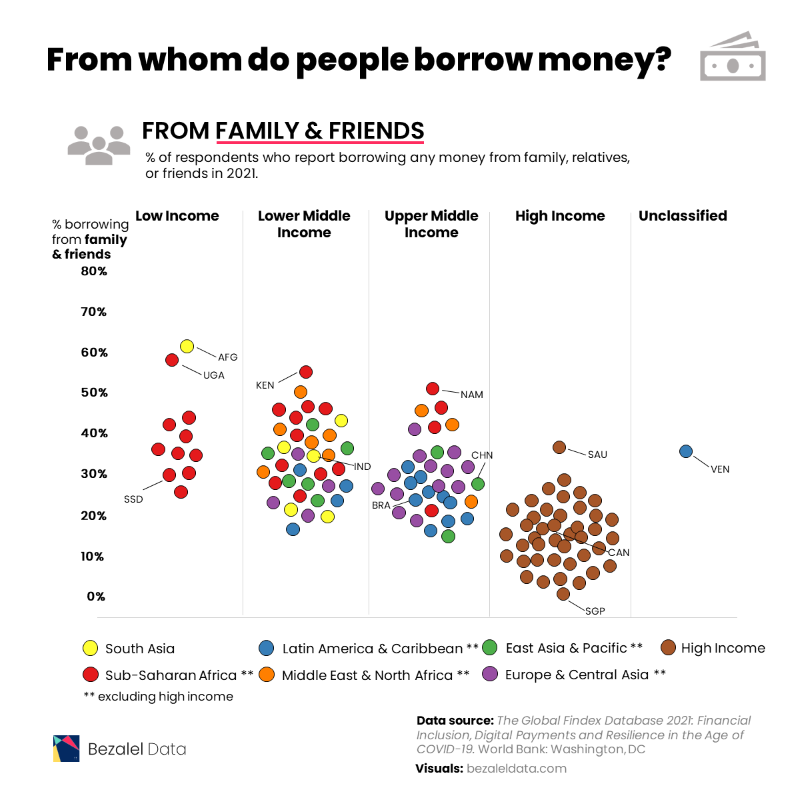
Afghanistan tops this list with 60% of respondents relying on friends and family, compared to only 2% borrowing money from formal financial institutions.
| Country | Region | Borrowed from family or friends |
|---|---|---|
| Afghanistan | South Asia | 60.18% |
| Uganda | Sub-Saharan Africa (excluding high income) | 57.45% |
| Kenya | Sub-Saharan Africa (excluding high income) | 54.40% |
| Namibia | Sub-Saharan Africa (excluding high income) | 50.25% |
| Morocco | Middle East & North Africa (excluding high income) | 48.73% |
| Nigeria | Sub-Saharan Africa (excluding high income) | 44.71% |
| South Africa | Sub-Saharan Africa (excluding high income) | 44.54% |
| Iraq | Middle East & North Africa (excluding high income) | 44.10% |
| Cameroon | Sub-Saharan Africa (excluding high income) | 43.49% |
| Zambia | Sub-Saharan Africa (excluding high income) | 43.08% |
| Zimbabwe | Sub-Saharan Africa (excluding high income) | 42.34% |
| Guinea | Sub-Saharan Africa (excluding high income) | 42.04% |
| Nepal | South Asia | 41.79% |
| Jordan | Middle East & North Africa (excluding high income) | 41.76% |
| Gabon | Sub-Saharan Africa (excluding high income) | 41.41% |
| Liberia | Sub-Saharan Africa (excluding high income) | 41.37% |
| Tunisia | Middle East & North Africa (excluding high income) | 41.05% |
| Philippines | East Asia & Pacific (excluding high income) | 40.82% |
| Türkiye | Europe & Central Asia (excluding high income) | 40.80% |
| Iran, Islamic Rep. | Middle East & North Africa (excluding high income) | 39.80% |
| Sierra Leone | Sub-Saharan Africa (excluding high income) | 39.02% |
| Ghana | Sub-Saharan Africa (excluding high income) | 38.58% |
| Egypt, Arab Rep. | Middle East & North Africa (excluding high income) | 37.75% |
| Saudi Arabia | High income | 35.76% |
| Bangladesh | South Asia | 35.49% |
| Mali | Sub-Saharan Africa (excluding high income) | 35.15% |
| Burkina Faso | Sub-Saharan Africa (excluding high income) | 35.14% |
| Cambodia | East Asia & Pacific (excluding high income) | 34.85% |
| Venezuela, RB | Latin America & Caribbean (excluding high income) | 34.81% |
| Togo | Sub-Saharan Africa (excluding high income) | 33.99% |
| West Bank and Gaza | Middle East & North Africa (excluding high income) | 33.93% |
| Thailand | East Asia & Pacific (excluding high income) | 32.83% |
| Lao PDR | East Asia & Pacific (excluding high income) | 32.36% |
| Moldova | Europe & Central Asia (excluding high income) | 32.18% |
| Ukraine | Europe & Central Asia (excluding high income) | 32.17% |
| Senegal | Sub-Saharan Africa (excluding high income) | 31.30% |
| Armenia | Europe & Central Asia (excluding high income) | 31.29% |
| India | South Asia | 31.02% |
| Bolivia | Latin America & Caribbean (excluding high income) | 30.69% |
| Algeria | Middle East & North Africa (excluding high income) | 30.52% |
| Cote d'Ivoire | Sub-Saharan Africa (excluding high income) | 30.20% |
| Albania | Europe & Central Asia (excluding high income) | 30.00% |
| Bulgaria | Europe & Central Asia (excluding high income) | 29.99% |
| Benin | Sub-Saharan Africa (excluding high income) | 29.33% |
| Mozambique | Sub-Saharan Africa (excluding high income) | 29.33% |
| Tanzania | Sub-Saharan Africa (excluding high income) | 29.24% |
| Colombia | Latin America & Caribbean (excluding high income) | 29.08% |
| Indonesia | East Asia & Pacific (excluding high income) | 28.85% |
| South Sudan | Sub-Saharan Africa (excluding high income) | 28.84% |
| Ecuador | Latin America & Caribbean (excluding high income) | 28.79% |
| Serbia | Europe & Central Asia (excluding high income) | 28.49% |
| Russian Federation | Europe & Central Asia (excluding high income) | 28.40% |
| Mongolia | East Asia & Pacific (excluding high income) | 27.01% |
| Kyrgyz Republic | Europe & Central Asia (excluding high income) | 27.01% |
| China | East Asia & Pacific (excluding high income) | 26.43% |
| Honduras | Latin America & Caribbean (excluding high income) | 26.07% |
| Greece | High income | 25.94% |
| Kosovo | Europe & Central Asia (excluding high income) | 25.86% |
| Argentina | Latin America & Caribbean (excluding high income) | 25.72% |
| Kazakhstan | Europe & Central Asia (excluding high income) | 25.64% |
| Romania | Europe & Central Asia (excluding high income) | 25.58% |
| Malawi | Sub-Saharan Africa (excluding high income) | 25.24% |
| North Macedonia | Europe & Central Asia (excluding high income) | 25.14% |
| Dominican Republic | Latin America & Caribbean (excluding high income) | 24.70% |
| Brazil | Latin America & Caribbean (excluding high income) | 24.66% |
| Congo, Rep. | Sub-Saharan Africa (excluding high income) | 24.40% |
| Lebanon | Middle East & North Africa (excluding high income) | 24.26% |
| Nicaragua | Latin America & Caribbean (excluding high income) | 23.75% |
| Iceland | High income | 23.63% |
| Peru | Latin America & Caribbean (excluding high income) | 23.34% |
| United Arab Emirates | High income | 23.04% |
| Myanmar | East Asia & Pacific (excluding high income) | 23.03% |
| Sri Lanka | South Asia | 22.53% |
| Paraguay | Latin America & Caribbean (excluding high income) | 22.20% |
| Pakistan | South Asia | 21.87% |
| Uzbekistan | Europe & Central Asia (excluding high income) | 21.53% |
| Cyprus | High income | 20.95% |
| Bosnia and Herzegovina | Europe & Central Asia (excluding high income) | 20.94% |
| Chile | High income | 20.72% |
| Georgia | Europe & Central Asia (excluding high income) | 20.61% |
| Mauritius | Sub-Saharan Africa (excluding high income) | 20.48% |
| Costa Rica | Latin America & Caribbean (excluding high income) | 20.29% |
| Jamaica | Latin America & Caribbean (excluding high income) | 20.02% |
| Tajikistan | Europe & Central Asia (excluding high income) | 19.86% |
| Poland | High income | 19.34% |
| Norway | High income | 19.29% |
| United States | High income | 18.09% |
| Uruguay | High income | 17.60% |
| Panama | Latin America & Caribbean (excluding high income) | 17.54% |
| Denmark | High income | 17.51% |
| Croatia | High income | 17.09% |
| El Salvador | Latin America & Caribbean (excluding high income) | 16.78% |
| Slovenia | High income | 16.77% |
| Latvia | High income | 16.57% |
| Australia | High income | 16.44% |
| Estonia | High income | 15.74% |
| Malaysia | East Asia & Pacific (excluding high income) | 15.44% |
| Israel | High income | 15.43% |
| New Zealand | High income | 15.19% |
| Slovak Republic | High income | 15.02% |
| Germany | High income | 15.01% |
| Austria | High income | 14.41% |
| Canada | High income | 14.00% |
| Finland | High income | 13.43% |
| Czech Republic | High income | 13.41% |
| Korea, Rep. | High income | 13.16% |
| Malta | High income | 12.99% |
| Belgium | High income | 12.13% |
| Sweden | High income | 11.79% |
| Hungary | High income | 11.15% |
| Lithuania | High income | 10.65% |
| Spain | High income | 10.44% |
| France | High income | 10.42% |
| Netherlands | High income | 10.24% |
| Ireland | High income | 9.84% |
| Taiwan, China | High income | 9.70% |
| Portugal | High income | 8.22% |
| Hong Kong SAR, China | High income | 7.59% |
| Japan | High income | 6.43% |
| Switzerland | High income | 6.10% |
| United Kingdom | High income | 5.24% |
| Italy | High income | 5.06% |
| Singapore | High income | 1.89% |
Many individuals in African countries including Uganda (57%), Kenya (54%), Namibia (50%), and Morocco (49%) also are choosing to borrow money from friends and family over financial institutions.
These preferences can be attributed to various factors including a lack of trust in banking and financial institutions, lacking access to such services, or the lack of information about such services if they are available.
And in some societies, borrowing from friends and family can be seen as a cultural norm, especially in places where mutual support and solidarity play a strong role.
What’s Next?
As viewed by the World Bank, financial inclusion is an important foundation of any nation’s development, and it’s also one of the UN’s Sustainable Development Goals. Increasing levels of financial inclusion helps give people access to services like savings plans, credit avenues, and online payments and transactions.
And thanks to commitments from countries and financial systems, global ownership of banking accounts has increased significantly (and been further spurred by the COVID-19 pandemic). According to the Global Findex Database, bank account ownership has risen to 76% in 2021, up from just 51% a decade prior.
However, access to these services is still rife with gaps when it comes to low income nations, low income individuals, and unequal access based on gender. The future of borrowing now relies on how nations deal with these challenges.
-

 Crime1 week ago
Mapped: The Most Dangerous Cities in the U.S.
-

 Energy3 weeks ago
How Old Are the World’s Nuclear Reactors?
-

 Countries7 days ago
Mapped: World’s Top 40 Largest Military Budgets
-

 Energy3 weeks ago
How Big is the Market for Crude Oil?
-

 Crime7 days ago
Mapped: The Safest Cities in the U.S.
-

 Markets2 weeks ago
Ranked: The Most Profitable U.S. Companies, by Sector
-

 apps5 days ago
How Long it Took for Popular Apps to Reach 100 Million Users
-

 Markets4 weeks ago
The World’s Biggest Mutual Fund and ETF Providers