Markets
Mapped: Unemployment Forecasts, by Country in 2023
Mapped: Unemployment Forecasts, by Country in 2023
This was originally posted on Advisor Channel. Sign up to the free mailing list to get beautiful visualizations on financial markets that help advisors and their clients.
As 2022 clearly illustrated, the global job market can surprise expectations.
So far, this year is no different. The unemployment rate in six of the G7 countries hovers near the lowest in a century. With an unemployment rate of 3.4%, the U.S. jobless rate hasn’t fallen this low since 1969.
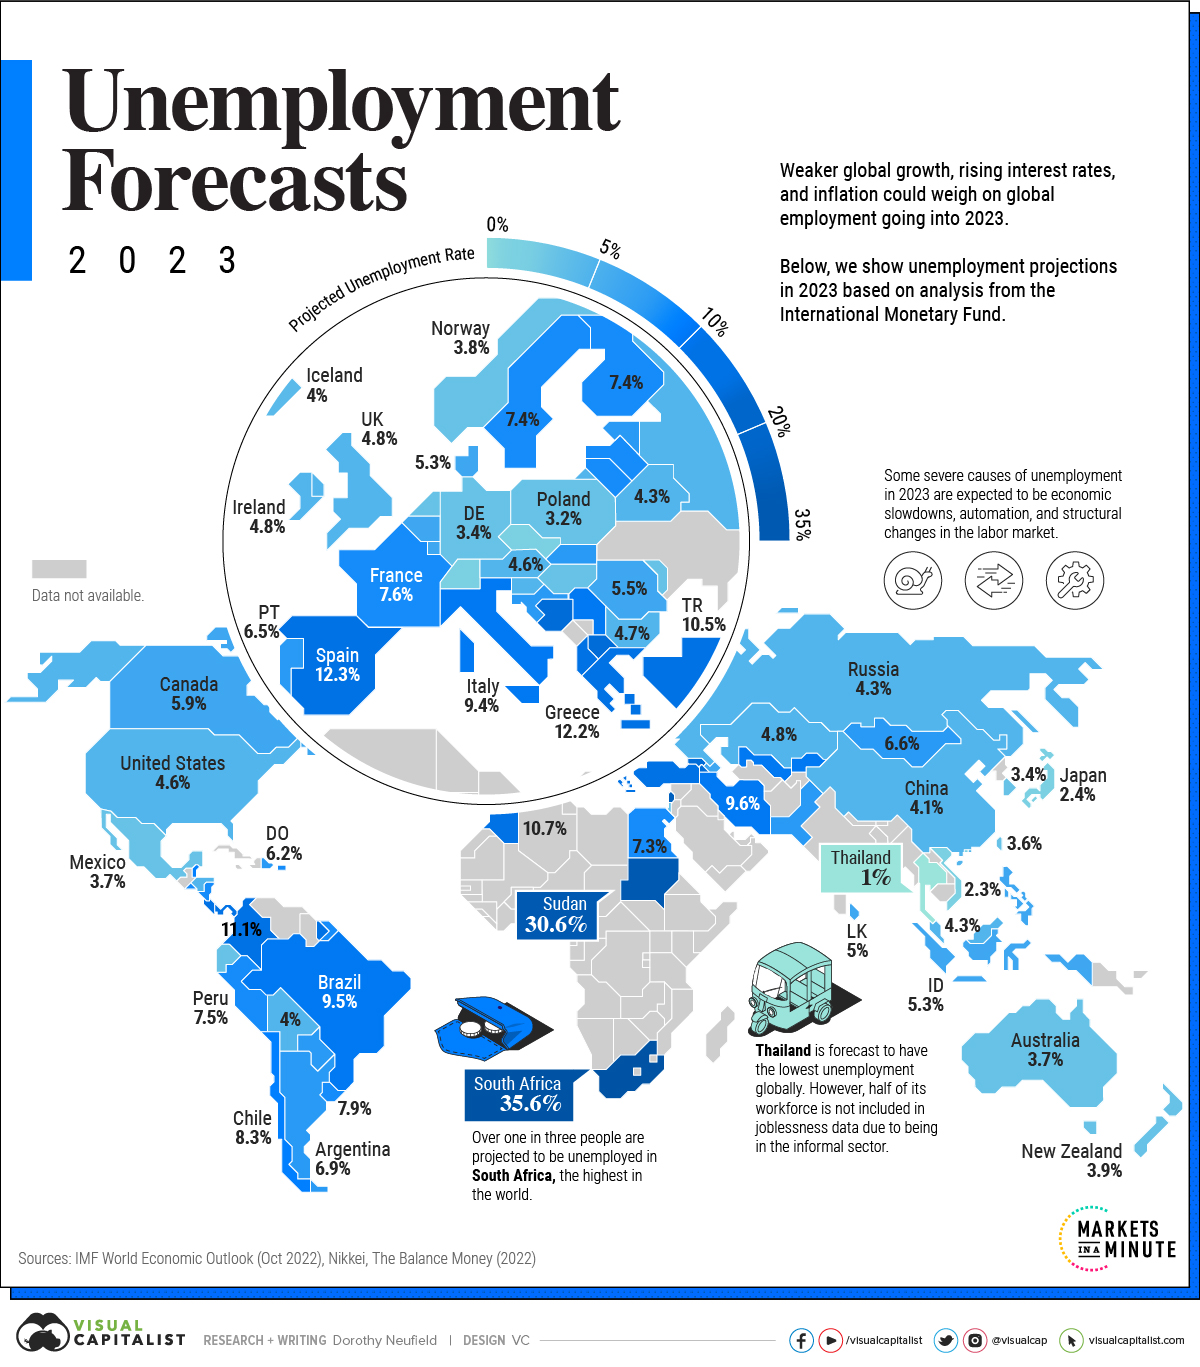
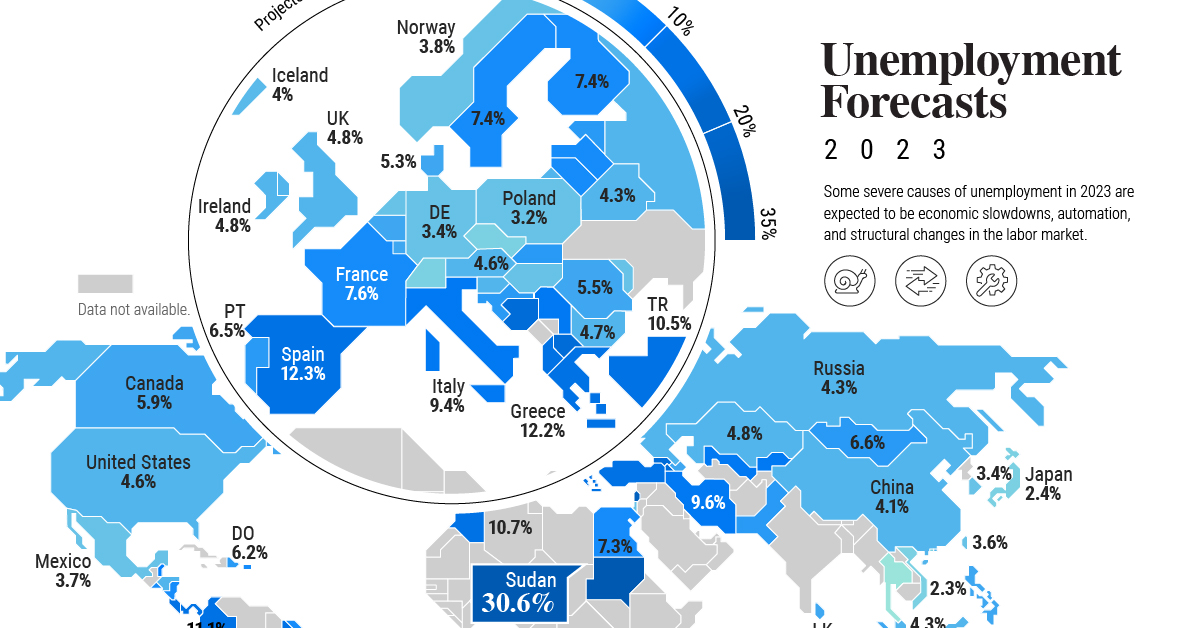
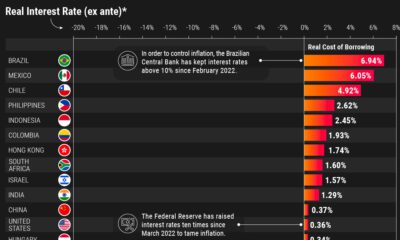
But as some economies navigate a strong labor market against high inflation and hawkish monetary policy, others are facing more challenging conditions. In the above graphic, we map unemployment forecasts in 2023 using data from the IMF’s World Economic Outlook.
Uncertainty Clouds the Surface
Across many countries, the pandemic has made entrenched labor trends worse. It has also altered job market conditions.
South Africa is projected to see the highest jobless rate globally. As the most industrialized nation on the continent, unemployment is estimated to hit 35.6% in 2023. Together, slow economic growth and stringent labor laws have prevented firms from hiring workers. Over the last two decades, unemployment has hovered around 20%.
| Country / Region | 2023 Unemployment Rate(Projected) |
|---|---|
| 🇿🇦 South Africa | 35.6% |
| 🇸🇩 Sudan | 30.6% |
| 🇵🇸 West Bank and Gaza | 25.0% |
| 🇬🇪 Georgia | 19.5% |
| 🇧🇦 Bosnia and Herzegovina | 17.2% |
| 🇦🇲 Armenia | 15.1% |
| 🇲🇰 North Macedonia | 15.0% |
| 🇨🇷 Costa Rica | 13.2% |
| 🇧🇸 The Bahamas | 12.7% |
| 🇪🇸 Spain | 12.3% |
| 🇬🇷 Greece | 12.2% |
| 🇨🇴 Colombia | 11.1% |
| 🇲🇦 Morocco | 10.7% |
| 🇸🇷 Suriname | 10.6% |
| 🇹🇷 Turkiye | 10.5% |
| 🇧🇧 Barbados | 10.0% |
| 🇦🇱 Albania | 10.0% |
| 🇵🇦 Panama | 10.0% |
| 🇷🇸 Serbia | 9.7% |
| 🇮🇷 Iran | 9.6% |
| 🇺🇿 Uzbekistan | 9.5% |
| 🇧🇷 Brazil | 9.5% |
| 🇮🇹 Italy | 9.4% |
| 🇰🇬 Kyrgyz Republic | 9.0% |
| 🇨🇻 Cabo Verde | 8.5% |
| 🇨🇱 Chile | 8.3% |
| 🇧🇿 Belize | 8.0% |
| 🇵🇷 Puerto Rico | 7.9% |
| 🇺🇾 Uruguay | 7.9% |
| 🇦🇼 Aruba | 7.7% |
| 🇫🇷 France | 7.6% |
| 🇵🇪 Peru | 7.5% |
| 🇸🇻 El Salvador | 7.5% |
| 🇸🇪 Sweden | 7.4% |
| 🇫🇮 Finland | 7.4% |
| 🇲🇺 Mauritius | 7.4% |
| 🇪🇬 Egypt | 7.3% |
| 🇱🇻 Latvia | 7.2% |
| 🇳🇮 Nicaragua | 7.2% |
| 🇱🇹 Lithuania | 7.0% |
| 🇦🇷 Argentina | 6.9% |
| 🇪🇪 Estonia | 6.8% |
| 🇧🇳 Brunei Darussalam | 6.8% |
| 🇲🇳 Mongolia | 6.6% |
| 🇭🇷 Croatia | 6.6% |
| 🇨🇾 Cyprus | 6.5% |
| 🇵🇹 Portugal | 6.5% |
| 🇵🇰 Pakistan | 6.4% |
| 🇵🇾 Paraguay | 6.4% |
| 🇸🇰 Slovak Republic | 6.2% |
| 🇩🇴 Dominican Republic | 6.2% |
| 🇨🇦 Canada | 5.9% |
| 🇦🇿 Azerbaijan | 5.8% |
| 🇸🇲 San Marino | 5.7% |
| 🇧🇪 Belgium | 5.6% |
| 🇷🇴 Romania | 5.5% |
| 🇫🇯 Fiji | 5.5% |
| 🇵🇭 Philippines | 5.4% |
| 🇮🇩 Indonesia | 5.3% |
| 🇩🇰 Denmark | 5.3% |
| 🇱🇰 Sri Lanka | 5.0% |
| 🇱🇺 Luxembourg | 5.0% |
| 🇮🇪 Ireland | 4.8% |
| 🇰🇿 Kazakhstan | 4.8% |
| 🇬🇧 United Kingdom | 4.8% |
| 🇧🇬 Bulgaria | 4.7% |
| 🇦🇹 Austria | 4.6% |
| 🇭🇳 Honduras | 4.6% |
| 🇺🇸 U.S. | 4.6% |
| 🇧🇭 Bahrain | 4.4% |
| 🇷🇺 Russia | 4.3% |
| 🇧🇾 Belarus | 4.3% |
| 🇸🇮 Slovenia | 4.3% |
| 🇲🇾 Malaysia | 4.3% |
| 🇨🇳 China | 4.1% |
| 🇮🇸 Iceland | 4.0% |
| 🇧🇴 Bolivia | 4.0% |
| 🇭🇰 Hong Kong SAR | 4.0% |
| 🇳🇱 Netherlands | 3.9% |
| 🇳🇿 New Zealand | 3.9% |
| 🇭🇺 Hungary | 3.8% |
| 🇳🇴 Norway | 3.8% |
| 🇮🇱 Israel | 3.8% |
| 🇪🇨 Ecuador | 3.8% |
| 🇦🇺 Australia | 3.7% |
| 🇲🇽 Mexico | 3.7% |
| 🇹🇼 Taiwan | 3.6% |
| 🇲🇩 Moldova | 3.5% |
| 🇰🇷 South Korea | 3.4% |
| 🇩🇪 Germany | 3.4% |
| 🇲🇹 Malta | 3.3% |
| 🇵🇱 Poland | 3.2% |
| 🇸🇨 Seychelles | 3.0% |
| 🇲🇴 Macao SAR | 2.7% |
| 🇯🇵 Japan | 2.4% |
| 🇨🇭 Switzerland | 2.4% |
| 🇻🇳 Vietnam | 2.3% |
| 🇨🇿 Czech Republic | 2.3% |
| 🇸🇬 Singapore | 2.1% |
| 🇹🇭 Thailand | 1.0% |
In Europe, Bosnia and Herzegovina is estimated to see the highest unemployment rate, at over 17%. It is followed by North Macedonia (15.0%) and Spain (12.7%). These jobless rates are more than double the projections for advanced economies in Europe.
The U.S. is forecast to see an unemployment rate of 4.6%, or 1.2% higher than current levels.
This suggests that today’s labor market strength will ease as U.S. economic indicators weaken. One marker is the Conference Board’s Leading Economic Index, which fell for its tenth straight month in December. Lower manufacturing orders, declining consumer expectations, and shorter work weeks are among the indicators it tracks.
Like the U.S., many advanced countries are witnessing labor market strength, especially in the United Kingdom, Asia, and Europe, although how long it will last is unknown.
A Closer Look at U.S. Numbers
Unlike some declining economic indicators mentioned above, the job market is one of the strongest areas of the global economy. Even as the tech sector reports mass layoffs, unemployment claims in the U.S. fall below recent averages. (It’s worth noting the tech sector makes up just 4% of the workforce).
In 2022, 4.8 million jobs were added, more than double the average seen between 2015-2019. Of course, the pandemic recovery has impacted these figures.
Some analysts suggest that despite a bleaker economic outlook, companies are hesitant to conduct layoffs. At the same time, the labor market is absorbing workers who have lost employment.
Consider the manufacturing sector. Even as the January ISM Purchasing Managers Index posted lower readings, hitting 47.4—a level of 48.7 and below generally indicates a recession—factories are not laying off many workers. Instead, manufacturers are saying they are confident conditions will improve in the second half of the year.
Containing Aftershocks
Today, strong labor markets pose a key challenge for central bankers globally.
This is because the robust job market is contributing to high inflation numbers. Yet despite recent rate increases, the impact has yet to prompt major waves in unemployment. Typically, monetary policy moves like these takes about a year to take peak effect. To combat inflation, monetary policy has been shown to take over three or even four years.
The good news is that inflation can potentially be tamed by other means. Fixing supply-side dynamics, such as preventing supply shortages and improving transportation systems and infrastructure could cool inflation.
As investors closely watch economic data, rising unemployment could come on the heels of higher interest rates, but so far this has yet to unravel.


Markets
The 50 Best One-Year Returns on the S&P 500 (1980-2022)
The highest one-year return among the top S&P 500 stocks from 1980 to 2022 was a staggering 2,620%. Which stocks top the ranks?

The Top S&P 500 Stocks by Annual Returns
The average annual return of the S&P 500 was 10% from 1980-2022, excluding dividends. Of course, there are some companies that deliver much higher returns in any given year.
In this graphic using data from S&P Dow Jones Indices, we explore the top S&P 500 stocks with the best single year returns over the last four decades.
Ranking the Top S&P 500 Stocks
In order to find the top gainers, S&P took the top 10 best-performing stocks each year and then narrowed that list down to the top 50 overall. They ranked the top S&P 500 stocks by price returns, meaning that no dividends or stock distributions were included.
The best gains were clustered in a few select years, including the 1999 dot-com boom, the 2003 stock market rally, and the 2009 recovery from the Global Financial Crisis. None of the biggest gains happened in 2021 or 2022.
| Rank | Company | Sector | Return | Year |
|---|---|---|---|---|
| 1 | Qualcomm | Information Technology | 2620% | 1999 |
| 2 | Tesla | Consumer Discretionary | 743% | 2020 |
| 3 | DSC Communications | Communication Services | 468% | 1992 |
| 4 | Coleco Industries | Consumer Discretionary | 435% | 1982 |
| 5 | Avaya | Information Technology | 428% | 2003 |
| 6 | Chrysler | Consumer Discretionary | 426% | 1982 |
| 7 | XL Capital (Axa XL) | Financials | 395% | 2009 |
| 8 | Tenet Healthcare | Healthcare | 369% | 2009 |
| 9 | Dynegy | Utilities | 361% | 2000 |
| 10 | Advanced Micro Devices | Information Technology | 348% | 2009 |
| 11 | Sprint | Communication Services | 343% | 1999 |
| 12 | Ford | Consumer Discretionary | 337% | 2009 |
| 13 | NEXTEL Communications | Communication Services | 336% | 1999 |
| 14 | LSI Logic | Information Technology | 319% | 1999 |
| 15 | NVIDIA | Information Technology | 308% | 2001 |
| 16 | Nortel Networks | Communication Services | 304% | 1999 |
| 17 | Etsy | Consumer Discretionary | 302% | 2020 |
| 18 | Genworth Financial | Financials | 301% | 2009 |
| 19 | Micron Technology | Information Technology | 300% | 2009 |
| 20 | NetFlix | Communication Services | 298% | 2013 |
| 21 | Oracle | Information Technology | 290% | 1999 |
| 22 | Western Digital | Information Technology | 286% | 2009 |
| 23 | Network Appliance (NetApp) | Information Technology | 270% | 1999 |
| 24 | Data General | Information Technology | 267% | 1991 |
| 25 | Yahoo | Communication Services | 265% | 1999 |
| 26 | Williams Companies | Energy | 264% | 2003 |
| 27 | Novell | Information Technology | 264% | 1991 |
| 28 | Dynegy | Utilities | 263% | 2003 |
| 29 | Sun Microsystems | Information Technology | 262% | 1999 |
| 30 | PMC-Sierra | Information Technology | 262% | 2003 |
| 31 | Advanced Micro Devices | Information Technology | 259% | 1991 |
| 32 | Dell | Information Technology | 248% | 1998 |
| 33 | Global Marine | Energy | 247% | 1980 |
| 34 | Micron Technology | Information Technology | 243% | 2013 |
| 35 | Best Buy | Consumer Discretionary | 237% | 2013 |
| 36 | Reebok | Consumer Discretionary | 234% | 2000 |
| 37 | Freeport-McMoRan | Materials | 229% | 2009 |
| 38 | Biomet (Zimmer Biomet) | Healthcare | 226% | 1991 |
| 39 | NVIDIA | Information Technology | 224% | 2016 |
| 40 | Gap | Consumer Discretionary | 223% | 1991 |
| 41 | NetFlix | Communication Services | 219% | 2010 |
| 42 | Fleetwood Enterprises (Fleetwood RV) | Consumer Discretionary | 217% | 1982 |
| 43 | National Semiconductor | Information Technology | 217% | 1999 |
| 44 | Dell | Information Technology | 216% | 1997 |
| 45 | Tandy Corp (RadioShack) | Information Technology | 216% | 1980 |
| 46 | Novell | Information Technology | 215% | 2003 |
| 47 | Corning | Information Technology | 215% | 2003 |
| 48 | CB Richard Ellis (CBRE) | Real Estate | 214% | 2009 |
| 49 | AES Corp | Utilities | 213% | 2003 |
| 50 | Expedia | Consumer Discretionary | 212% | 2009 |
Qualcomm was by far the top-performer in any one calendar year window. The company had key patents for Code Division Multiple Access (CDMA) technology, which enabled fast wireless internet access and became the basis for 3G networks.
Its stock took off in 1999 as it shed less profitable business lines, resolved a patent dispute with competitor Ericsson, and joined the S&P 500 Index. At the time, CNN reported that one lucky investor who heard about Qualcomm from an investment-banker-turned-rabbi earned $17 million—roughly $30 million in today’s dollars.
The most recent stocks to make the rankings were both from 2020: well-known Tesla (#2) and lesser-known online marketplace Etsy (#17), which saw sales from independent creators surge during the early COVID-19 pandemic. The dollar value of items sold on Etsy more than doubled from $5.3 billion in 2019 to $10.3 billion in 2020, with mask sales accounting for 7% of the total.
Biggest Gainers in Each Sector
While information technology stocks made up nearly half of the list, there is representation from nine of the 11 S&P 500 sectors. No companies from the Industrials or Consumer Staples sectors made it into the ranks of the top S&P 500 stocks by annual returns.
Below, we show the stock with the best annual return for each sector.

Tesla was the top-performing Consumer Discretionary stock on the list. After meeting the requirement of four consecutive quarters of positive earnings, it joined the S&P 500 Index on December 21, 2020. The company’s performance was boosted by the announcement that it would be included in the S&P 500, along with strong performance in China, and general EV buzz as environmental regulations tightened worldwide.
In the realm of Communication Services, DSC Communications saw a sizable return in 1992. The telecommunications equipment company had contracts with major companies such as Bell and Motorola. Alcatel-Lucent (then Alcatel), a French producer of mobile phones, purchased DSC Communications in 1998.
Serial Success Stories
It’s impressive to make the list of the top S&P 500 stocks by calendar returns once, but there are seven companies that have done it twice.
Some stocks saw their repeated outperformance close together, with Dell making the ranks back-to-back in 1997 and 1998.

On the other hand, a select few have more staying power. Computing giant NVIDIA topped the charts in 2001 and triumphed again 15 years later in 2016. And this year might be another win, as the company has recently reached a $1 trillion market capitalization and has the highest year-to-date return in the S&P 500 as of July 6, 2023.

-

 Energy2 weeks ago
Who’s Still Buying Russian Fossil Fuels in 2023?
-

 VC+4 days ago
What’s New on VC+ in July
-

 Investor Education4 weeks ago
Visualizing BlackRock’s Top Equity Holdings
-

 apps2 weeks ago
Meet the Competing Apps Battling for Twitter’s Market Share
-

 Public Opinion16 hours ago
How Do Chinese Citizens Feel About Other Countries?
-

 Markets4 weeks ago
Visualizing Every Company on the S&P 500 Index
-

 Markets2 weeks ago
Visualizing 1 Billion Square Feet of Empty Office Space
-

 Environment4 weeks ago
Life Cycle Emissions: EVs vs. Combustion Engine Vehicles