Misc
Mercator Misconceptions: Clever Map Shows the True Size of Countries
This Clever Map Shows the True Size of Countries
Maps are hugely important tools in our everyday life, whether it’s guiding our journeys from point A to B, or shaping our big picture perceptions about geopolitics and the environment.
For many people, the Earth as they know it is heavily informed by the Mercator projection—a tool used for nautical navigation that eventually became the world’s most widely recognized map.
Mercator’s Rise to the Top
With any map projection style, the big challenge lies in depicting a spherical object as a 2D graphic. There are various trade-offs with any map style, and those trade-offs can vary depending on how the map is meant to be used.
In 1569, the great cartographer, Gerardus Mercator, created a revolutionary new map based on a cylindrical projection. The new map was well-suited to nautical navigation since every line on the sphere is a constant course, or loxodrome.
Geographic Inflation
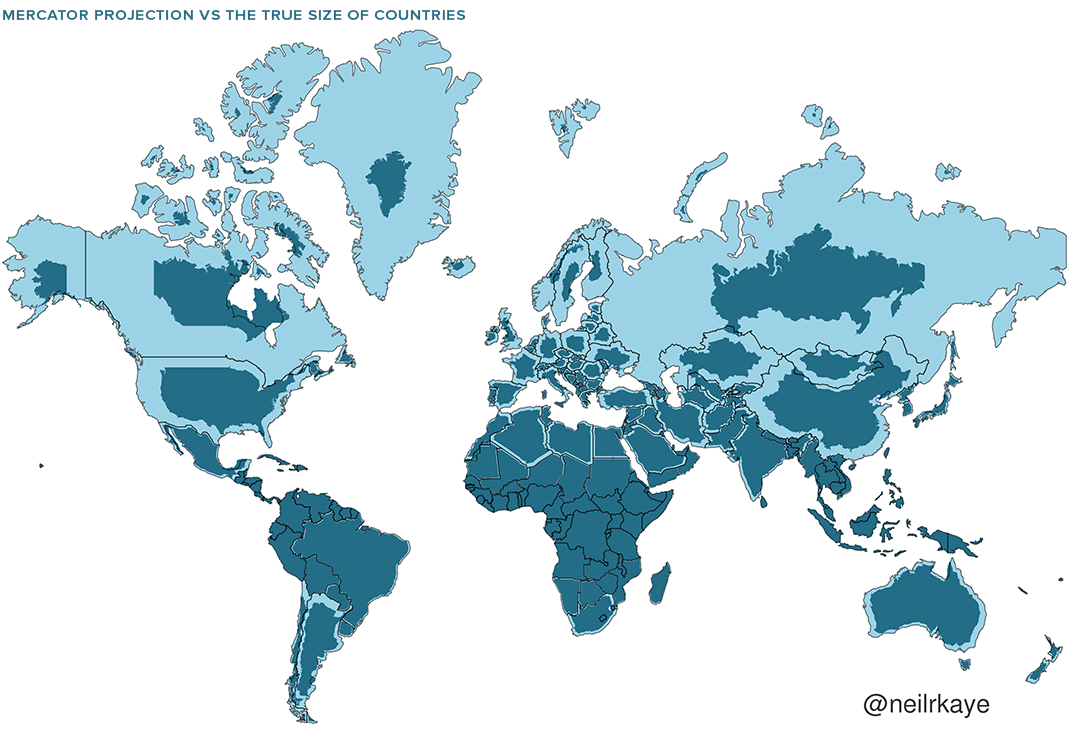
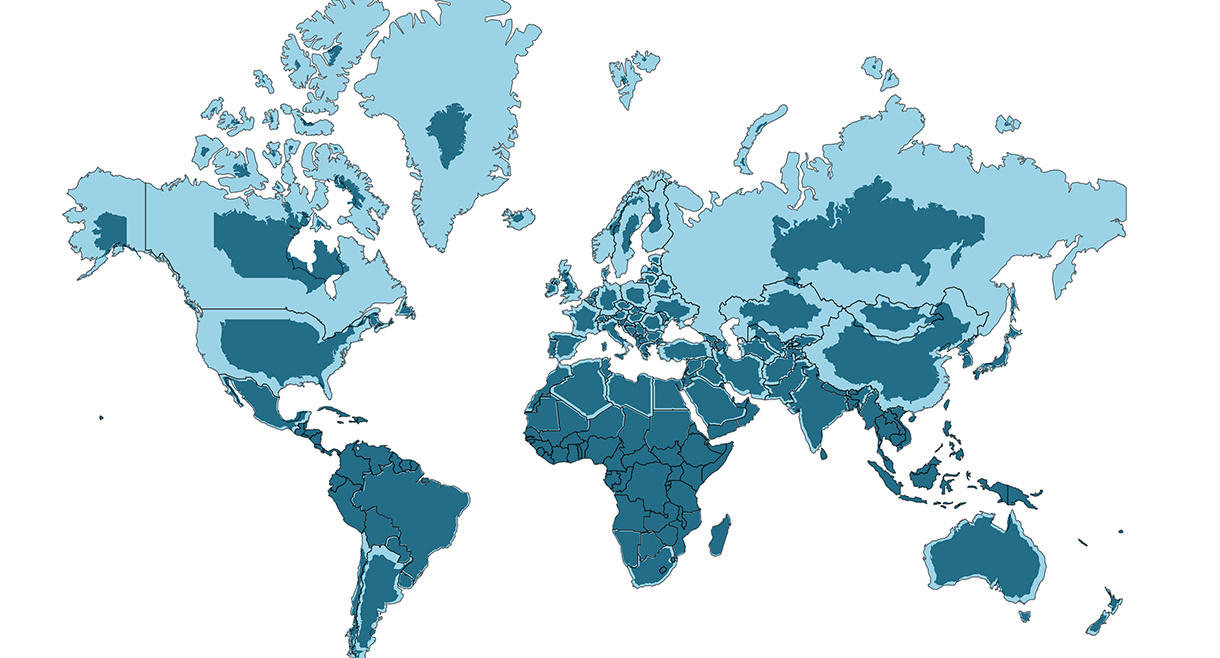
The vast majority of us aren’t using paper maps to chart our course across the ocean anymore, so critics of the Mercator projection argue that the continued use of this style of map gives users a warped sense of the true size of countries—particularly in the case of the African continent.
Mercator’s map inadvertently also pumps up the sizes of Europe and North America. Visually speaking, Canada and Russia appear to take up approximately 25% of the Earth’s surface, when in reality they occupy a mere 5%.
As the animated GIF below—created by Reddit user, neilrkaye – demonstrates, northern nations such as Canada and Russia have been artificially “pumped up” in the minds of many people around the world.
Greenland, which appears as a massive icy landmass in Mercator projection, shrinks way down. The continent of Africa takes a much more prominent position in this new, correctly-scaled map.
This visualization also highlights how distorted neighboring countries can look in Mercator projection. In the GIF above, Scandinavian countries no longer loom imposingly over their European neighbors, and Canada deflates to a size similar to the United States.
Despite inaccurate visual features—or perhaps because of them—the Mercator projection has achieved widespread adoption around the world. This includes in the classroom, where young minds are first learning about geography and forming opinions on the relationships between countries.
Getting Reacquainted with Globes
Google, whose map app is used by approximately 150 million people per month, took the bold step of using different projections for different purposes in 2018.
The Earth is depicted as a globe at further zoom levels, sidestepping map projection issues completely and displaying the world as it actually is: round. The result is a more accurate depiction of countries and landmasses.
With 3D Globe Mode on Google Maps desktop, Greenland's projection is no longer the size of Africa.
Just zoom all the way out at https://t.co/mIZTya01K3 😎🌍 pic.twitter.com/CIkkS7It8d
— Google Maps (@googlemaps) August 2, 2018
At closer zoom levels, users are typically using maps for things like navigation, which the Mercator projection was designed for. The exact angles of roads and borders are preserved in this projection.
In the Right Direction
In a more globally connected world, geographic literacy is more important than ever. As people become more accustomed to equal area maps and seeing the Earth in its spherical form, misconceptions about the size of continents may become a thing of the past.
This post was first published in 2018. We have since updated it, adding in new content for 2021.


Politics
How Do Chinese Citizens Feel About Other Countries?
What is the Chinese public’s view of world powers? This visual breaks down Chinese sentiment towards other countries.
Public Opinion: How Chinese Citizens Feel About Other Countries
Tensions over Taiwan, the COVID-19 pandemic, trade, and the war in Ukraine have impacted Chinese sentiment towards other countries.
This visualization uses data from the Center for International Security and Strategy (CISS) at Tsinghua University to rank survey responses from the Chinese public on their attitudes towards countries and regions around the world.
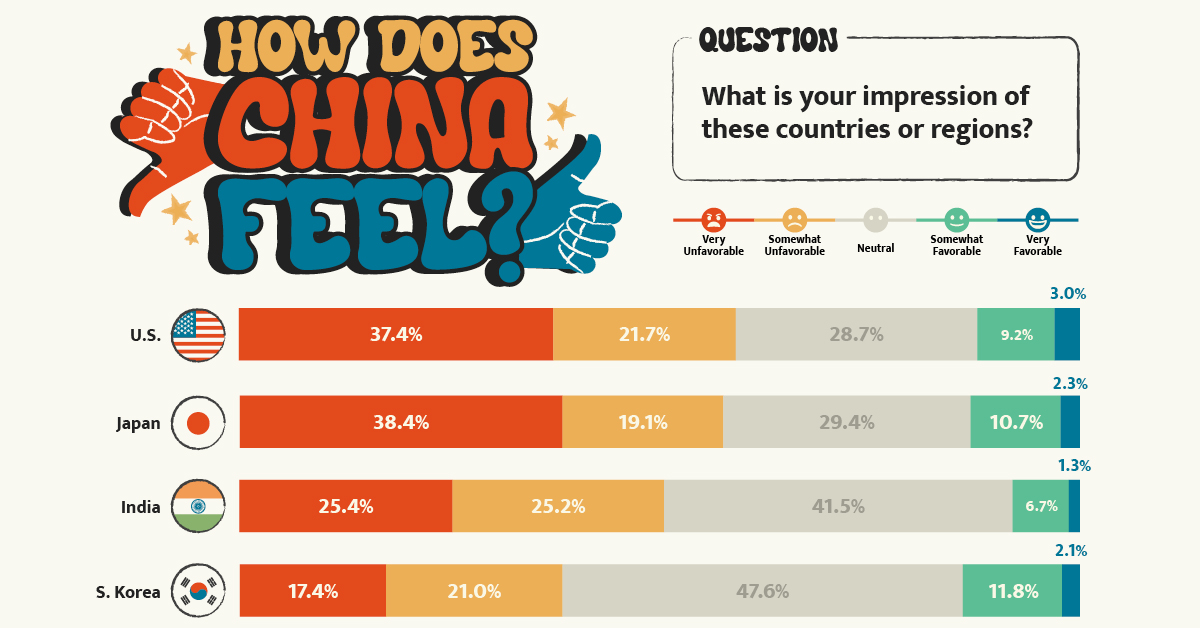
Chinese Sentiment Towards Other Countries in 2023
In the Center’s opinion polls, which surveyed a random sample of more than 2,500 Chinese mainland adults in November 2022, Russia came out significantly ahead.
Just under 60% of respondents held Russia in a favorable view, with 19% seeing the country as “very favorable.” Contrast that to the mere 12% that viewed the U.S. in a positive light.
Here’s a closer look at the data. The percentages refer to the share of respondents that voted for said category.
| Country/Region | Very Unfavorable | Somewhat Unfavorable | Neutral | Somewhat Favorable | Very Favorable |
|---|---|---|---|---|---|
| 🇺🇸 United States | 37.4% | 21.7% | 28.7% | 9.2% | 3.0% |
| 🇯🇵 Japan | 38.4% | 19.1% | 29.4% | 10.7% | 2.3% |
| 🇮🇳 India | 25.4% | 25.2% | 41.5% | 6.7% | 1.3% |
| 🇰🇷 South Korea | 17.4% | 21.0% | 47.6% | 11.8% | 2.1% |
| 🇪🇺 European Union | 9.3% | 15.6% | 57.6% | 14.1% | 3.3% |
| Southeast Asia | 7.1% | 13.1% | 59.5% | 16.8% | 3.5% |
| 🇷🇺 Russia | 3.0% | 4.8% | 33.7% | 39.4% | 19.0% |
Japan ranked just below the U.S. in terms of overall unfavorability, though a slightly higher share of respondents saw Japan as “very unfavorable” compared to America. This is likely due to both modern tensions in the East China Sea over mutually claimed islands and historical tensions over the Sino-Japanese Wars.
Chinese sentiment towards India was also unfavorable at just over 50%, though notably the country also received the lowest favorability rating at just 8%.
Additional Survey Findings
The survey also found that 39% of Chinese people get their information on international security from Chinese state-run media (mainly through TV), with an additional 19% getting information from government websites and official social accounts. Conversely, only 1.7% get their news from foreign websites and foreign social media, partially due to the Great Firewall.
When asked about different international security issues, the biggest shares of Chinese citizens ranked the following as their top three:
- Pandemics (12.9%)
- Disputes over territory and territorial waters (12.9%)
- China-U.S. relations (12.0%)
The pandemic’s high score reflects the harsher impact COVID-19 had on China. Chinese borders were shut for years and the public faced intense measures to reduce spread.
In terms of other world events, the majority of Chinese people align with a more “Eastern” viewpoint. For example, in regards to the war in Ukraine, the report found that:
“About 80 percent of the respondents believe the U.S. and Western countries should be held most accountable [for the war], while less than ten percent of the respondents argue that Russia is mainly responsible.”– Center for International Security and Strategy, Tsinghua University
Overall, the views of the Chinese public reflect the opposite of those found in many Western countries. They provide an important insight that it is not just the Chinese government holding particular views about the world, but the Chinese public as well.

-

 Politics17 hours ago
How Do Chinese Citizens Feel About Other Countries?
-

 Markets4 weeks ago
Visualizing Every Company on the S&P 500 Index
-

 Markets2 weeks ago
Visualizing 1 Billion Square Feet of Empty Office Space
-

 Energy4 weeks ago
Life Cycle Emissions: EVs vs. Combustion Engine Vehicles
-

 Maps2 weeks ago
Vintage Viz: The World’s Rivers and Lakes, Organized Neatly
-

 Finance3 weeks ago
Visualized: The 100 Largest U.S. Banks by Consolidated Assets
-

 Automation1 week ago
Charted: Changing Sentiments Towards AI in the Workplace
-

 VC+3 weeks ago
What are Top Investment Managers Holding in Their Portfolios?