Green
The World’s 25 Largest Lakes, Side by Side
The World’s 25 Largest Lakes, Side by Side
In many parts of the world, you don’t have to look very far to find a lake.
According to satellite data, there are roughly 100 million lakes larger than one hectare (2.47 acres) to be found globally. The largest lakes, which rival the size of entire nations, are more of a rarity.
One might expect the world’s largest lakes to be very alike, but from depth to saline content, their properties can be quite different. As well, the ranking of the world’s largest lakes is far from static, as human activity can turn a massive body of water into a desert within a single generation.
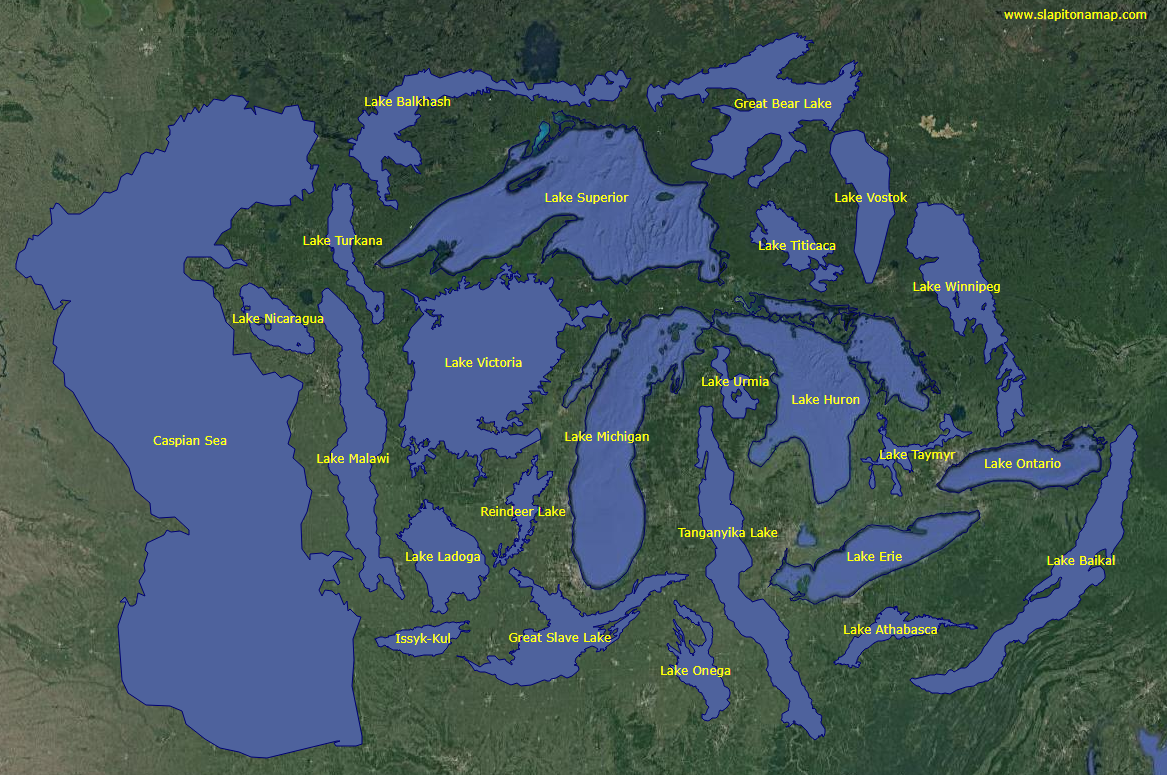
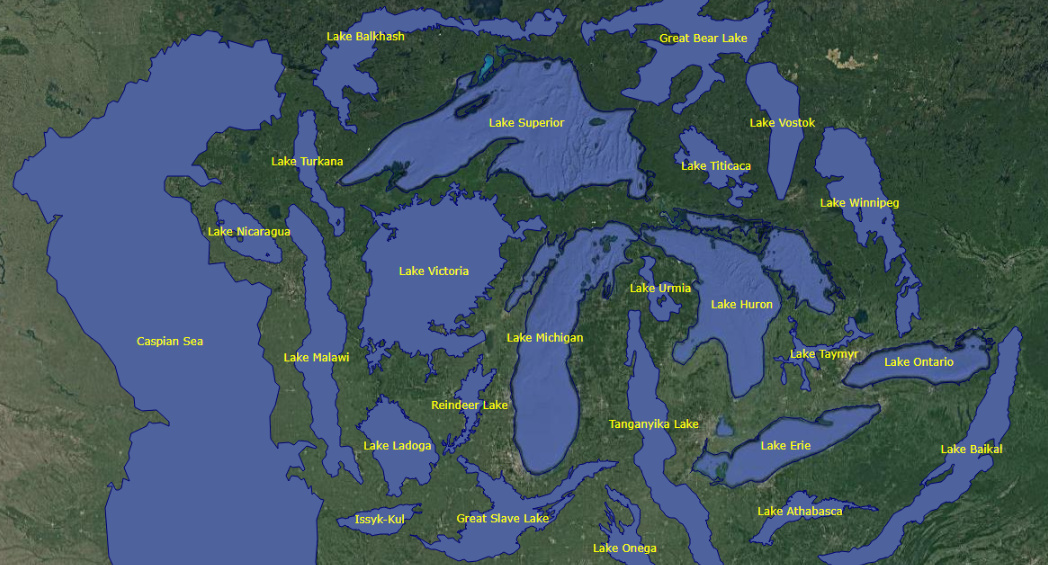
Today’s graphic – created using the fantastic online tool, Slap It On A Map! – uses the Great Lakes region as a point of comparison for the largest 25 lakes, by area. This is particularly useful in comparing the scale of lakes that are located in disparate parts of the globe.
The Greatest Lakes
The largest lake in the world by a long shot is the Caspian Sea – a name that hints at a past when it was contiguous with the ocean around 11 million years ago. This massive saline lake, which is nearly the same size as Japan, borders five countries: Kazakhstan, Russia, Turkmenistan, Azerbaijan, and Iran. An estimated 48 billion barrels of oil lay beneath the surface of the basin.
The five Great Lakes, which run along the Canada–U.S. border, form one of the largest collections of fresh water on Earth. This interconnected series of lakes represents around 20% of the world’s fresh water and the region supports over 100 million people, roughly equal to one-third of the Canada–U.S. population.
Amazingly, a single lake holds as much fresh water as all the Great Lakes combined – Lake Baikal. This rift lake in Siberia has a maximum depth of 5,371ft (1,637m). For comparison, the largest of the Great Lakes (Lake Superior) is only 25% as deep, with a maximum depth of 1,333ft (406m). Lake Baikal is unique in a number of other ways too. It is the world’s oldest, coldest lake, and around 80% of its animal species are endemic (not found anywhere else).
Here’s a full run-down of the top 25 lakes by area:
| Rank | Lake Name | Surface Area | Type | Countries on shoreline |
|---|---|---|---|---|
| 1 | Caspian Sea | 143,000 sq mi (371,000km²) | Saline | 🇰🇿 Kazakhstan 🇷🇺 Russia 🇹🇲 Turkmenistan 🇦🇿 Azerbaijan 🇮🇷 Iran |
| 2 | Superior | 31,700 sq mi (82,100km²) | Freshwater | 🇨🇦 Canada 🇺🇸 U.S. |
| 3 | Victoria | 26,590 sq mi (68,870km²) | Freshwater | 🇺🇬 Uganda 🇰🇪 Kenya 🇹🇿 Tanzania |
| 4 | Huron | 23,000 sq mi (59,600km²) | Freshwater | 🇨🇦 Canada 🇺🇸 U.S. |
| 5 | Michigan | 22,000 sq mi (58,000km²) | Freshwater | 🇺🇸 U.S. |
| 6 | Tanganyika | 12,600 sq mi (32,600km²) | Freshwater | 🇧🇮 Burundi 🇹🇿 Tanzania 🇿🇲 Zambia 🇨🇩 D.R.C. |
| 7 | Baikal | 12,200 sq mi (31,500km²) | Freshwater | 🇷🇺 Russia |
| 8 | Great Bear Lake | 12,000 sq mi (31,000km²) | Freshwater | 🇨🇦 Canada |
| 9 | Malawi | 11,400 sq mi (29,500km²) | Freshwater | 🇲🇼 Malawi 🇲🇿 Mozambique 🇹🇿 Tanzania |
| 10 | Great Slave Lake | 10,000 sq mi (27,000km²) | Freshwater | 🇨🇦 Canada |
| 11 | Erie | 9,900 sq mi (25,700km²) | Freshwater | 🇨🇦 Canada 🇺🇸 U.S. |
| 12 | Winnipeg | 9,465 sq mi (24,514km²) | Freshwater | 🇨🇦 Canada |
| 13 | Ontario | 7,320 sq mi (18,960km²) | Freshwater | 🇨🇦 Canada 🇺🇸 U.S. |
| 14 | Ladoga | 7,000 sq mi (18,130km²) | Freshwater | 🇷🇺 Russia |
| 15 | Balkhash | 6,300 sq mi (16,400km²) | Saline | 🇰🇿 Kazakhstan |
| 16 | Vostok | 4,800 sq mi (12,500km²) | Freshwater | 🇦🇶 Antarctica |
| 17 | Onega | 3,700 sq mi (9,700km²) | Freshwater | 🇷🇺 Russia |
| 18 | Titicaca | 3,232 sq mi (8,372km²) | Freshwater | 🇧🇴 Bolivia 🇵🇪 Peru |
| 19 | Nicaragua | 3,191 sq mi (8,264km²) | Freshwater | 🇳🇮 Nicaragua |
| 20 | Athabasca | 3,030 sq mi (7,850km²) | Freshwater | 🇨🇦 Canada |
| 21 | Taymyr | 2,700 sq mi (6,990km²) | Freshwater | 🇷🇺 Russia |
| 22 | Turkana | 2,473 sq mi (6,405km²) | Saline | 🇰🇪 Kenya 🇪🇹 Ethiopia |
| 23 | Reindeer Lake | 2,440 sq mi (6,330km²) | Freshwater | 🇨🇦 Canada |
| 24 | Issyk-Kul | 2,400 sq mi (6,200km²) | Saline | 🇰🇬 Kyrgyzstan |
| 25 | Urmia | 2,317 sq mi (6,001km²) | Saline | 🇮🇷 Iran |
The Great Lakes World Tour
For people living in Canada and the U.S., the shape and relative size of the Great Lakes system may be quite familiar. This makes the Great Lakes a fantastic point of comparison to help put the size of other world locations into perspective. To this end, we begin our Great Lakes World Tour.
First, the image below shows how the Great Lakes system would look if it was located in India.
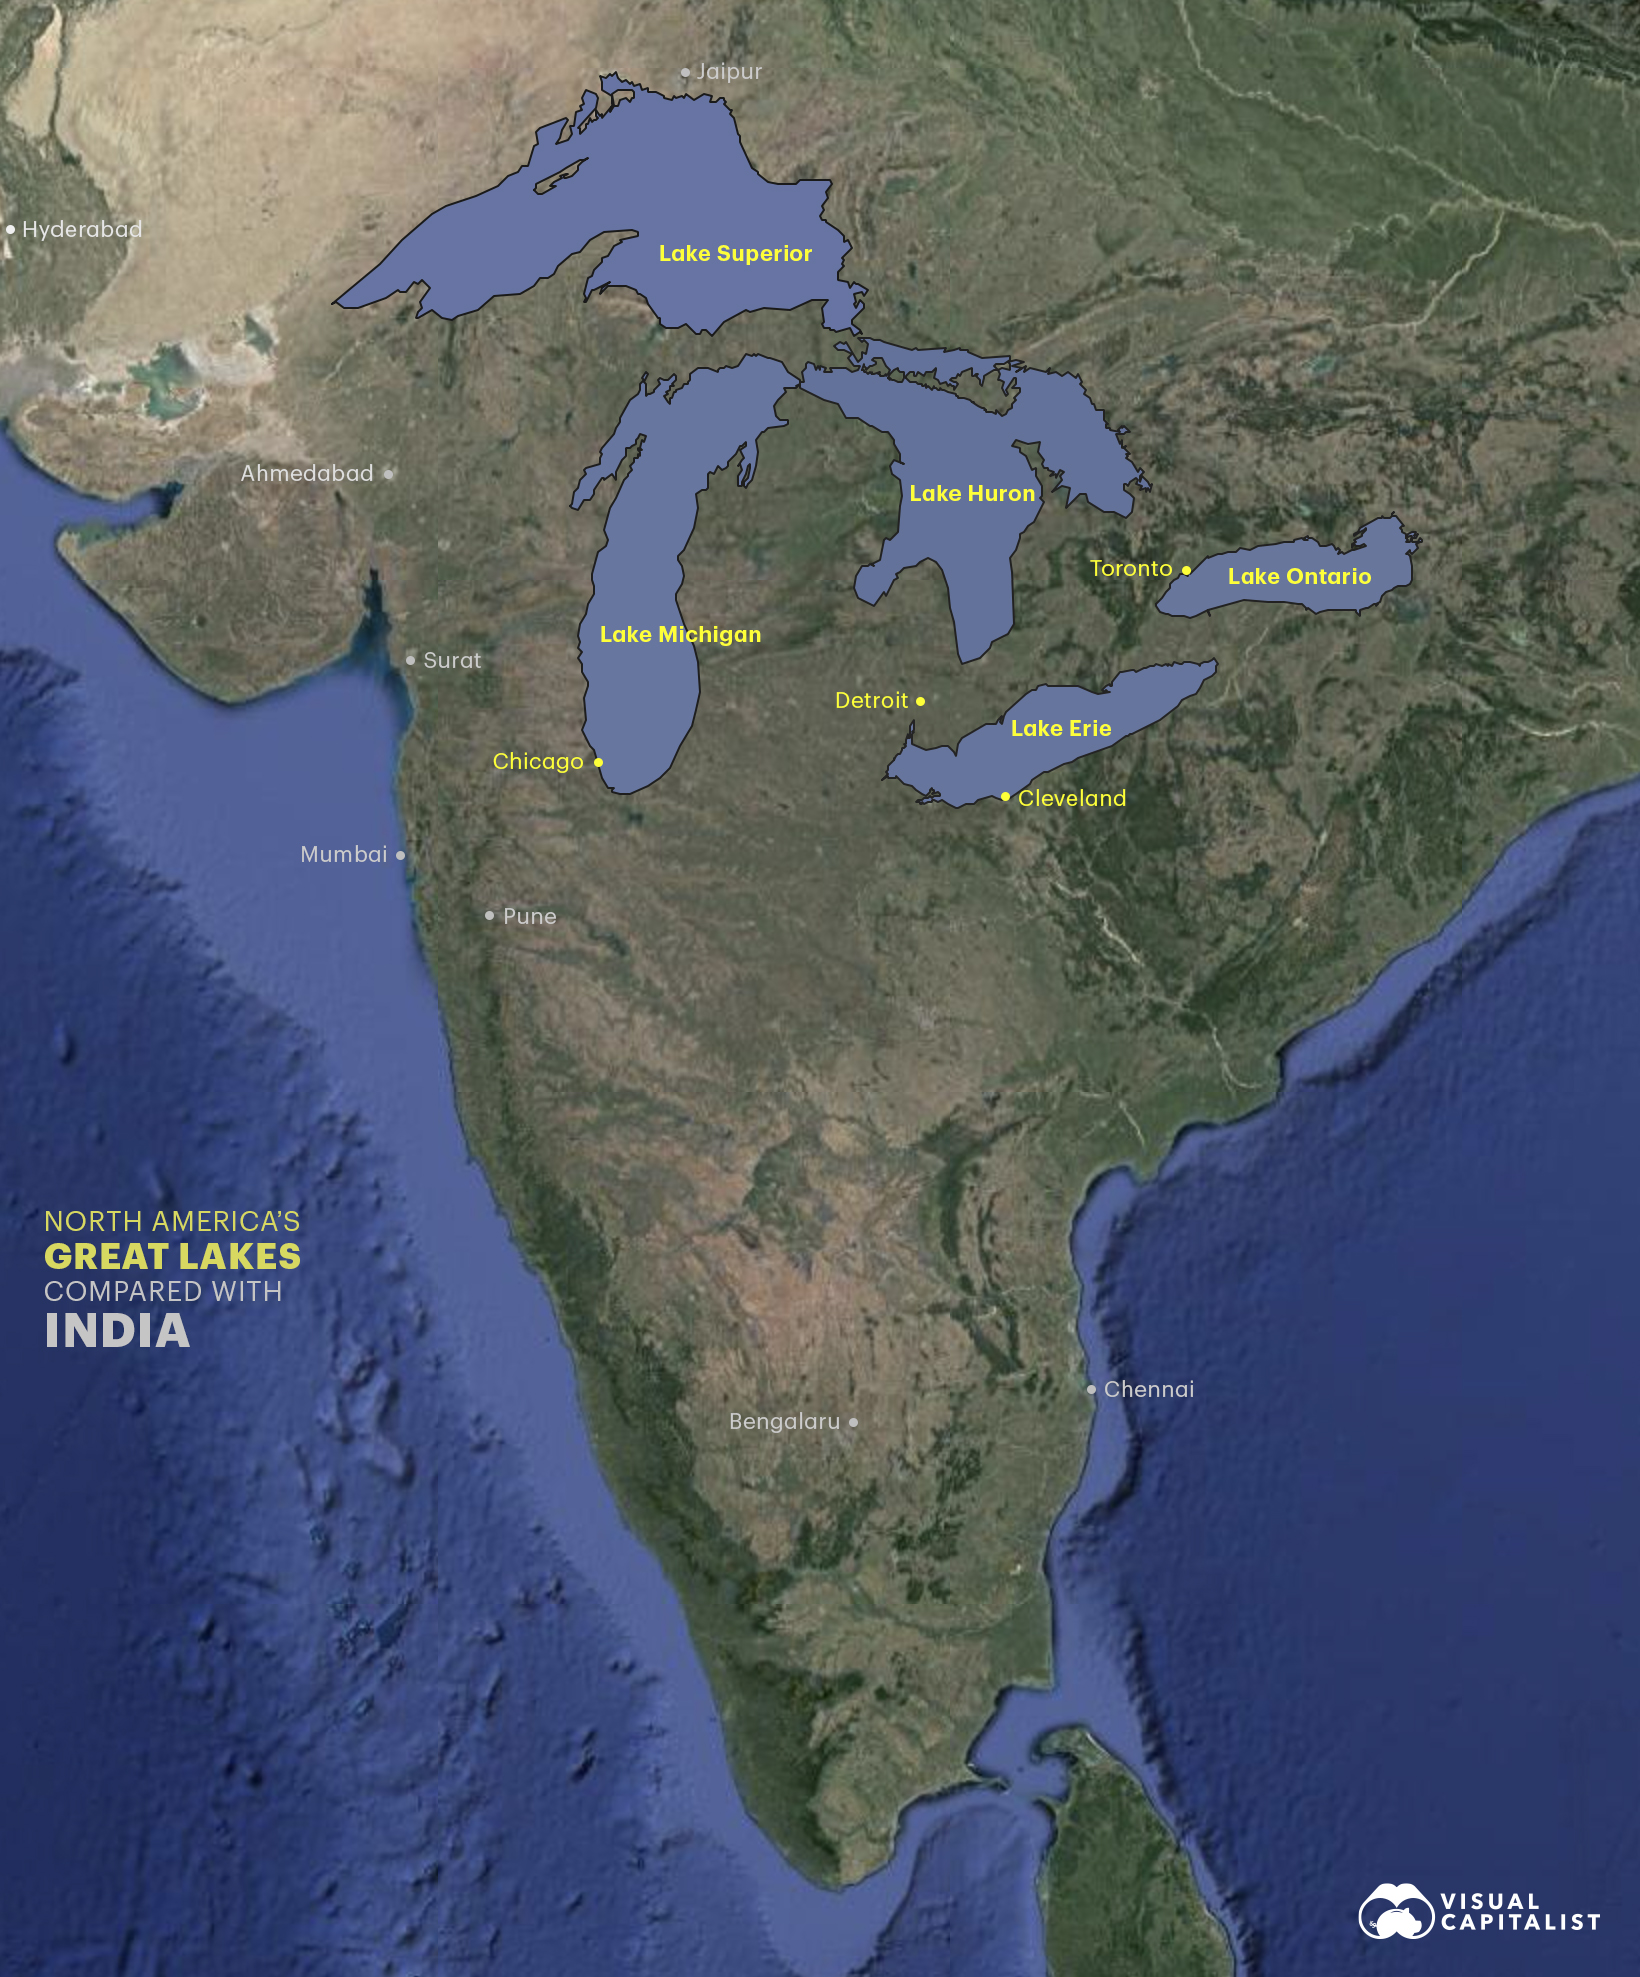
Distortions on commonly used maps can downplay the size of India compared to more northern nations. This view of the Great Lakes can help put India’s true size into perspective.
Next, we look at the Great Lakes overlaid within Central Europe.
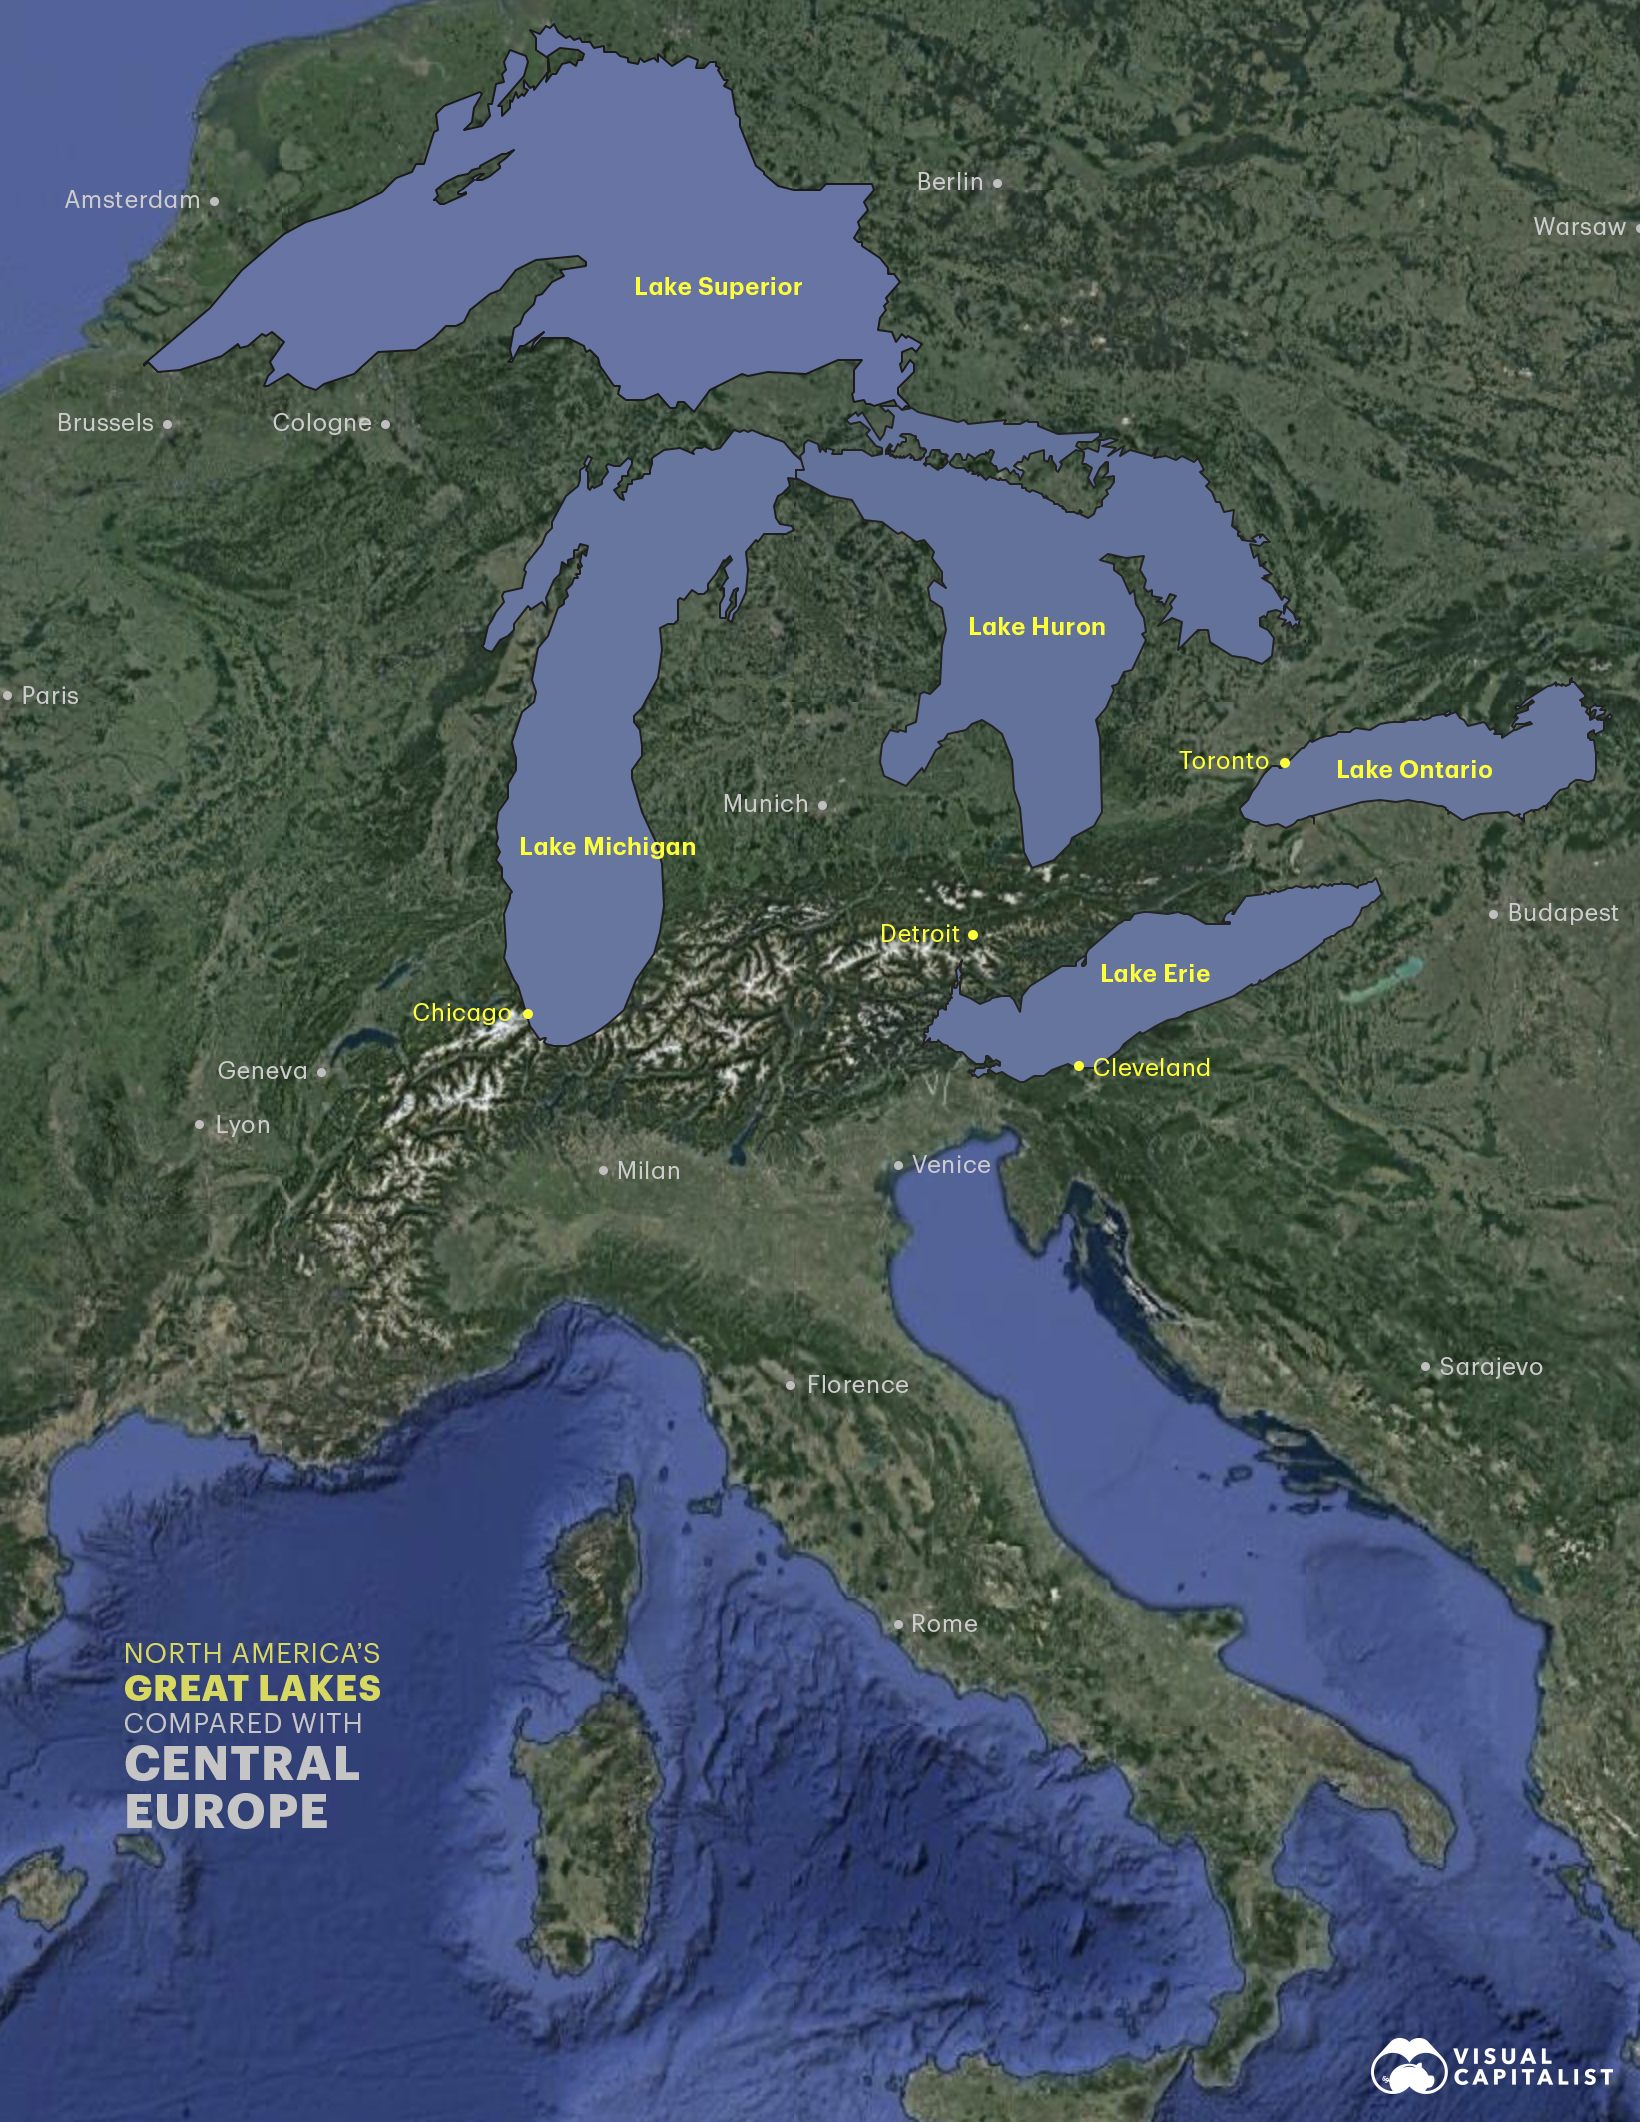
In the context of Europe, the lakes are so large that they extend from the Netherlands over to Slovakia. Lake Superior’s surface area of 31,700 mi2 (82,000 km2), is similar in size to Austria. Here’s are the five Great Lakes and European countries of equivalent size:
| Great Lakes | Surface Area | Equivalent Country | Area |
|---|---|---|---|
| Lake Superior | 82,000 km2 (31,700 sq mi) | 🇦🇹 Austria | 83,879 km2 (32,386 sq mi) |
| Lake Huron | 60,000 km2 (23,000 sq mi) | 🇱🇻 Latvia | 64,589 km2 (24,938 sq mi) |
| Lake Michigan | 58,000 km2 (22,300 sq mi) | 🇭🇷 Croatia | 56,594 km2 (21,851 sq mi) |
| Lake Erie | 25,700 km2 (9,910 sq mi) | 🇲🇰 North Macedonia | 25,713 km2 (9,928 sq mi) |
| Lake Ontario | 19,000 km2 (7,340 sq mi) | 🇸🇮 Slovenia | 20,271 km2 (7,827 sq mi) |
Lastly, here is a look at the Great Lakes in Southern Australia. Australia is the world’s 6th largest country, so the Great Lakes only occupy one corner of its land mass.
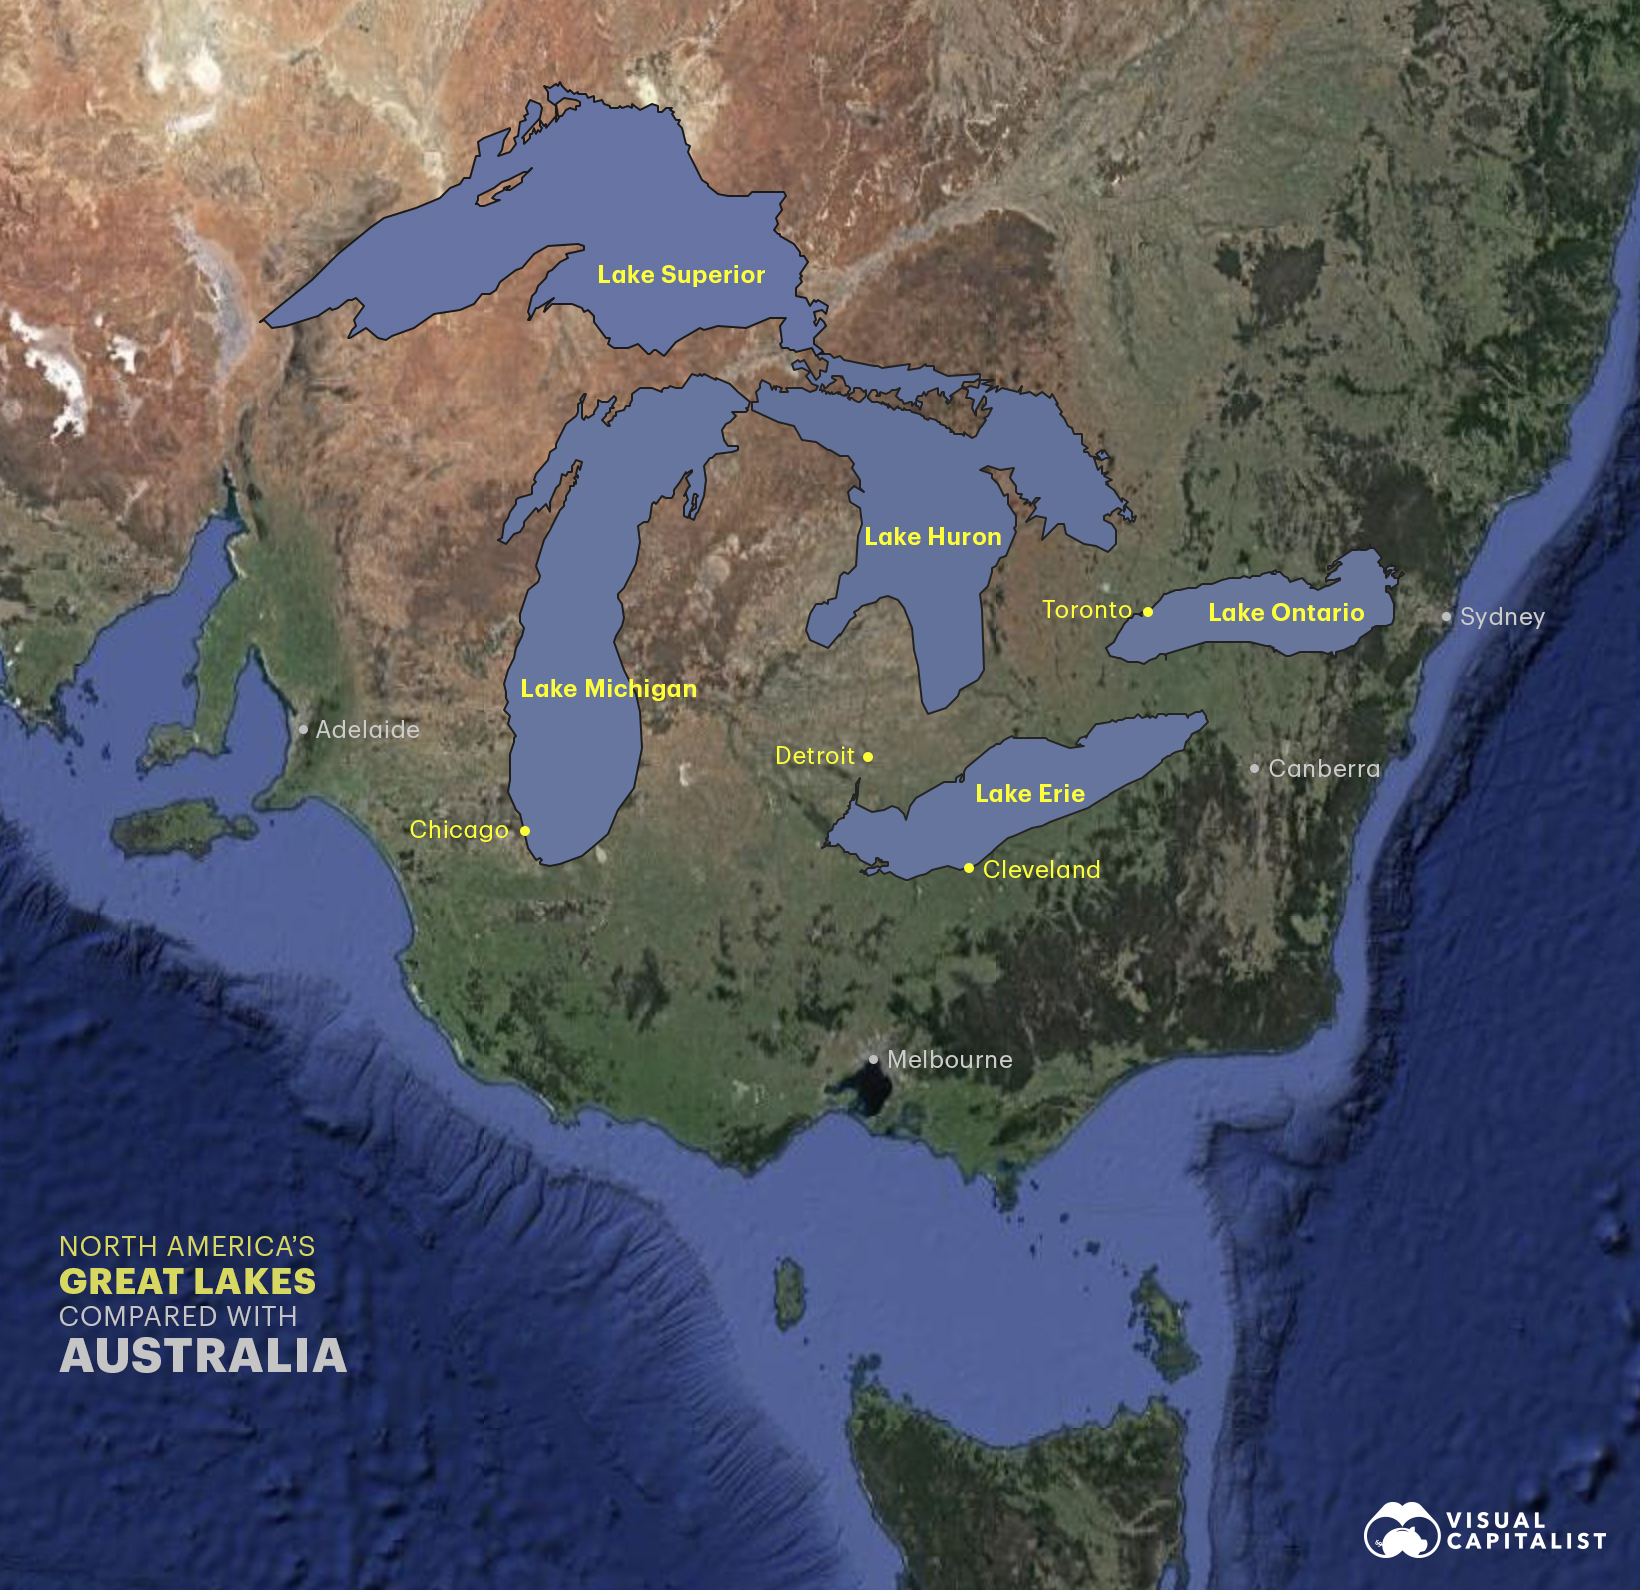
Australia’s lack of glacial history means that there are few permanent freshwater lakes in the country. Many of the country’s largest lakes only fill up during periods of excessive rainfall.
Shrinking out of the rankings
Not far from the world’s largest lake, straddling the border between Kazakhstan and Uzbekistan, lay the sand dunes of the Aralkum Desert. In the not so distant past, this harsh environment was actually the bed of one of the largest lakes in the world – the Aral Sea.
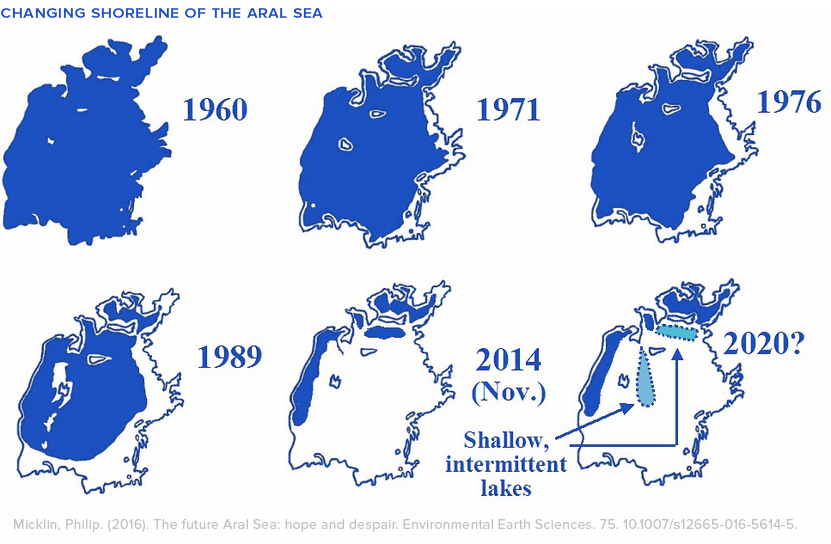
For reasons both climatic and anthropogenic, the Aral Sea began receding in the 1960s. This dramatic change in surface area took the Aral Sea from the fourth largest lake on Earth to not even ranking in the top 50. Researchers note that the size of the lake has fluctuated a lot over history, but through the lens of modern history these recent changes happened rapidly, leaving local economies devastated and former shoreside towns landlocked.
Lake Chad, in Saharan Africa, and Lake Urmia, in Iran, both face similar challenges, shrinking dramatically in recent decades.
How we work to reverse damage and avoid ecosystem collapse in vulnerable lakes will have a big influence on how the top 25 list may look in future years.


Environment
3 Ways the Shipping Industry is Addressing Climate Change
The shipping industry is responsible for 2.89% of all carbon emissions. Here are three ways it could evolve to address climate change.


3 Ways the Shipping Industry is Addressing Climate Change
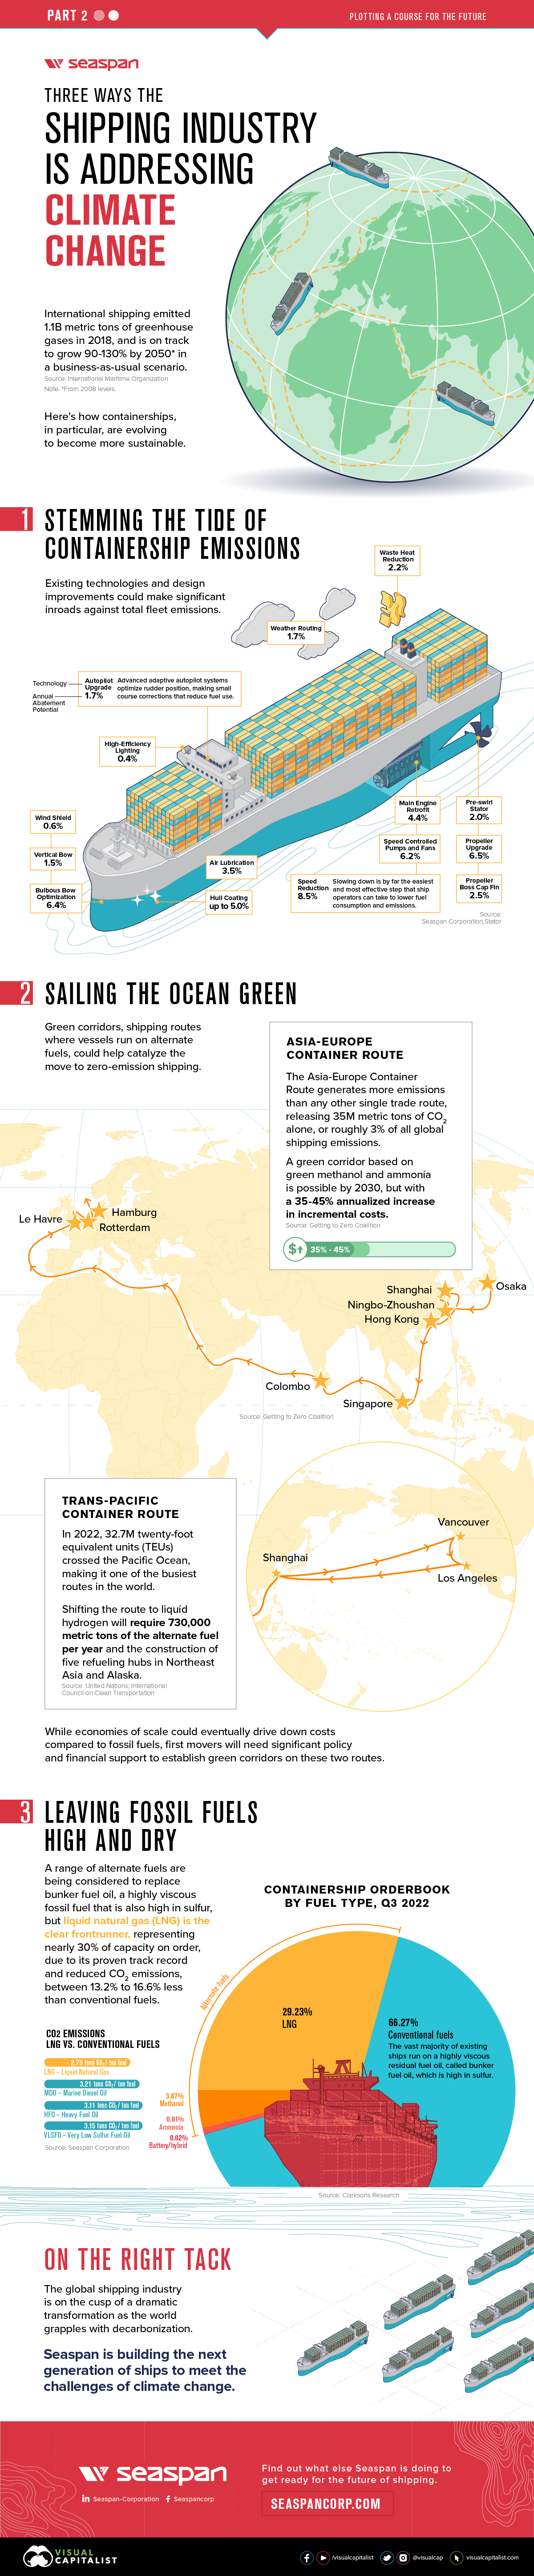
The global shipping industry is on the verge of a transformation not seen since the transition from sail to steam.
In 2018, the industry emitted 1.1 billion metric tons of greenhouse gas emissions, representing 2.89% of all anthropogenic, or human-caused, emissions. And according to the International Maritime Organization (IMO) that could increase 90-130% in 2050, from a 2008 baseline.
This is the second and final part of The Shipping Industry: Plotting a Course for the Future, a two-part series from our sponsor Seaspan Corporation, that looks at three ways that containerships in particular, could evolve to become more sustainable.
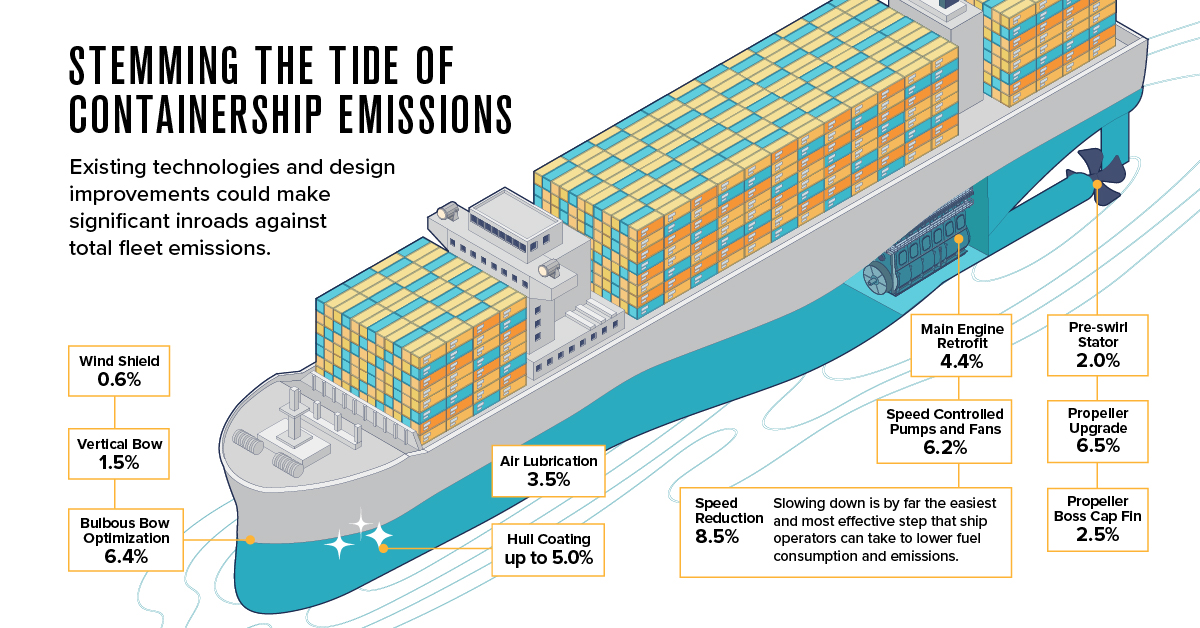
1. Stemming the Tide of Containership Emissions
Unlike personal transport, which has a proven and commercially scalable technology in electric vehicles, there’s no silver bullet for shipping. However, existing technologies and design improvements could help make significant inroads against total fleet emissions.
According to data from Seaspan, propeller upgrades (6.5%), hull coatings (up to 5.0%), and main engine retrofits (4.4%) won’t bring emissions to zero on their own, but taken together they add up to big savings.
| Technology | Annual Abatement potential |
|---|---|
| Speed reduction | 8.5% |
| Propeller Upgrade | 6.5% |
| Bulbous bow optimization | 6.4% |
| Speed Controlled Pumps and Fans | 6.2% |
| Hull coating | 5.0% (up to) |
| Main engine retrofit | 4.4% |
| Air lubrication | 3.5% |
| Propeller boss cap fin | 2.5% |
| Waste Heat Reduction | 2.2% |
| Pre-swirl stator | 2.0% |
| Weather Routing | 1.7% |
| Autopilot Upgrade | 1.7% |
| Vertical bow | 1.5% |
| Wind shield | 0.6% |
| High-Efficiency Lighting | 0.4% |
Interestingly, the biggest potential impact could come from slowing down ships (8.5%), which lowers fuel consumption and as a consequence, emissions. In the race to net zero, slow and steady could very well win the race.
2. Sailing the Ocean Green
In the long run, though, design tweaks don’t address the elephant seal in the room, which is the industry’s reliance on fossil fuels. Ships that run on alternate fuels, like ammonia, methanol, and even wind-power, are all in development, but many of the technologies are still in the early stages.
To help spur development, a group of countries at COP26, the annual UN climate conference, committed to establishing green shipping corridors where vessels would run on alternate fuels. A total of 24 countries signed the Clydebank Declaration, including the U.S. and the UK, and together they hope to catalyze the shift to zero emission shipping.
3. Leaving Fossil Fuels High and Dry
Many ship owners and operators are looking at Liquid Natural Gas (LNG) as a transitional fuel, while alternate fuel technologies mature. LNG emits between 13.2% and 16.6% less CO2 than conventional bunker fuel oil, a highly viscous residual fuel that is high in sulfur, so it’s no surprise that LNG-powered containerships represent 29.23% of the existing orderbook.
But with all but 2.4% of the current global fleet running on fossil fuels, there is still a long journey ahead.
On the Right Tack
The 1997 Kyoto Protocol established the IMO as the forum for climate change action for the shipping industry, which many have criticized for not moving fast and far enough on climate change.
At the July 2023 meeting of the Marine Environment Protection Committee, the IMO adopted a new greenhouse gas strategy, which set “indicative checkpoints” for emission reductions for 2030 and 2040 in place of binding targets, and committed to hit net zero “by or around, i.e. close to 2050, taking into account different national circumstances.” The IMO also declined to put a price on carbon.
Even without firm targets, many industry players aren’t waiting to move on the climate emergency. Seaspan, the world’s largest independent charter owner and manager of containerships, is moving to green their fleet. They recently signed an agreement to retrofit 15 ships with dual-fuel engines that can also run on green methanol, with an option for 45 more.
Find out what else Seaspan is doing to get ready for the future of shipping.

-

 Energy4 weeks ago
Life Cycle Emissions: EVs vs. Combustion Engine Vehicles
We look at carbon emissions of electric, hybrid, and combustion engine vehicles through an analysis of their life cycle emissions.
-

 Green3 months ago
Mapped: Air Pollution Levels Around the World in 2022
Exploring 2022 average air pollution levels around the world by PM2.5 concentration.
-

 Maps10 months ago
Mapped: Countries With the Highest Flood Risk
Recent floods in Pakistan have affected more than 33 million people. Where is the risk of flooding highest around the world?
-
 Science11 months ago
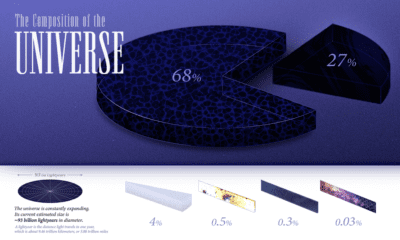
All the Contents of the Universe, in One Graphic
We explore the ultimate frontier: the composition of the entire known universe, some of which are still being investigated today.
-

 Environment11 months ago
Explained: The Relationship Between Climate Change and Wildfires
More carbon in the atmosphere is creating a hotter world—and gradually fueling both climate change and instances of wildfires.
-
 Environment12 months ago
5 Things to Know About Europe’s Scorching Heatwave
Smoldering temperatures are wreaking havoc across Europe. Here are 5 key things you should know about Europe’s current heatwave.


-

 Finance3 weeks ago
Visualized: The 100 Largest U.S. Banks by Consolidated Assets
-

 Automation1 week ago
Charted: Changing Sentiments Towards AI in the Workplace
-

 VC+3 weeks ago
What are Top Investment Managers Holding in Their Portfolios?
-

 Stocks1 week ago
The 50 Best One-Year Returns on the S&P 500 (1980-2022)
-

 United States3 weeks ago
Chart: U.S. Home Price Growth Over 50 Years
-

 Cities1 week ago
Mapped: The Most Dangerous Cities in the U.S.
-

 Energy3 weeks ago
How Old Are the World’s Nuclear Reactors?
-

 Countries7 days ago
Mapped: World’s Top 40 Largest Military Budgets