History
Vintage Viz: China’s Export Economy in the Early 20th Century
View the full-resolution version of this infographic
Vintage Viz: China’s Export Economy in the Early 20th Century
“The past is a foreign country; they do things differently there” is the oft-quoted first line of L.P. Hartley’s 1953 novel, The Go-Between.
A statement that is as profound as it is banal. In other words, when we do history, we’re a bit like tourists. If we really want to understand the past, we have to think like a local.
The infographic above, Aspects of Principal Exports of Chinese Goods to Foreign Countries, is the first in a series that we’re calling Vintage Viz, which presents a historical visualization along with the background and analytical tools to make sense of it.
Today, the People’s Republic of China is the second largest economy in the world, a permanent member of the UN Security Council, and a growing military power. But at the dawn of the 20th century, things were much, much different.
Opium and the Opening of China to the West
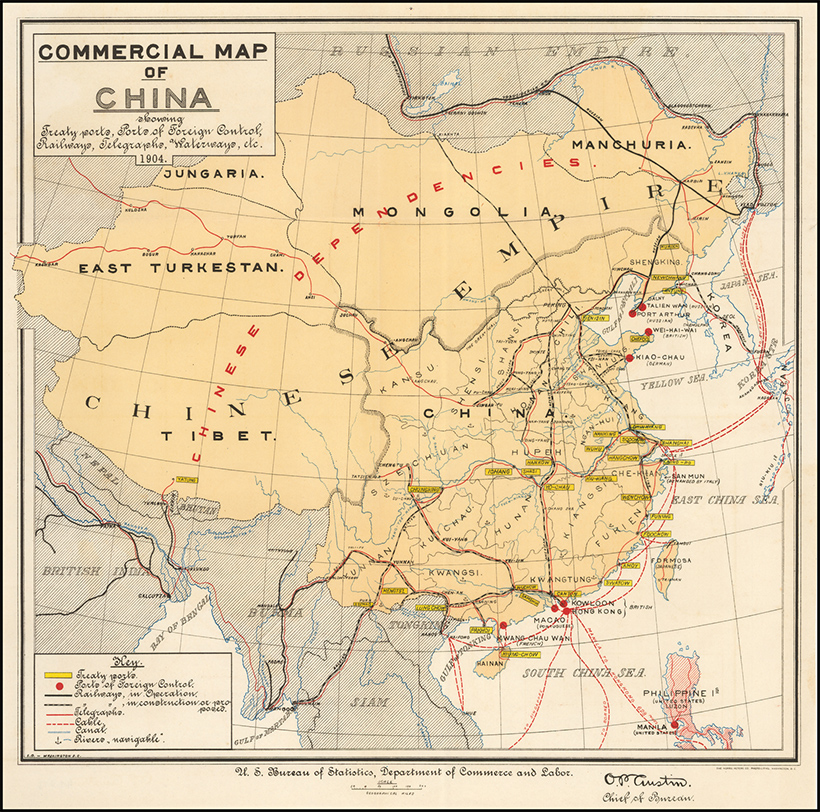
Early Sino-Western trade was restricted by the Qing emperors to three ports, and after 1757, just one, in what became known as the Canton System. This name came from the one remaining port city of the same name, present-day Guangzhou.
Foreign trade was tightly monitored and subject to stiff tariffs, and Western traders chafed under these restrictions. So when in 1839, Chinese authorities moved to shut down opium smuggling—an important source of profit for foreign merchants—Western powers saw their chance and used the pretext to revise the terms of trade by force.
In what became known as the Opium Wars, 1839-1842 and 1856-1860, first Great Britain and then an Anglo-French alliance defeated imperial China and imposed punitive treaties that included indemnities and lowered tariffs, but also expanded the number of ports open to foreign traders, first to five and by 1911, to more than 50.
Westerners were exempted from local laws, Christian missionaries were allowed to proselytize freely, and the opium trade was legalized. Hong Kong was also ceded to Great Britain at this time.
The Treaty Port Era, also known as the Century of Humiliation, was perhaps too much for the country to bear. The weakened central government was beset by popular unrest, including the Taiping Rebellion (1850–64), which killed 20 million people, and the Boxer Rebellion (1899-1901), so-named for the secret society that led the movement, the Righteous and Harmonious Fists.
Eventually, the last Chinese emperor was deposed and a republic declared in 1911. Nevertheless, the government was too weak to impose its will, and was repeatedly challenged by warlords.
So as we approach the outbreak of the First World War in 1914, and the period covered by our visualization, we find China weakened internally by civil strife, and externally by Western powers.
The History of this Century-Old Pie Chart
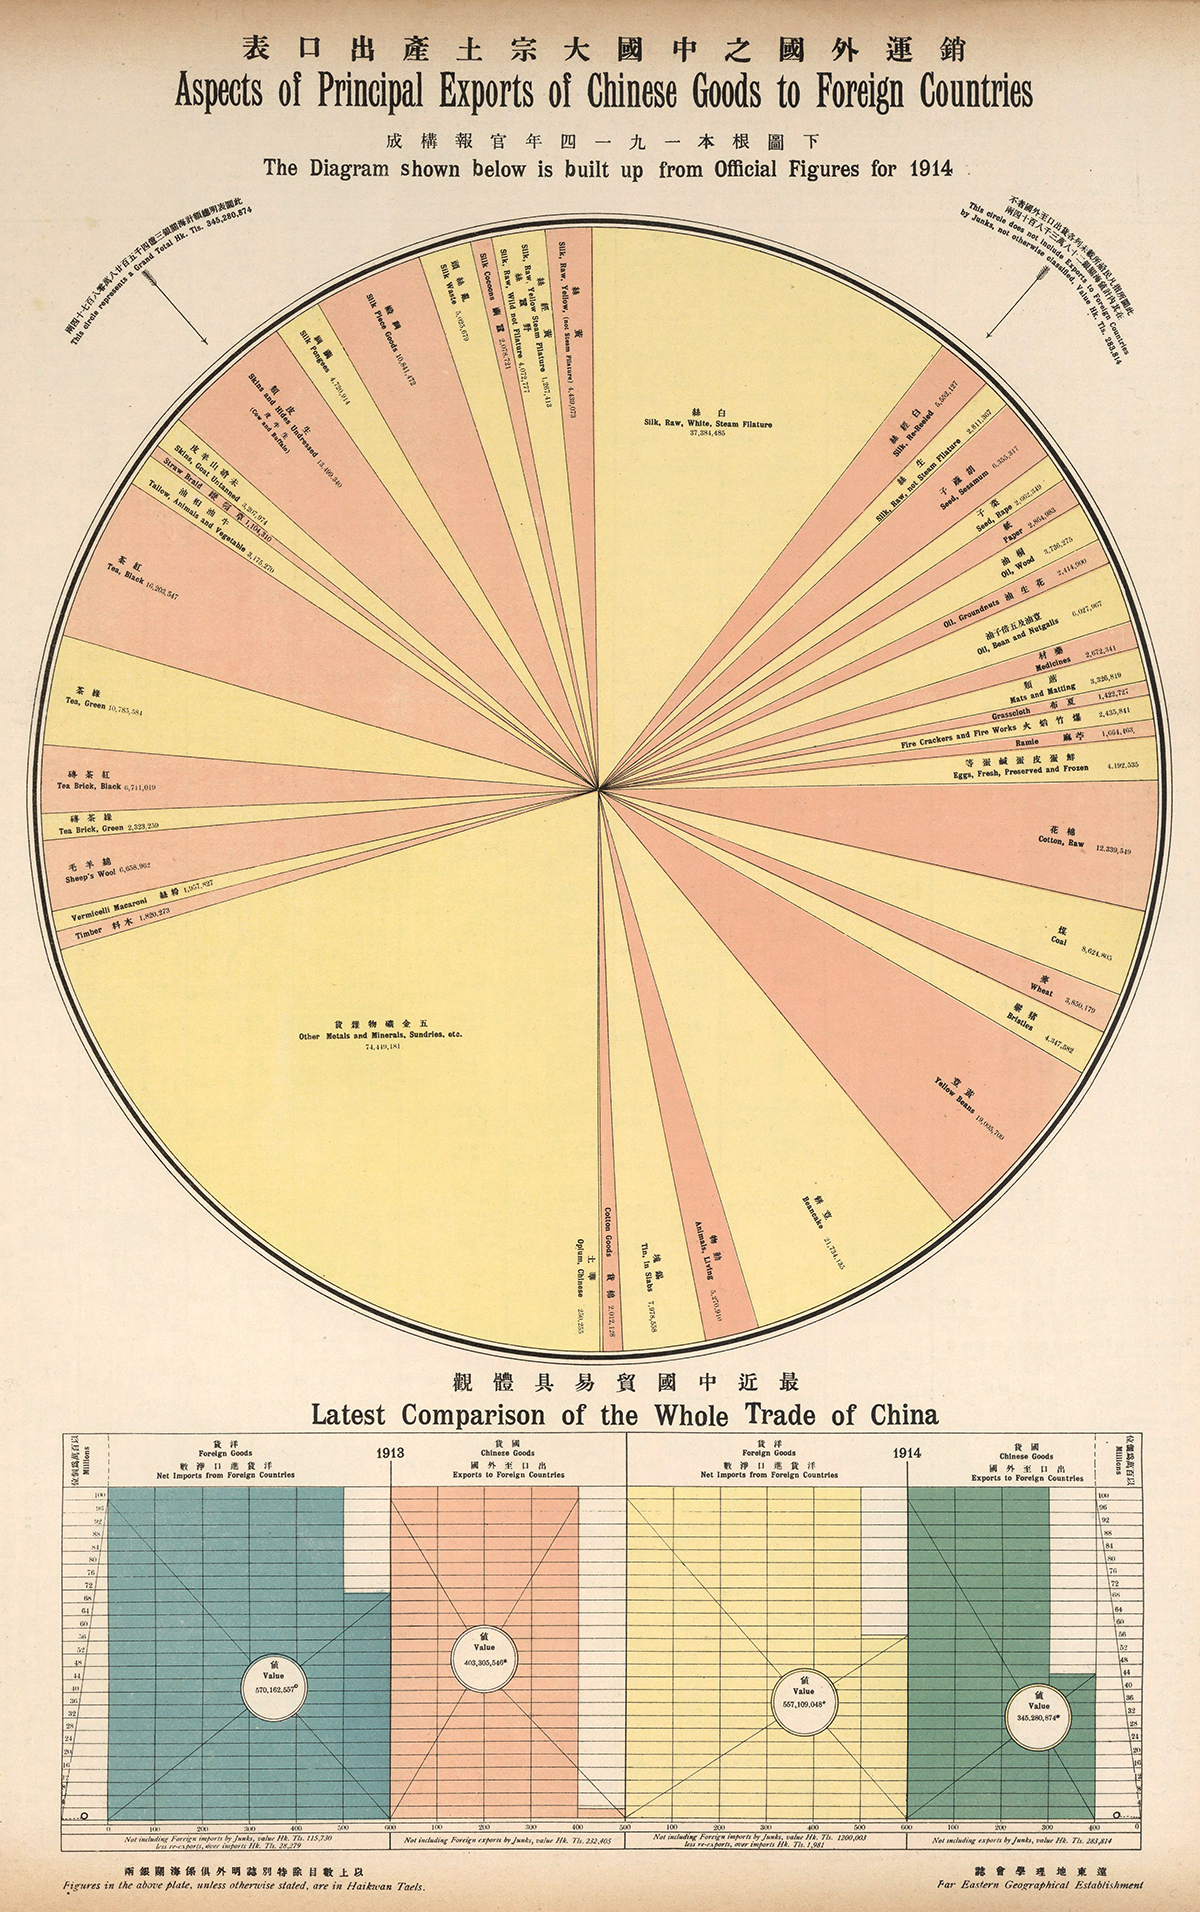
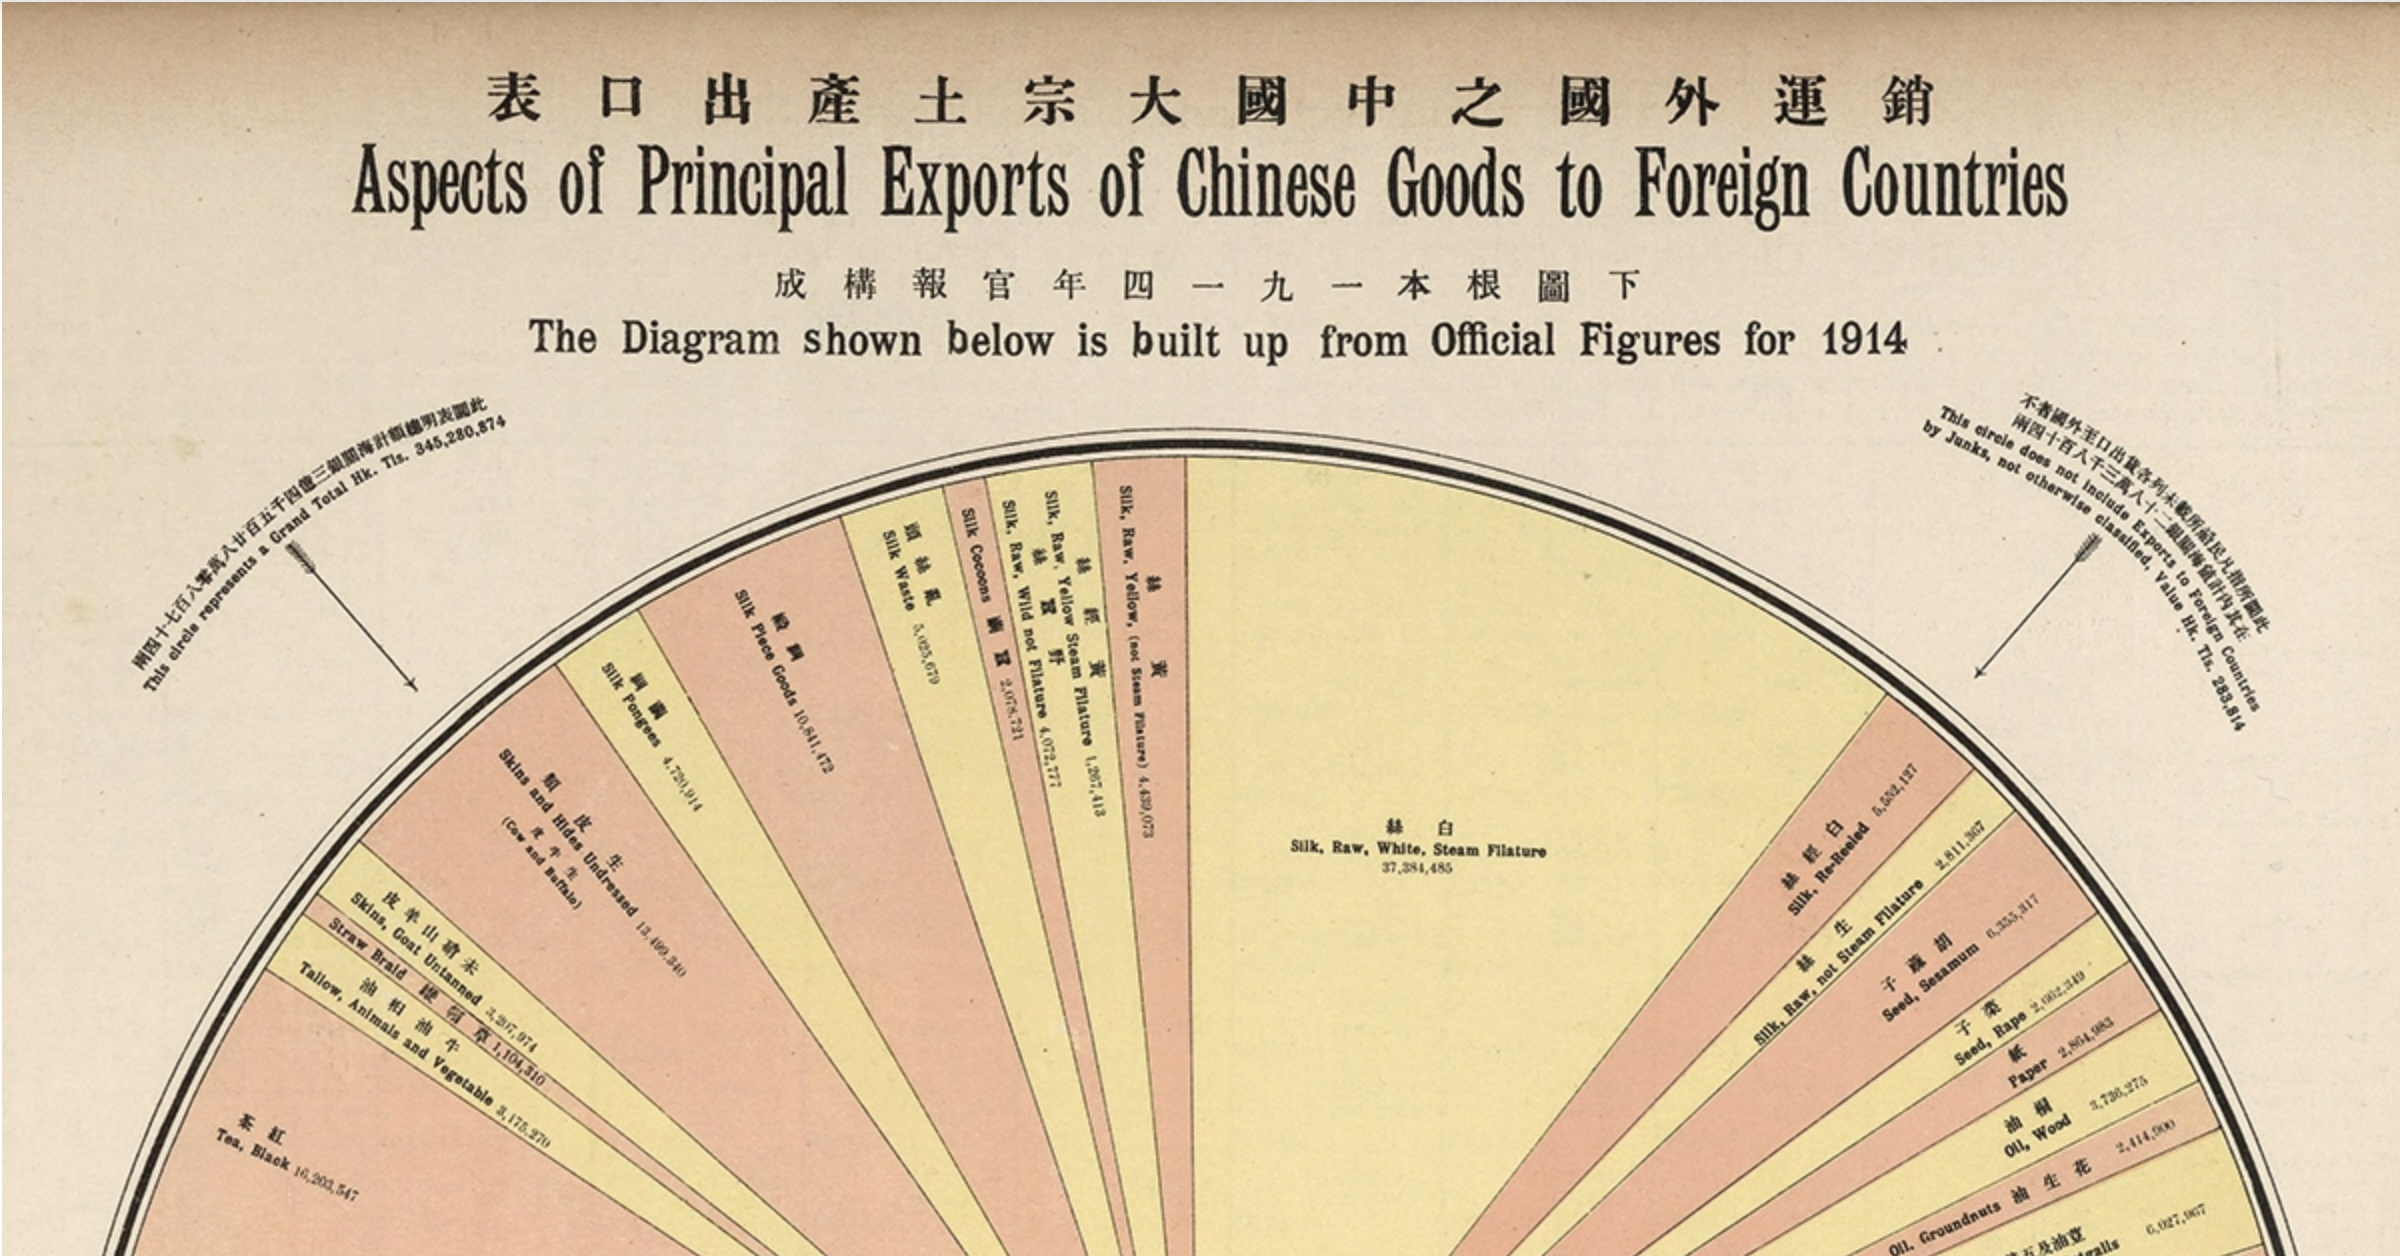
Aspects of Principal Exports of Chinese Goods to Foreign Countries captures Chinese exports for 1914, and comes from The New Atlas and Commercial Gazetteer of China: A Work Devoted to Its Geography & Resources and Economic & Commercial Development.
Originally published in 1917 and edited by Edwin J. Dingle for the Far Eastern Geographical Establishment, the volume contains a wealth of data for the period. According to the book’s Preface, it “seeks to give all the information that is essential to the business-man in regard to a country… about which less is known than in regard to any similar area in the world.”
The visualization breaks down total Chinese exports for 1914 in haikwan taels (hk. tls.), a unit of silver currency used to collect tariffs. In 1907, one haikwan tael was worth $0.79 U.S. dollars.
Official figures come from the Chinese Maritime Customs Service. This was set up by foreign consuls after the First Opium War to collect tariffs to guarantee the payment of treaty indemnities.
Exports in 1914 represented 345 million hk. tls., a 14.4% decrease from 1913, likely owing to the outbreak of the First World War that same year.
Apart from “Other Metals and Minerals, Sundries, etc,” which served as a catch-all category, the largest categories were silks and teas of various types, representing 22.6% and 10.4% of total exports respectively.
| Export Item | Value (hk. tls.) |
|---|---|
| Animals, Living | 5,270,910 |
| Beancake | 21,734,135 |
| Bristles | 4,347,582 |
| Coal | 8,624,805 |
| Cotton Goods | 2,012,128 |
| Cotton, Raw | 12,339,549 |
| Eggs, Fresh, Preserved and Frozen | 4,192,535 |
| Fire crackers and fire works | 2,435,841 |
| Grasscloth | 1,422,727 |
| Mats and Matting | 3,326,819 |
| Medicines | 2,672,341 |
| Oil, Bean and Nutgalls | 6,027,967 |
| Oil, Groundnuts | 2,414,900 |
| Oil, Wood | 3,736,275 |
| Opium, Chinese | 250,255 |
| Other Metals and Minerals, Sundries, etc | 74,449,181 |
| Paper | 2,864,983 |
| Ramie | 1,664,463 |
| Seed, Rape | 2,662,349 |
| Seed, Sesamum | 6,355,317 |
| Sheep’s Wool | 6,658,962 |
| Silk Cocoons | 2,078,721 |
| Silk Piece Goods | 10,841,472 |
| Silk Pongees | 4,720,914 |
| Silk Waste | 5,025,679 |
| Silk, Raw, not Steam Filature | 2,811,367 |
| Silk, Raw, White, Steam Filature | 37,384,485 |
| Silk, Raw, Wild not Filatures | 4,072,777 |
| Silk, Raw, Yellow Steam Filatures | 1,267,413 |
| Silk, Raw, Yellow, (not Steam Filature) | 4,439,073 |
| Silk, Re-Reeled | 5,552,127 |
| Skins and Hides Undressed (Cow and Buffalo) | 13,499,340 |
| Skins, Goat Untanned | 3,207,974 |
| Straw Braid | 1,104,310 |
| Tallow, Animals and Vegetables | 3,175,270 |
| Tea Brick, Black | 6,711,019 |
| Tea Brick, Green | 2,323,259 |
| Tea, Black | 16,203,547 |
| Tea, Green | 10,785,584 |
| Timber | 1,820,273 |
| Tin, in Slabs | 7,978,558 |
| Vermicelli Macaroni | 1,957,827 |
| Wheat | 3,850,179 |
| Yellow Beans | 19,005,709 |
| Total | 345,280,901 |
Below are some more details that emerge from this visualization.
All the Tea in China
The Chinese tea trade was the subject of another visualization in the Atlas. It shows that China had been steadily losing ground to British India. Between 1888-1892 Chinese exports to Great Britain were 242 million pounds against India’s 105 million pounds. By 1912-1913, India had surpassed China to export 279 million pounds against 198 million pounds.
In 1914, the majority of Chinese exports went to Russia, 902,716 piculs in all. A picul is equal to “as much as a man can carry on a shoulder-pole” or about 133 pounds.
The Silk Road to Profits
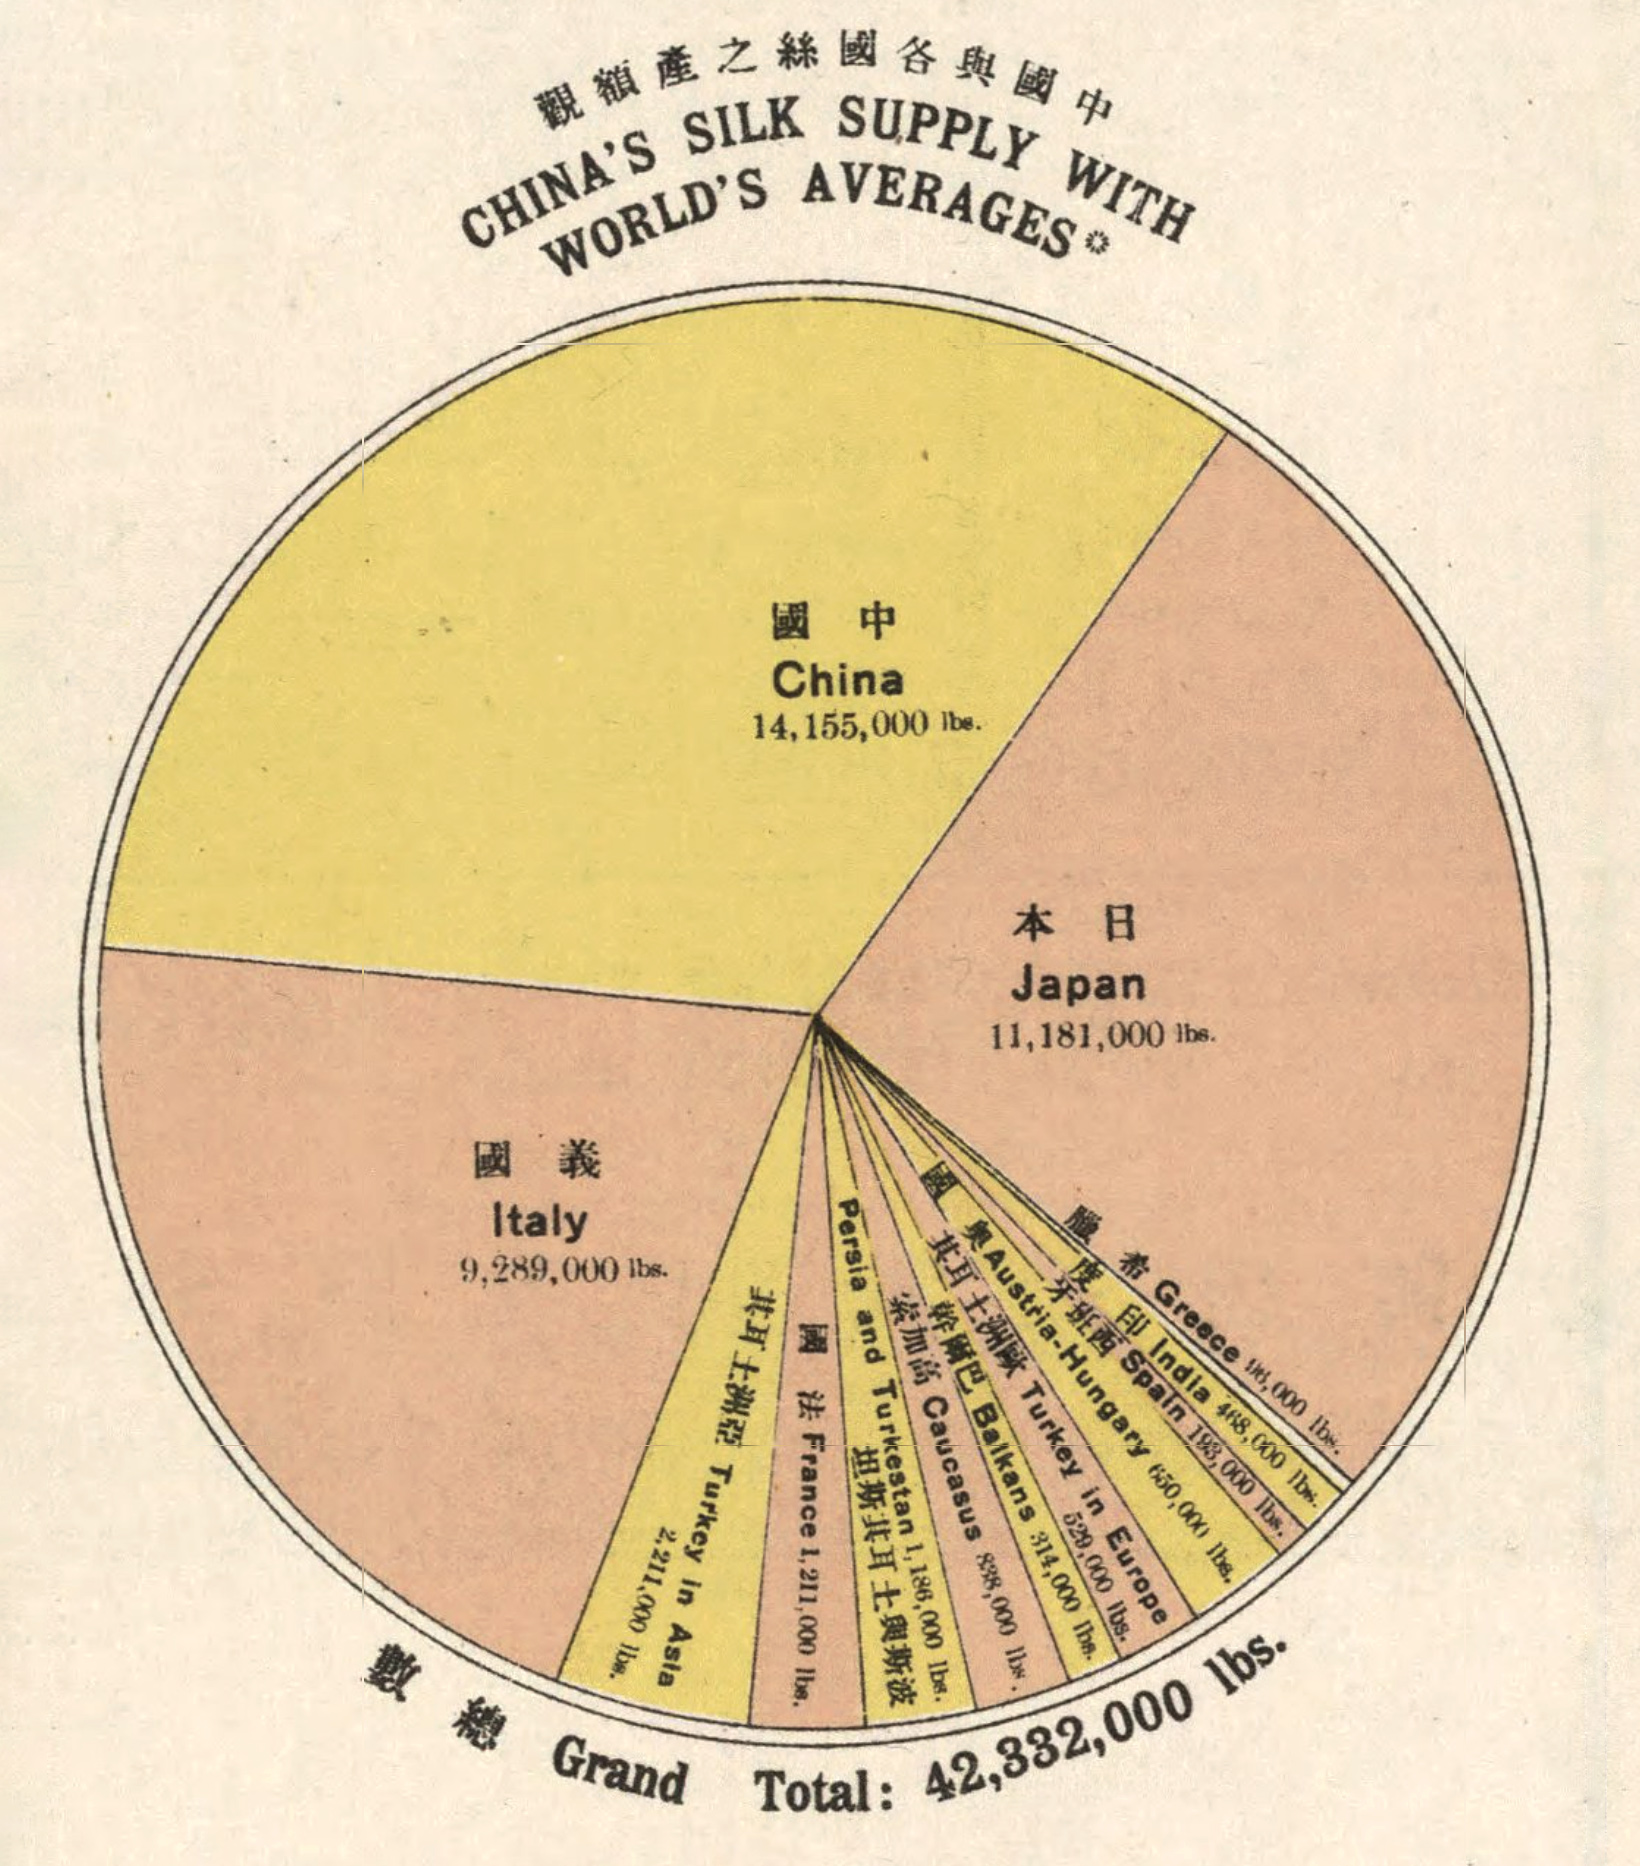
Silk has long been in demand in the West as a luxury good, giving its name to the overland trade route that connected East and West for centuries: the Silk Road.
In 1914, China was the largest producer and exporter of silks in the world. On an annual basis, China averaged 14 million pounds, compared to the number two spot, Japan, at 11 million pounds, and number three, Italy, at 9 million pounds. Together, these three controlled 81.7% of the global silk trade.
The Opium of the Masses?
The opium trade, the pretext that opened China to foreign trade, was still big money in 1914.
A total of 37 million hk. tls. were imported in 1914 from India, up 11.9% from 1908. This is actually down from a peak of 41 million hk. tls. in 1913.
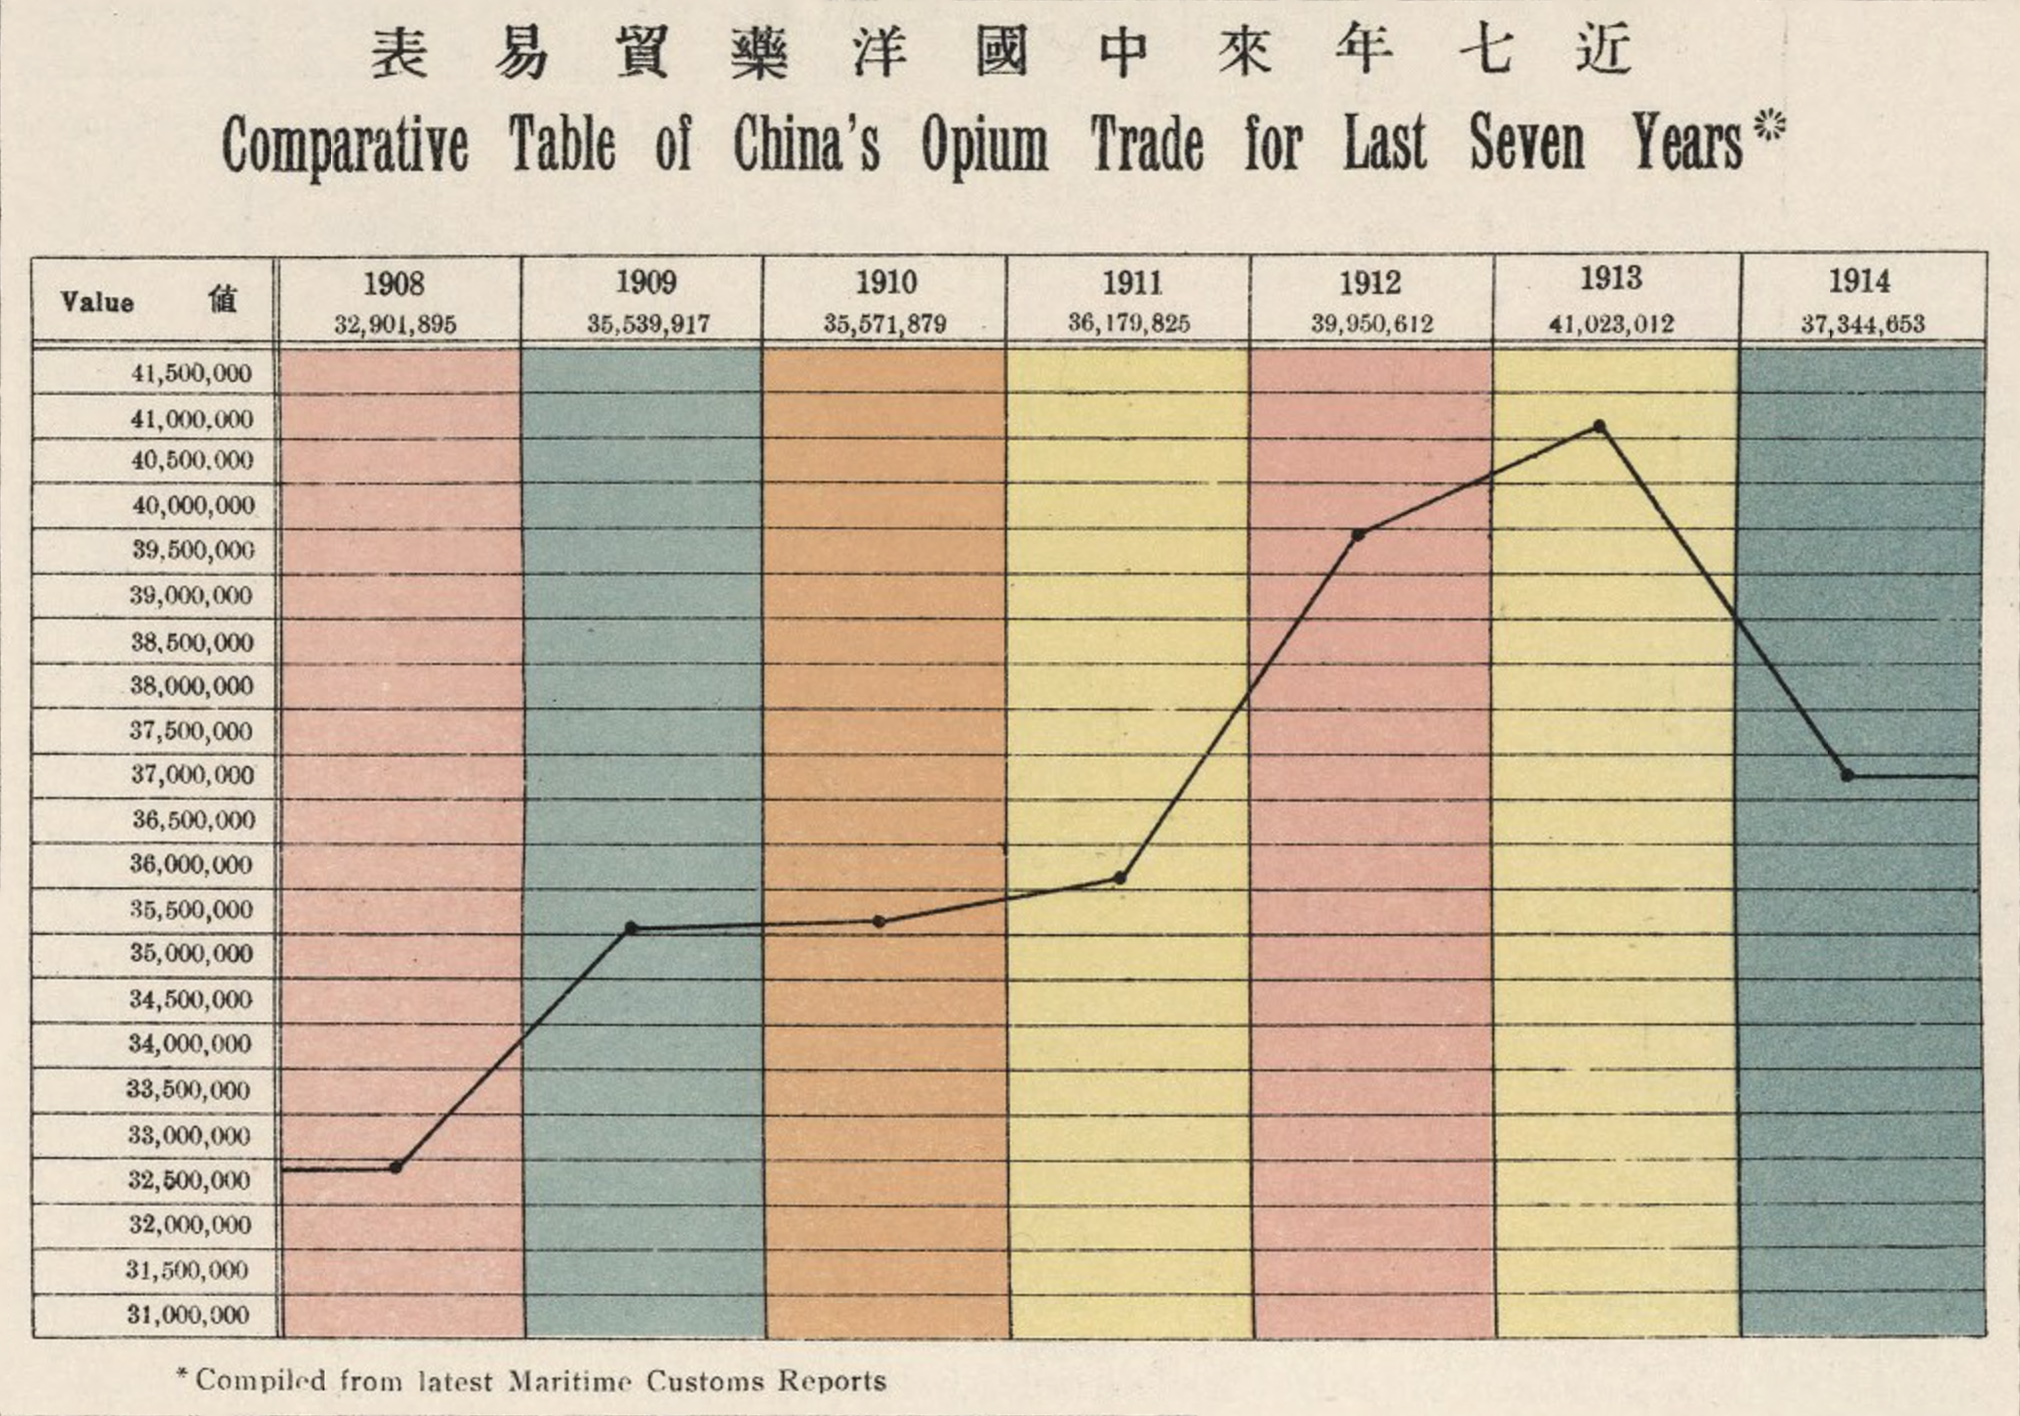
In 1907, China signed the Ten Year Agreement with India, which ultimately phased out the opium trade. By 1917 the trade was all but extinguished.
Back to the Future
The Aspects of Principal Exports of Chinese Goods to Foreign Countries is a far cry from the contemporary trade picture. China’s top export in 2021 was in the category “telephones for cellular networks or other wireless networks,” and was worth $147.1 billion.
But it’s worth noting that China today is a direct result of this period. The resentment created during the Century of Humiliation would eventually help lead to Mao Zedong, the Long March, and the establishment of the People’s Republic of China.
And in 1979, the Chinese central government would set up the first of their own “treaty ports,” in the form of special economic zones, places where foreign companies could set up shop. But this time, it wasn’t foreign powers who were making the rules.


Maps
Vintage Viz: The World’s Rivers and Lakes, Organized Neatly
Rivers and lakes have played important roles throughout history. This Vintage Viz looks at these bodies of water from the viewpoint of 1850.
Vintage Viz: The World’s Rivers and Lakes, Organized Neatly
Rivers and lakes have borne witness to many of humanity’s greatest moments.
In the first century BCE, the Rubicon not only marked the border between the Roman provinces of Gaul and Italia, but also the threshold for civil war. From the shores of Lake Van in 1071, you could witness the Battle of Manzikert and the beginning of the end for the Byzantine Empire.
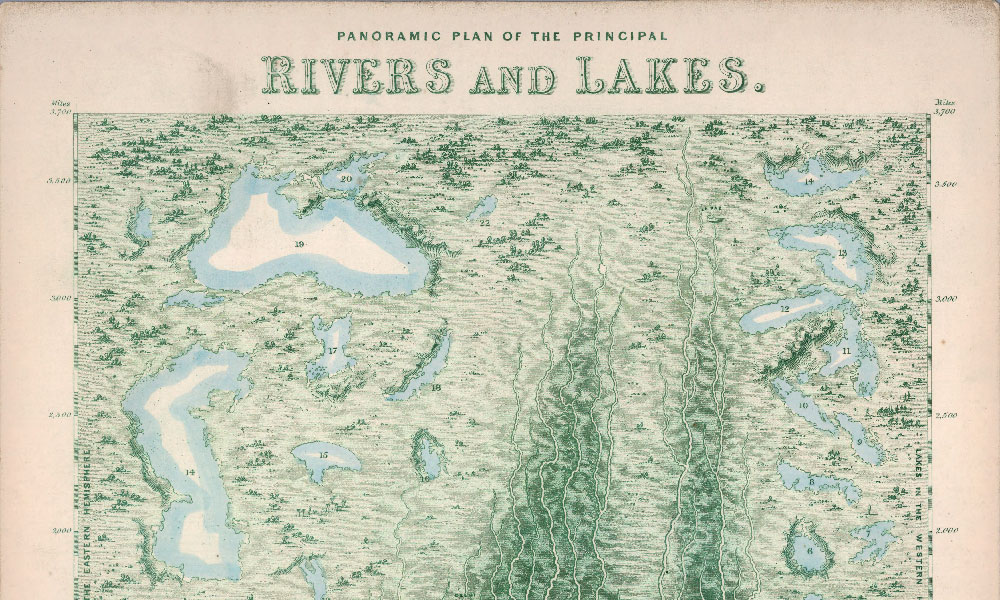
Rivers carry our trade, our dead, and even our prayers, so when London mapmaker James Reynolds partnered with engraver John Emslie to publish the Panoramic Plan of the Principal Rivers and Lakes in 1850, he could be sure of a warm reception.
The visualization, the latest in our Vintage Viz series, beautifully illustrates 42 principal rivers in Europe, Asia, Africa, and the Americas, along with 36 lakes across the Eastern and Western hemispheres. Each river has been unraveled and straightened onto an imaginary landscape-–no meandering here—and arranged by size. Major cities are marked by a deep orangy-red.
Top 3 Longest Principal Rivers (in 1850)
According to this visualization, the Mighty Mississippi is among the world’s longest, coming in at 3,650 miles, followed by the Amazon, the Nile, and the Yangtze river in China. The bottom three are the Tay in Scotland (125 miles), the Shannon in Ireland (200 miles), and the Potomac in the U.S. (275 miles).
Surveying methods have come a long way since 1850, and we now have satellites, GPS, and lasers, so we can update these rankings. According to the CIA World Factbook, the Nile (6,650 km / 4,132 miles), the Amazon (6,436 km / 3,998 miles), and the Yangtze (6,300 km / 3,915 miles) are the world’s top three longest rivers.
The table below shows the rivers in the graphic above compared with today’s measurements, as well as the general location of rivers using 1850 location names (including modern day locations in brackets).
| River | Territory | Viz length (miles) | Modern length (miles) |
|---|---|---|---|
| Mississippi | United States | 3,650 | 2,340 |
| Amazon | Brazil | 3,350 | 3,998 |
| Nile | Egypt and Abyssinia (Ethiopia) | 3,325 | 4,132 |
| Yangtse | China | 3,300 | 3,915 |
| Hoang-ho | China | 3,025 | 3,395 |
| Obi | Siberia | 2,800 | 2,268 |
| La Plata | La Plata (Argentina/Uruguay) | 2,450 | 3,030 |
| Volga | Russia | 2,200 | 2,193 |
| Burrampoota | Tibet | 2,200 | 1,800 |
| Ganges | Hindostan (India) | 1,975 | 1,569 |
| Euphrates | A(siatic) Turkey | 1,850 | 1,740 |
| Danube | Germany | 1,800 | 1,770 |
| Niger | Nigeria | 1,750 | 2,600 |
| Indus | Caubul etc (Afghanistan etc) | 1,700 | 1,988 |
| McKenzie | Indian Territory (Canada) | 1,600 | 1,080 |
| Senegal | Senegambia (Senegal) | 1,450 | 1,020 |
| Dnieper | Russia | 1,375 | 1,367 |
| Oronoco | Gran Colombia (Venezuela) | 1,325 | 1,700 |
| Gambia | Senegambia (The Gambia) | 1,300 | 740 |
| Bravo del Norta (Rio Grande) | Mexico | 1,150 | 1,900 |
| St. Lawrence | Canada | 1,125 | 1,900 |
| Orange | Namaqualand (Namibia/South Africa) | 1,100 | 1,367 |
| Dwina | Russia | 1,000 | 1,020 |
| Don | Russia | 975 | 1,198 |
| Rhine | Germany | 850 | 766 |
| Elbe | Germany | 750 | 724 |
| Vistula | Poland | 650 | 651 |
| Oder | Prussia (Germany) | 625 | 529 |
| Colorando | La Plato (United States) | 600 | 1,450 |
| Tague | Spain and Portugal | 575 | 626 |
| Susquehana | United States | 575 | 464 |
| Rhone | France | 550 | 505 |
| Seine | France | 475 | 485 |
| Po | North Italy | 450 | 405 |
| Hudson | United States | 425 | 315 |
| Ebro | Spain | 400 | 565 |
| Severn | England | 350 | 220 |
| Delaware | United States | 325 | 301 |
| Potomac | United States | 275 | 405 |
| Thames | England | 275 | 215 |
| Shannon | Ireland | 200 | 224 |
| Tay | Scotland | 125 | 117 |
These figures are a unique look into a time period where humanity’s efforts to quantify the world were still very much a work in progress.
Editor’s note: Some of the rivers and lakes are spelled slightly differently in 1850 than they are today. For example, the map notes today’s Mackenzie River (Canada) as the McKenzie River, and the Yangtze River (China) as the Yangtse.
O Say, Can You Sea?
The largest ‘lake’ in this visualization is the Caspian Sea (118,000 sq. miles), followed by the Black Sea (113,000 sq. miles), and the greatest of the Great Lakes, Lake Superior (22,400 sq. miles). While the Caspian Sea is considered a saltwater lake and could reasonably have a place here, the Black Sea—possibly bearing that name because of the color black’s association with “north”—is not a lake by any stretch of the imagination.
And while many of the surface areas reported could also be updated with modern estimates, the story behind Lake Chad (called Ichad in the visualization), the Aral Sea, and the Dead Sea are altogether different. Human development, unsustainable water use, and climate change have led to dramatic drops in water levels.
The Dead Sea in particular had a surface area of 405 sq. miles (1,050 km2) in 1930, but has since dropped to 234 sq. miles (606.1 km2) in 2016.
| Lake | Territory | Viz surface area (sq. miles) | Modern surface area (sq. miles) |
|---|---|---|---|
| Caspian Sea | Russia | 118,000 | 143,000 |
| Black Sea | Turkey | 113,000 | 168,500 |
| Superior | North America | 22,400 | 31,700 |
| Huron | North America | 15,800 | 23,007 |
| Michigan | North America | 12,600 | 22,404 |
| Great Slave | North America | 12,000 | 10,500 |
| Aral Sea | Tartary (Central Eurasia) | 11,650 | 6,900 |
| Ichad | Africa | 11,600 | 590 |
| Azov | Russia | 8,800 | 14,500 |
| Baikal Sea | Siberia | 8,000 | 12,248 |
| Winnepeg | North America | 7,200 | 9,416 |
| Maracaibo | South America | 6,000 | 5,130 |
| Titicaca | South America | 5,400 | 3,030 |
| Ladoga | Russia | 5,200 | 6,700 |
| Balkash | Mongolia | 5,200 | 7,000 |
| Erie | North America | 4,800 | 9,910 |
| Ontario | North America | 4,450 | 7,340 |
| Great Bear | North America | 4,000 | 12,028 |
| Orega | Russia | 3,300 | 3,700 |
| Athabasca | North America | 3,200 | 3,030 |
| Nicaragua | North America | 2,905 | 3,149 |
| Otehenantekane | North America | 2,500 | 2,500 |
| Wener | Sweden | 2,100 | 2,181 |
| Winnepagos | North America | 2,000 | 2,070 |
| Zaizan | Mongolia | 1,600 | 700 |
| Dembia | Abyssinia (Ethiopia) | 1,300 | 1,418 |
| Tonting | China | 1,200 | 1,090 |
| Wetter | Sweden | 945 | 738 |
| Orebo | Sweden | 900 | 186 |
| Ouroomia | Persia | 900 | 1,126 |
| Enare | Lapland (Finland) | 870 | 1,040 |
| Constance | Scotland | 456 | 209 |
| Geneva | Swtizerland | 400 | 224 |
| Dead Sea | Syria | 370 | 605 |
| Lough Neagh | Ireland | 80 | 153 |
| Loch Lomond | Scotland | 27 | 27 |
You Can’t Step in the Same River Twice
Over time, natural and anthropogenic forces cause rivers to change their course, and lakes to shift their banks. If Reynolds and Emslie were alive today to update this visualization, it would likely look quite different, as would one made 100 years from now. But so goes the river of time.

-

 Investor Education4 weeks ago
Visualizing BlackRock’s Top Equity Holdings
-

 apps2 weeks ago
Meet the Competing Apps Battling for Twitter’s Market Share
-

 China14 hours ago
How Do Chinese Citizens Feel About Other Countries?
-

 Markets4 weeks ago
Visualizing Every Company on the S&P 500 Index
-

 Markets2 weeks ago
Visualizing 1 Billion Square Feet of Empty Office Space
-

 Environment4 weeks ago
Life Cycle Emissions: EVs vs. Combustion Engine Vehicles
-

 Maps2 weeks ago
Vintage Viz: The World’s Rivers and Lakes, Organized Neatly
-

 United States3 weeks ago
Visualized: The 100 Largest U.S. Banks by Consolidated Assets