Markets
Visualized: The State of the U.S. Labor Market
Visualized: The State of the U.S. Labor Market
This was originally posted on Advisor Channel. Sign up to the free mailing list to get beautiful visualizations on financial markets that help advisors and their clients.
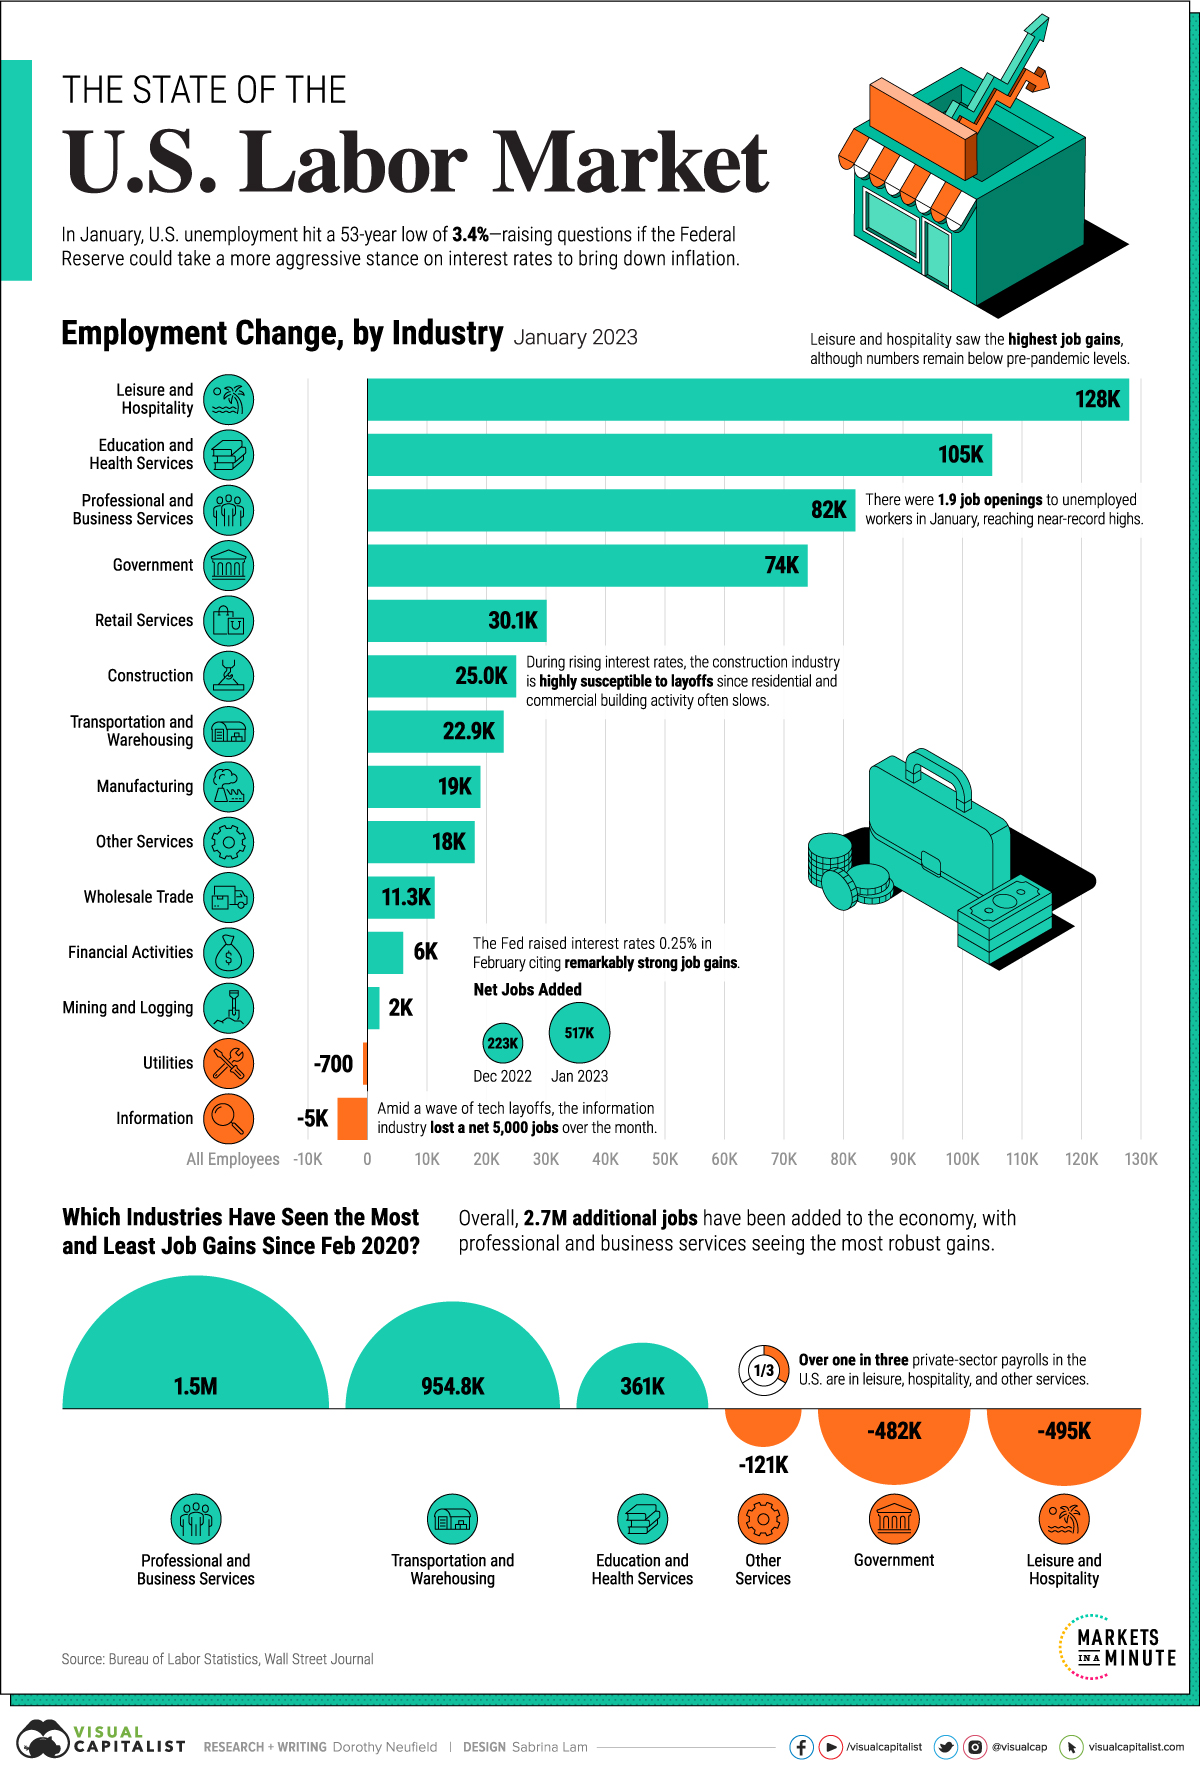
The last time the U.S. labor market was this strong was in 1969.
Unemployment fell to 3.3%, incomes were soaring to historic levels, and inflation was rising at a fast clip. Like today, the Federal Reserve was tightening monetary policy to stifle inflation. Yet much of the wage increases were washed out by rising consumer prices.
The above graphic looks at the industries driving today’s robust job market using data from the Bureau of Labor Statistics. Later, we look into the impact on inflation, and whether today’s market can be sustained.
What is Driving the U.S. Labor Market?
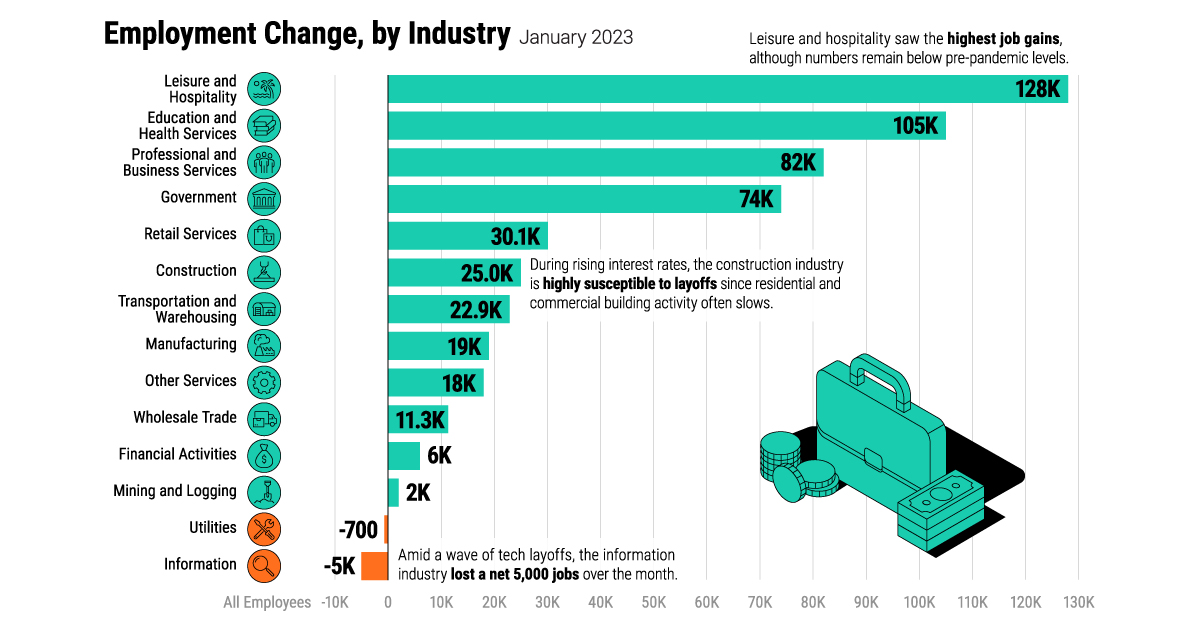
Broadly, service-led industries witnessed the highest share of job growth in January.
Still, as the table below shows, a key part of the services sector—leisure and hospitality employment—remains under pre-pandemic levels. A similar trend is seen in retail services.
| Rank | Industry | Job Growth Jan 2023 | Job Growth Since 2020 |
|---|---|---|---|
| 1 | Leisure and Hospitality | 128K | -495K |
| 2 | Education and Health Services | 105K | 361K |
| 3 | Professional and Business Services | 82K | 1,475K |
| 4 | Government | 74K | -482K |
| 5 | Retail Services | 30K | -37K |
| 6 | Construction | 25K | 276K |
| 7 | Transportation and Warehousing | 23K | 955K |
| 8 | Manufacturing | 19K | 214K |
| 9 | Other Services | 18K | -121K |
| 10 | Wholesale Trade | 11K | 148K |
| 11 | Financial Activities | 6K | 245K |
| 12 | Mining and Logging | 2K | -55K |
| 13 | Utilities | -1K | 8K |
| 14 | Information | -5K | 211K |
Adding 1.5 million jobs since 2020 is professional and business services, the highest overall. This sector covers legal, accounting, veterinary, engineering and other specialized services.
We are also seeing strong gains in transportation and warehousing. Last year, the sector added an average of 23,000 jobs, totaling almost 955,000 over the course of the pandemic. Today, trucking jobs exceed 2019 levels and warehouse employment is roughly 50% higher.
Although manufacturing hasn’t seen the highest gains, the sector has one of the lowest unemployment rates across job sectors, at 2.4%. Yet the industry faces an acute labor shortage—if every skilled unemployed worker were to fill open job vacancies, a third of jobs in durable manufacturing would remain open.
Cooling Wage Growth
Despite rock-bottom unemployment numbers, wage growth is slowing. In January, it fell to 4.4% annually, down from a multi-decade high of 5.9% in March last year.
At the same time, wage growth falls below inflation by about 1%.
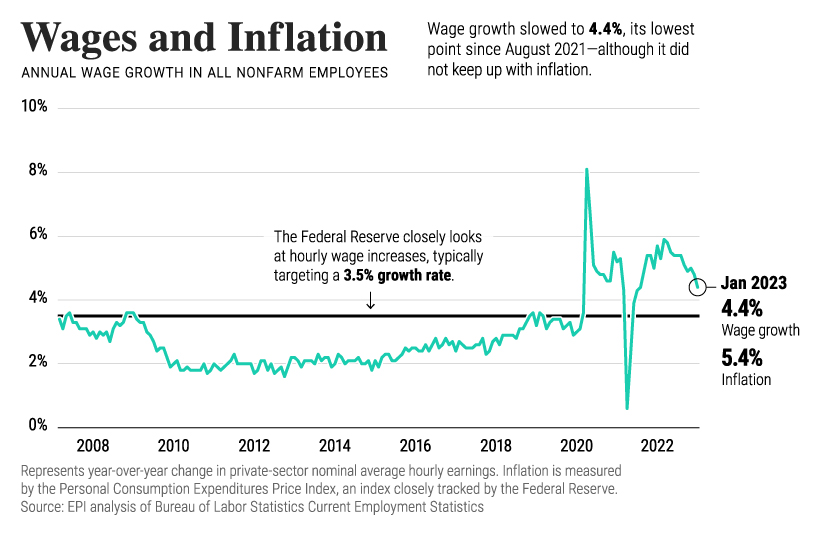
Wage growth is carefully watched by the Federal Reserve. Typically, their annual wage growth target is 3.5% to be compatible with 2% inflation.
In the current environment, this wage growth trend serves as a double-edged sword. As wage growth slows, workers are less likely to see wages keep up with inflation. On the other hand, slower wage growth could help prevent inflation from rising in the first place—and interest rates from climbing higher.
Where is the Job Market Heading?
The question on everyone’s minds is whether today’s job market will stay resilient.
According to Fitch Ratings, slowing aggregate demand in response to higher interest rates will begin to weigh on the U.S. labor market, and the 517,000 new jobs created in January—three times the level expected by analysts— won’t last long.
Eventually, both higher borrowing costs and elevated compensation costs could weigh on corporate profits. On the other hand, the pandemic has changed the labor market. Relief legislation may continue to buoy the job market and workers may also remain scarce as people retire or leave for other reasons.
Given how unemployment serves as a lagging indicator, the material effects in the economy will likely appear before cracks begin to show in the U.S. labor market.


Markets
The 50 Best One-Year Returns on the S&P 500 (1980-2022)
The highest one-year return among the top S&P 500 stocks from 1980 to 2022 was a staggering 2,620%. Which stocks top the ranks?

The Top S&P 500 Stocks by Annual Returns
The average annual return of the S&P 500 was 10% from 1980-2022, excluding dividends. Of course, there are some companies that deliver much higher returns in any given year.
In this graphic using data from S&P Dow Jones Indices, we explore the top S&P 500 stocks with the best single year returns over the last four decades.
Ranking the Top S&P 500 Stocks
In order to find the top gainers, S&P took the top 10 best-performing stocks each year and then narrowed that list down to the top 50 overall. They ranked the top S&P 500 stocks by price returns, meaning that no dividends or stock distributions were included.
The best gains were clustered in a few select years, including the 1999 dot-com boom, the 2003 stock market rally, and the 2009 recovery from the Global Financial Crisis. None of the biggest gains happened in 2021 or 2022.
| Rank | Company | Sector | Return | Year |
|---|---|---|---|---|
| 1 | Qualcomm | Information Technology | 2620% | 1999 |
| 2 | Tesla | Consumer Discretionary | 743% | 2020 |
| 3 | DSC Communications | Communication Services | 468% | 1992 |
| 4 | Coleco Industries | Consumer Discretionary | 435% | 1982 |
| 5 | Avaya | Information Technology | 428% | 2003 |
| 6 | Chrysler | Consumer Discretionary | 426% | 1982 |
| 7 | XL Capital (Axa XL) | Financials | 395% | 2009 |
| 8 | Tenet Healthcare | Healthcare | 369% | 2009 |
| 9 | Dynegy | Utilities | 361% | 2000 |
| 10 | Advanced Micro Devices | Information Technology | 348% | 2009 |
| 11 | Sprint | Communication Services | 343% | 1999 |
| 12 | Ford | Consumer Discretionary | 337% | 2009 |
| 13 | NEXTEL Communications | Communication Services | 336% | 1999 |
| 14 | LSI Logic | Information Technology | 319% | 1999 |
| 15 | NVIDIA | Information Technology | 308% | 2001 |
| 16 | Nortel Networks | Communication Services | 304% | 1999 |
| 17 | Etsy | Consumer Discretionary | 302% | 2020 |
| 18 | Genworth Financial | Financials | 301% | 2009 |
| 19 | Micron Technology | Information Technology | 300% | 2009 |
| 20 | NetFlix | Communication Services | 298% | 2013 |
| 21 | Oracle | Information Technology | 290% | 1999 |
| 22 | Western Digital | Information Technology | 286% | 2009 |
| 23 | Network Appliance (NetApp) | Information Technology | 270% | 1999 |
| 24 | Data General | Information Technology | 267% | 1991 |
| 25 | Yahoo | Communication Services | 265% | 1999 |
| 26 | Williams Companies | Energy | 264% | 2003 |
| 27 | Novell | Information Technology | 264% | 1991 |
| 28 | Dynegy | Utilities | 263% | 2003 |
| 29 | Sun Microsystems | Information Technology | 262% | 1999 |
| 30 | PMC-Sierra | Information Technology | 262% | 2003 |
| 31 | Advanced Micro Devices | Information Technology | 259% | 1991 |
| 32 | Dell | Information Technology | 248% | 1998 |
| 33 | Global Marine | Energy | 247% | 1980 |
| 34 | Micron Technology | Information Technology | 243% | 2013 |
| 35 | Best Buy | Consumer Discretionary | 237% | 2013 |
| 36 | Reebok | Consumer Discretionary | 234% | 2000 |
| 37 | Freeport-McMoRan | Materials | 229% | 2009 |
| 38 | Biomet (Zimmer Biomet) | Healthcare | 226% | 1991 |
| 39 | NVIDIA | Information Technology | 224% | 2016 |
| 40 | Gap | Consumer Discretionary | 223% | 1991 |
| 41 | NetFlix | Communication Services | 219% | 2010 |
| 42 | Fleetwood Enterprises (Fleetwood RV) | Consumer Discretionary | 217% | 1982 |
| 43 | National Semiconductor | Information Technology | 217% | 1999 |
| 44 | Dell | Information Technology | 216% | 1997 |
| 45 | Tandy Corp (RadioShack) | Information Technology | 216% | 1980 |
| 46 | Novell | Information Technology | 215% | 2003 |
| 47 | Corning | Information Technology | 215% | 2003 |
| 48 | CB Richard Ellis (CBRE) | Real Estate | 214% | 2009 |
| 49 | AES Corp | Utilities | 213% | 2003 |
| 50 | Expedia | Consumer Discretionary | 212% | 2009 |
Qualcomm was by far the top-performer in any one calendar year window. The company had key patents for Code Division Multiple Access (CDMA) technology, which enabled fast wireless internet access and became the basis for 3G networks.
Its stock took off in 1999 as it shed less profitable business lines, resolved a patent dispute with competitor Ericsson, and joined the S&P 500 Index. At the time, CNN reported that one lucky investor who heard about Qualcomm from an investment-banker-turned-rabbi earned $17 million—roughly $30 million in today’s dollars.
The most recent stocks to make the rankings were both from 2020: well-known Tesla (#2) and lesser-known online marketplace Etsy (#17), which saw sales from independent creators surge during the early COVID-19 pandemic. The dollar value of items sold on Etsy more than doubled from $5.3 billion in 2019 to $10.3 billion in 2020, with mask sales accounting for 7% of the total.
Biggest Gainers in Each Sector
While information technology stocks made up nearly half of the list, there is representation from nine of the 11 S&P 500 sectors. No companies from the Industrials or Consumer Staples sectors made it into the ranks of the top S&P 500 stocks by annual returns.
Below, we show the stock with the best annual return for each sector.

Tesla was the top-performing Consumer Discretionary stock on the list. After meeting the requirement of four consecutive quarters of positive earnings, it joined the S&P 500 Index on December 21, 2020. The company’s performance was boosted by the announcement that it would be included in the S&P 500, along with strong performance in China, and general EV buzz as environmental regulations tightened worldwide.
In the realm of Communication Services, DSC Communications saw a sizable return in 1992. The telecommunications equipment company had contracts with major companies such as Bell and Motorola. Alcatel-Lucent (then Alcatel), a French producer of mobile phones, purchased DSC Communications in 1998.
Serial Success Stories
It’s impressive to make the list of the top S&P 500 stocks by calendar returns once, but there are seven companies that have done it twice.
Some stocks saw their repeated outperformance close together, with Dell making the ranks back-to-back in 1997 and 1998.

On the other hand, a select few have more staying power. Computing giant NVIDIA topped the charts in 2001 and triumphed again 15 years later in 2016. And this year might be another win, as the company has recently reached a $1 trillion market capitalization and has the highest year-to-date return in the S&P 500 as of July 6, 2023.
-

 Environment5 days ago
Hotter Than Ever: 2023 Sets New Global Temperature Records
-

 Datastream4 weeks ago
Can You Calculate Your Daily Carbon Footprint?
-

 Energy2 weeks ago
Who’s Still Buying Russian Fossil Fuels in 2023?
-

 VC+5 days ago
What’s New on VC+ in July
-

 Investor Education4 weeks ago
Visualizing BlackRock’s Top Equity Holdings
-

 apps2 weeks ago
Meet the Competing Apps Battling for Twitter’s Market Share
-

 China18 hours ago
How Do Chinese Citizens Feel About Other Countries?
-

 Markets4 weeks ago
Visualizing Every Company on the S&P 500 Index