Misc
Visualizing Two Decades of Reported Hate Crimes in the U.S.
Article/Editing:
Visualizing Two Decades of Reported Hate Crimes in the U.S.
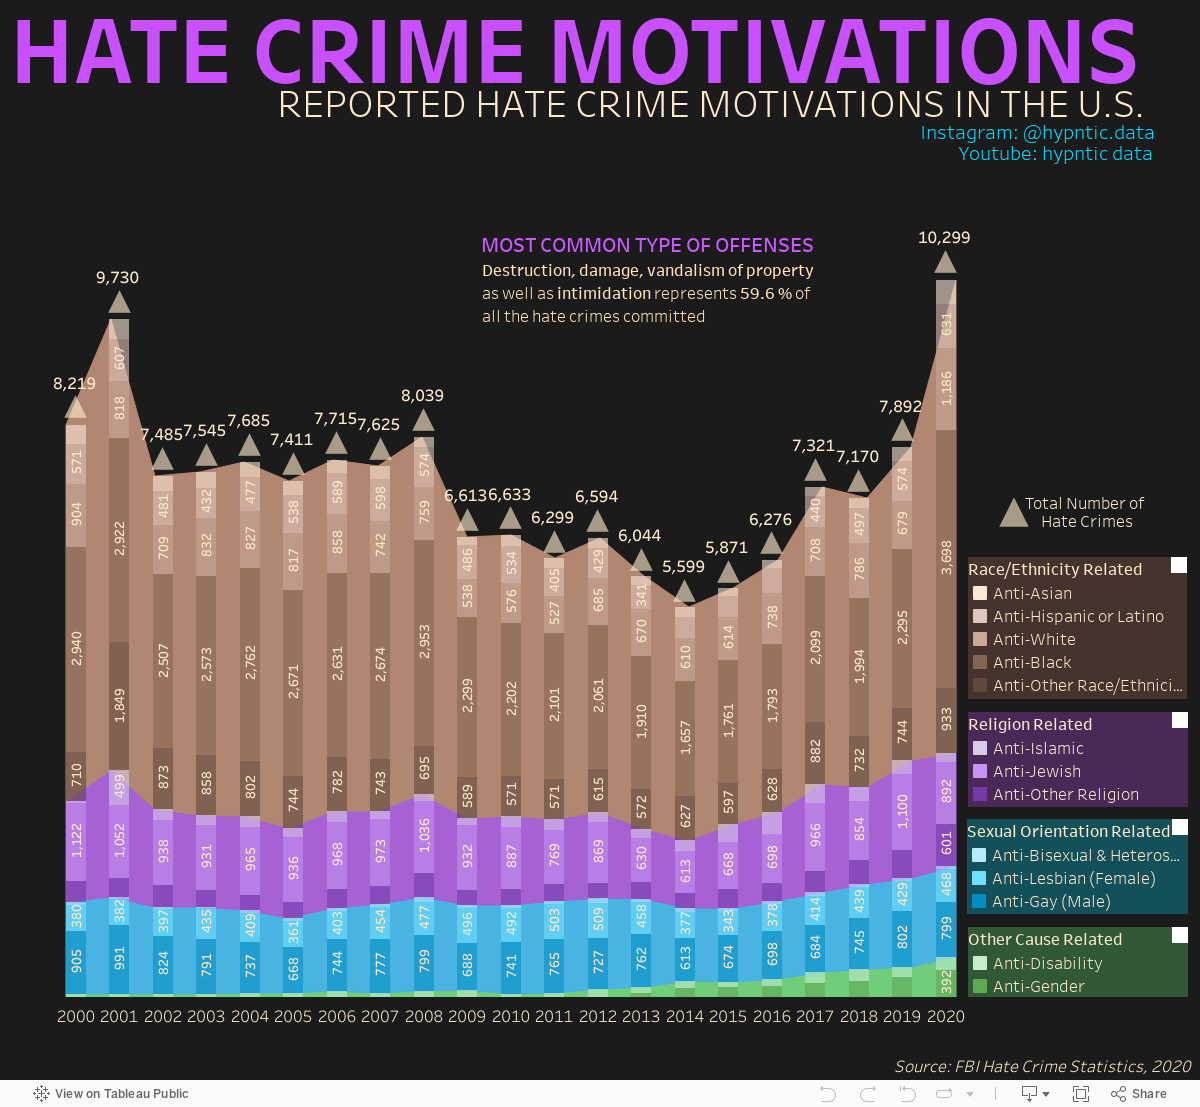
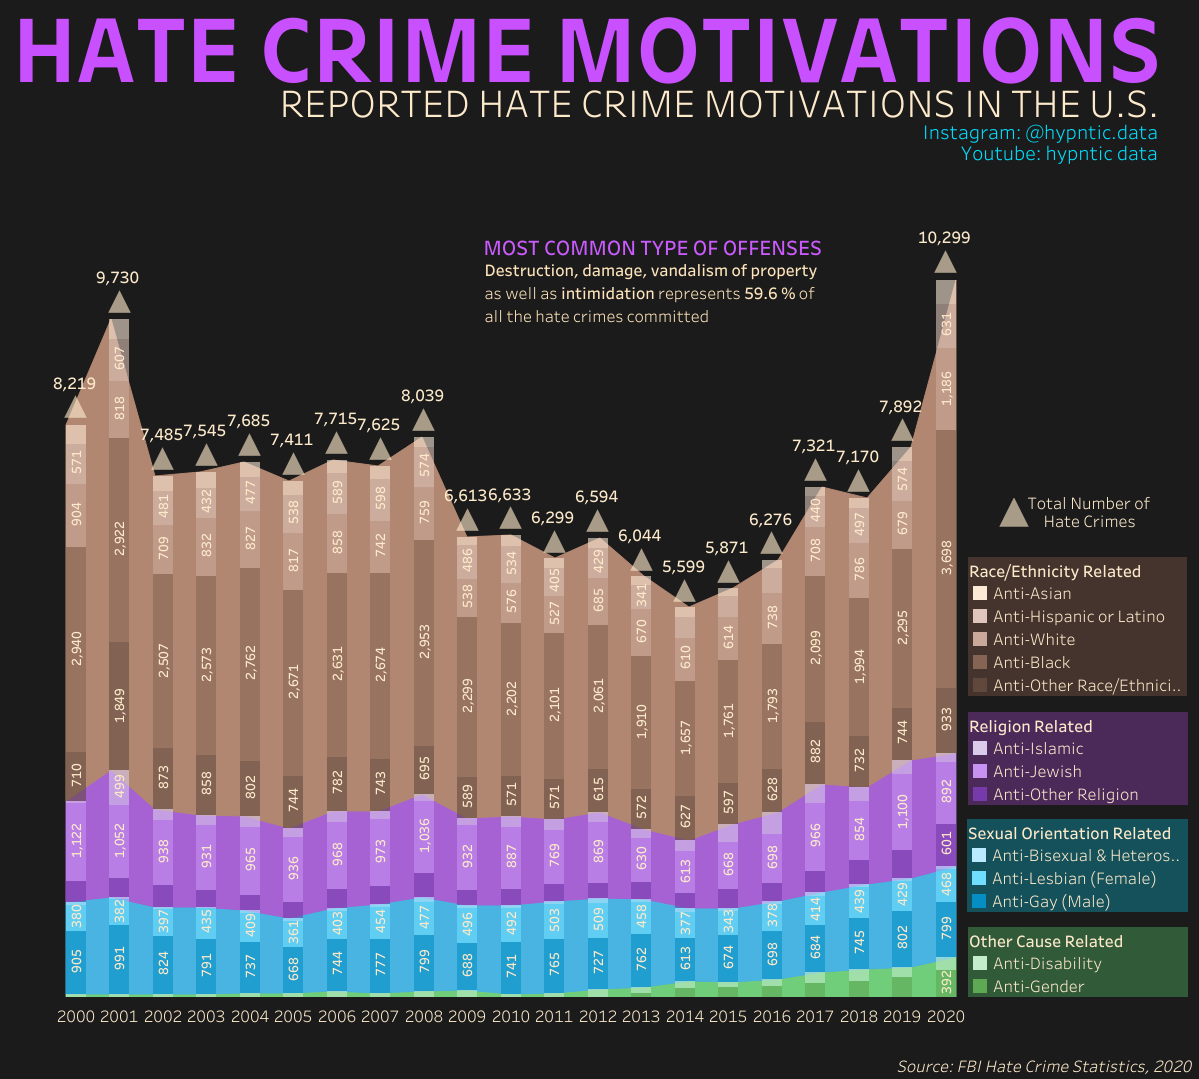
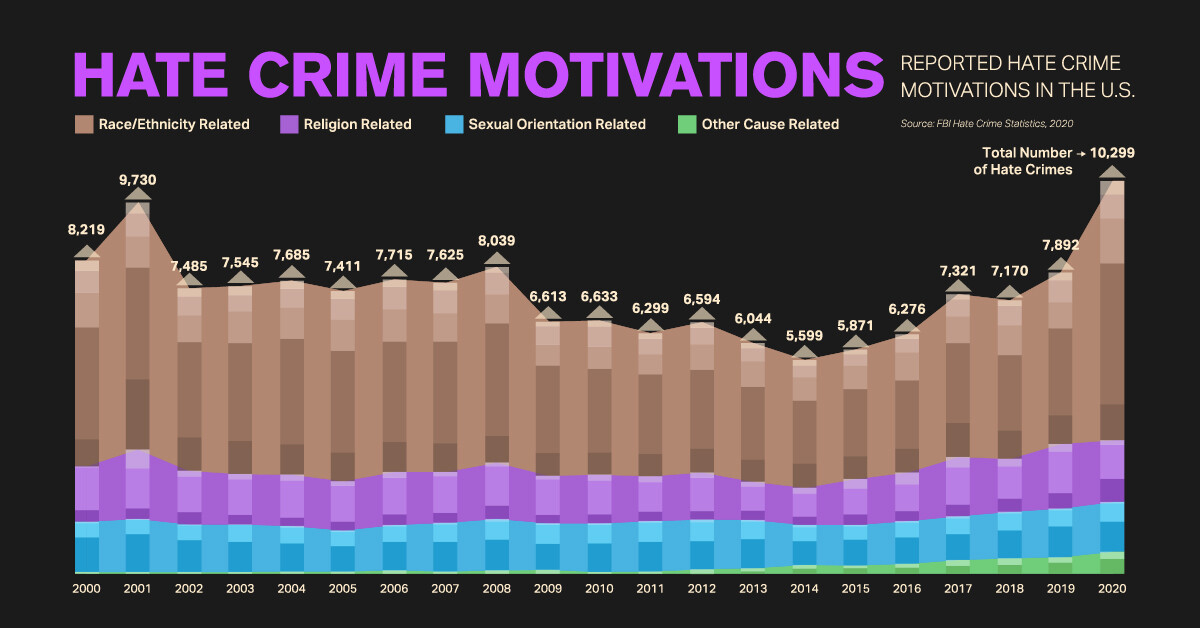
Across the U.S., thousands of hate crimes are committed each year, with many different motivating biases.
In 2020 alone, more than 10,000 unique hate crime incidents were reported to the Federal Bureau of Investigation (FBI)—and it’s likely that thousands more were committed that didn’t get reported to law enforcement.
What are the most commonly reported motivating biases, and how have hate crime rates evolved over the years? This graphic uses data from the FBI to visualize two decades of reported hate crime incidents across America.
What is Considered a Hate Crime?
Before diving in, it’s important to determine what constitutes a hate crime.
According to the U.S. Department of Justice, a hate crime is a crime that’s “committed on the basis of the victim’s perceived or actual race, color, religion, national origin, sexual orientation, gender, gender identity, or disability.”
These types of crimes are a threat to society, as they have a broader impact on communities than other types of crimes do. This is because hate crimes can foster fear and intimidate large groups of people or marginalized communities, making them feel unwelcome, unsafe, or othered.
Hate Crimes on the Rise
Hate crimes have been rising across the U.S. in nearly every year since 2014. By 2020, reported crimes across America reached record-level highs not seen in over two decades.
| Year | Number of Reported Incidents | % Change (y-o-y) |
|---|---|---|
| 2001 | 9730 | 18.4% |
| 2002 | 7485 | -23.1% |
| 2003 | 7545 | 0.8% |
| 2004 | 7685 | 1.9% |
| 2005 | 7411 | -3.6% |
| 2006 | 7715 | 4.1% |
| 2007 | 7625 | -1.2% |
| 2008 | 8039 | 5.4% |
| 2009 | 6613 | -17.7% |
| 2010 | 6633 | 0.3% |
| 2011 | 6299 | -5.0% |
| 2012 | 6594 | 4.7% |
| 2013 | 6044 | -8.3% |
| 2014 | 5599 | -7.4% |
| 2015 | 5871 | 4.9% |
| 2016 | 6276 | 6.9% |
| 2017 | 7321 | 16.7% |
| 2018 | 7170 | -2.1% |
| 2019 | 7892 | 10.1% |
| 2020 | 10299 | 30.5% |
And sadly, these figures are likely a vast undercount. Law enforcement submit this data to the FBI of their own volition, and in 2020, thousands of agencies did not submit their crime statistics.
Race-Related Hate Crimes are Most Common
Historically, the most reported hate crimes in the U.S. are related to race. In 2020, about 66% of incidents were motivated by discrimination against the victim’s race or ethnicity.
| Type of Bias | Total Number of Crimes (2020) | % of Total |
|---|---|---|
| Race/Ethnicity | 6793 | 66.0% |
| Religion | 1626 | 15.8% |
| Sexual Orientation | 1311 | 12.7% |
| Other | 569 | 5.5% |
| Total | 10299 | -- |
While race is the most commonly reported hate crime, incidents related to gender and gender identity are on the rise—in 2020, there was a 9% increase in gender-related incidents, and a 34% increase in gender identity-related incidents, compared to 2019 figures.

This article was published as a part of Visual Capitalist's Creator Program, which features data-driven visuals from some of our favorite Creators around the world.


Public Opinion
How Do Chinese Citizens Feel About Other Countries?
What is the Chinese public’s view of world powers? This visual breaks down Chinese sentiment towards other countries.
Public Opinion: How Chinese Citizens Feel About Other Countries
Tensions over Taiwan, the COVID-19 pandemic, trade, and the war in Ukraine have impacted Chinese sentiment towards other countries.
This visualization uses data from the Center for International Security and Strategy (CISS) at Tsinghua University to rank survey responses from the Chinese public on their attitudes towards countries and regions around the world.
Chinese Sentiment Towards Other Countries in 2023
In the Center’s opinion polls, which surveyed a random sample of more than 2,500 Chinese mainland adults in November 2022, Russia came out significantly ahead.
Just under 60% of respondents held Russia in a favorable view, with 19% seeing the country as “very favorable.” Contrast that to the mere 12% that viewed the U.S. in a positive light.
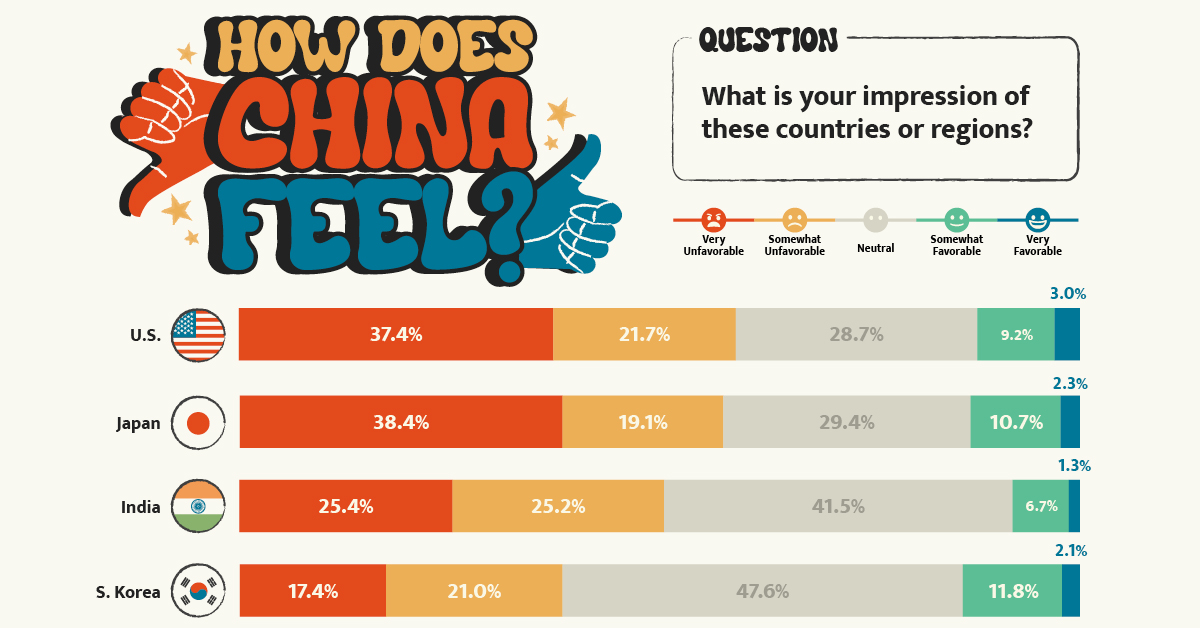
Here’s a closer look at the data. The percentages refer to the share of respondents that voted for said category.
| Country/Region | Very Unfavorable | Somewhat Unfavorable | Neutral | Somewhat Favorable | Very Favorable |
|---|---|---|---|---|---|
| 🇺🇸 United States | 37.4% | 21.7% | 28.7% | 9.2% | 3.0% |
| 🇯🇵 Japan | 38.4% | 19.1% | 29.4% | 10.7% | 2.3% |
| 🇮🇳 India | 25.4% | 25.2% | 41.5% | 6.7% | 1.3% |
| 🇰🇷 South Korea | 17.4% | 21.0% | 47.6% | 11.8% | 2.1% |
| 🇪🇺 European Union | 9.3% | 15.6% | 57.6% | 14.1% | 3.3% |
| Southeast Asia | 7.1% | 13.1% | 59.5% | 16.8% | 3.5% |
| 🇷🇺 Russia | 3.0% | 4.8% | 33.7% | 39.4% | 19.0% |
Japan ranked just below the U.S. in terms of overall unfavorability, though a slightly higher share of respondents saw Japan as “very unfavorable” compared to America. This is likely due to both modern tensions in the East China Sea over mutually claimed islands and historical tensions over the Sino-Japanese Wars.
Chinese sentiment towards India was also unfavorable at just over 50%, though notably the country also received the lowest favorability rating at just 8%.
Additional Survey Findings
The survey also found that 39% of Chinese people get their information on international security from Chinese state-run media (mainly through TV), with an additional 19% getting information from government websites and official social accounts. Conversely, only 1.7% get their news from foreign websites and foreign social media, partially due to the Great Firewall.
When asked about different international security issues, the biggest shares of Chinese citizens ranked the following as their top three:
- Pandemics (12.9%)
- Disputes over territory and territorial waters (12.9%)
- China-U.S. relations (12.0%)
The pandemic’s high score reflects the harsher impact COVID-19 had on China. Chinese borders were shut for years and the public faced intense measures to reduce spread.
In terms of other world events, the majority of Chinese people align with a more “Eastern” viewpoint. For example, in regards to the war in Ukraine, the report found that:
“About 80 percent of the respondents believe the U.S. and Western countries should be held most accountable [for the war], while less than ten percent of the respondents argue that Russia is mainly responsible.”– Center for International Security and Strategy, Tsinghua University
Overall, the views of the Chinese public reflect the opposite of those found in many Western countries. They provide an important insight that it is not just the Chinese government holding particular views about the world, but the Chinese public as well.
-

 Stocks4 weeks ago
Visualizing BlackRock’s Top Equity Holdings
-

 Technology2 weeks ago
Meet the Competing Apps Battling for Twitter’s Market Share
-

 Public Opinion18 hours ago
How Do Chinese Citizens Feel About Other Countries?
-

 Markets4 weeks ago
Visualizing Every Company on the S&P 500 Index
-

 Markets2 weeks ago
Visualizing 1 Billion Square Feet of Empty Office Space
-

 Energy4 weeks ago
Life Cycle Emissions: EVs vs. Combustion Engine Vehicles
-

 Maps2 weeks ago
Vintage Viz: The World’s Rivers and Lakes, Organized Neatly
-

 Markets3 weeks ago
Visualized: The 100 Largest U.S. Banks by Consolidated Assets