Misc
These Powerful Maps Show the Extremes of U.S. Population Density
America’s 328 million people are spread across a huge amount of territory, but the population density of various regions is far from equal.
It’s no secret that cities like New York have a vastly different population density than, say, a rural county in North Dakota. Even so, this interactive map by Ben Blatt of Slate helps visualize the stark contrast between urban and rural densities in a way that might intrigue you.
How many counties does it take to equal the population of these large urban areas? Let’s find out.
New York City’s Rural Equivalent
New York City (proper) Population: 8.42 million
New York City Population density: 27,547 persons / mi²
New York City became the largest city in the U.S. back in 1781 and has long been the country’s most densely packed urban center. Today, 1 in every 38 people living in the United States resides in The Big Apple.
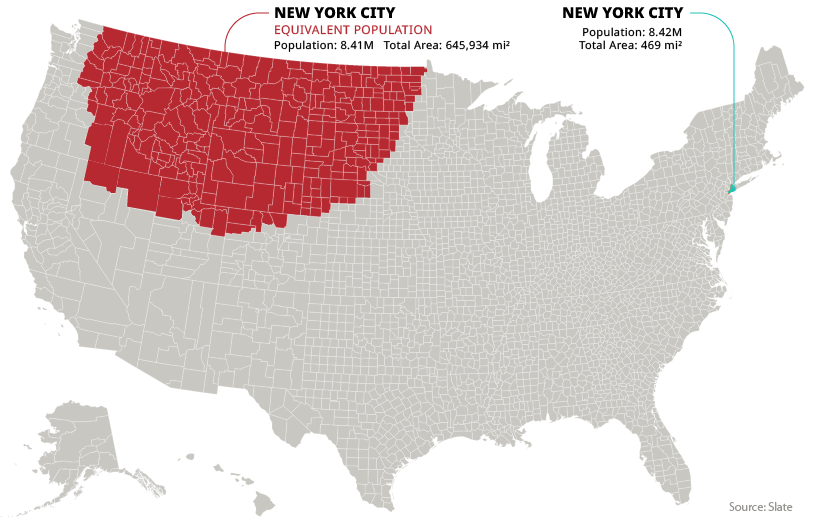
For the northwestern counties above to match the population of New York City, it takes a land area around the size of Mongolia. The region shown above is 645,934 mi², and runs through portions of 12 different states.
In order to match the population of the entire New York metropolitan area, which holds 18 million people and includes adjacent cities and towns in New York state, New Jersey, and Connecticut, the above equivalent area would have to be even more massive.
Los Angeles County’s Rural Equivalent
LA County Population: 10.04 million
LA County Population density: 2,100 persons / mi²
Los Angeles County is home to the 88 incorporated cities that make up the urban area of Los Angeles.
Even excluding nearby population centers such as Anaheim, San Bernadino, and Riverside (which are located in adjacent counties) it is still the most populous county in the United States, with over 10 million inhabitants.
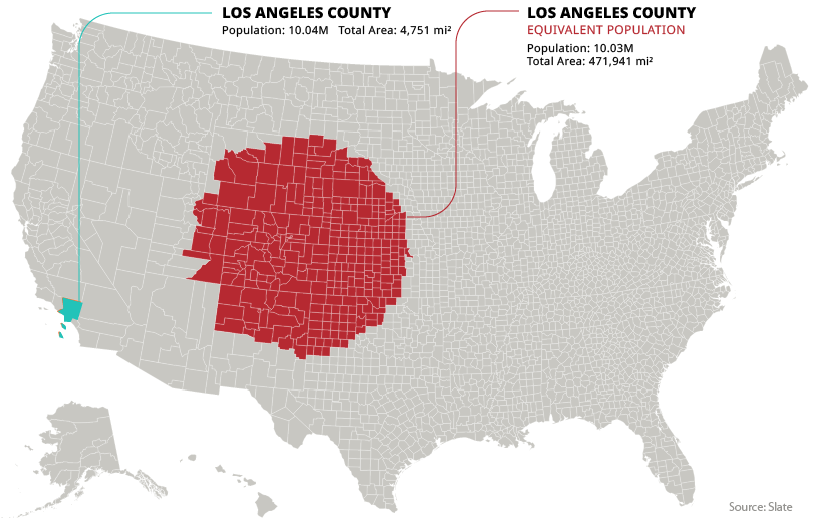
To match this enormous scale in Middle America, it would take 298 counties covering an area of 471,941 mi².
Chicago’s Rural Equivalent
Chicago Metropolitan Area Population: 9.53 million
Chicago Metropolitan Area Population density: 1,318 persons / mi²
Next up is America’s third largest city, Chicago. For this visualization, we’re using the Chicago metropolitan area, which covers the full extent of the city’s population.
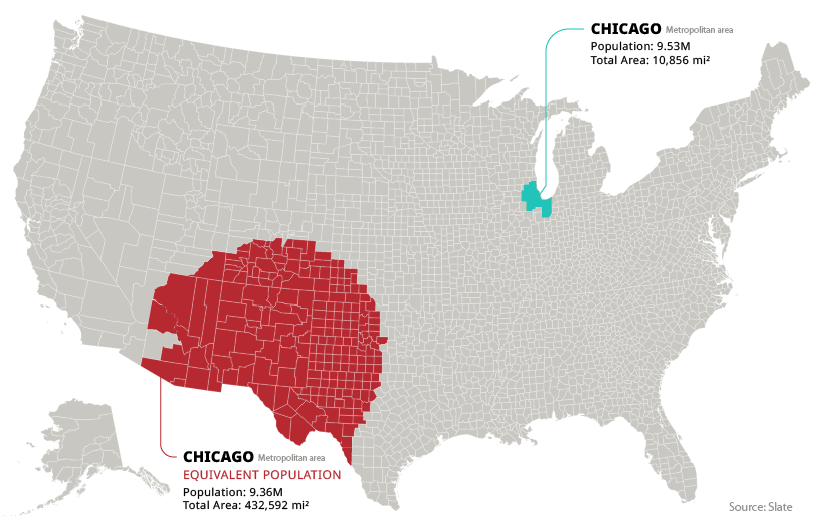
To match the scale of the population of the Windy City, we would need to add up every county in New Mexico, along with large portions of Colorado, Arizona, and Texas.
Turning the Tables?
Conversely, what if we transported the people in the country’s least densely populated counties into the middle of an urban center?
| Rank | County | Population |
|---|---|---|
| 1 | Kalawao County, Hawaii | 86 |
| 2 | Loving County, Texas | 169 |
| 3 | King County, Texas | 272 |
| 4 | Kenedy County, Texas | 404 |
| 5 | Arthur County, Nebraska | 463 |
As it turns out, the total population of the five least populated counties is just 1,394—roughly the same amount of people that live on the average Manhattan block.


Politics
How Do Chinese Citizens Feel About Other Countries?
What is the Chinese public’s view of world powers? This visual breaks down Chinese sentiment towards other countries.
Public Opinion: How Chinese Citizens Feel About Other Countries
Tensions over Taiwan, the COVID-19 pandemic, trade, and the war in Ukraine have impacted Chinese sentiment towards other countries.
This visualization uses data from the Center for International Security and Strategy (CISS) at Tsinghua University to rank survey responses from the Chinese public on their attitudes towards countries and regions around the world.
Chinese Sentiment Towards Other Countries in 2023
In the Center’s opinion polls, which surveyed a random sample of more than 2,500 Chinese mainland adults in November 2022, Russia came out significantly ahead.
Just under 60% of respondents held Russia in a favorable view, with 19% seeing the country as “very favorable.” Contrast that to the mere 12% that viewed the U.S. in a positive light.
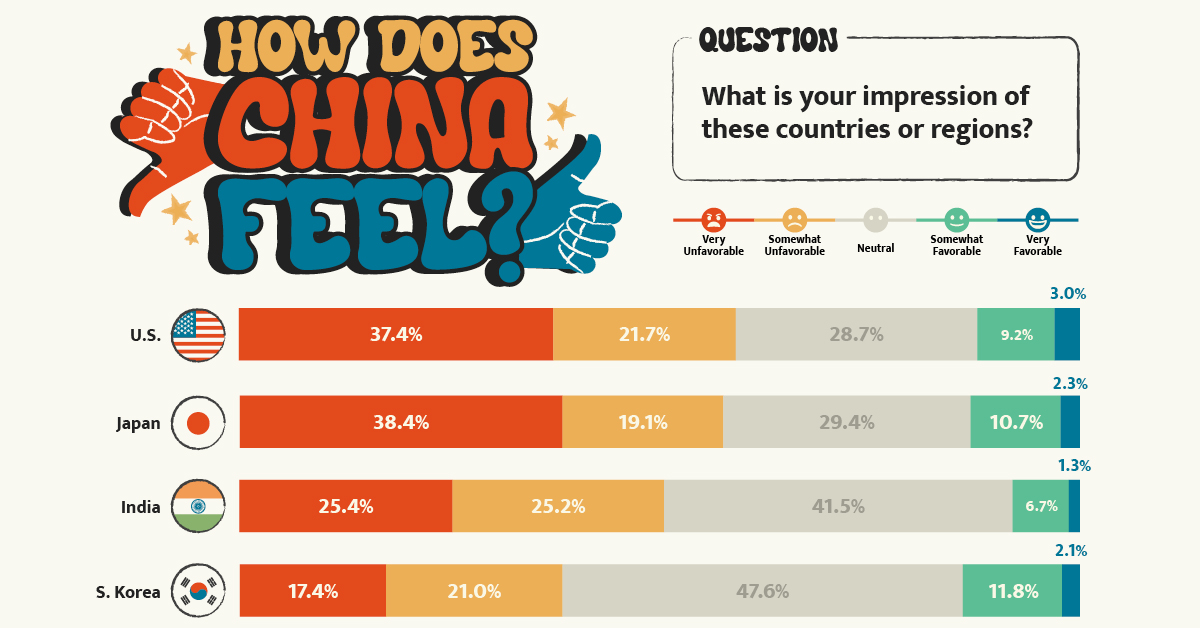
Here’s a closer look at the data. The percentages refer to the share of respondents that voted for said category.
| Country/Region | Very Unfavorable | Somewhat Unfavorable | Neutral | Somewhat Favorable | Very Favorable |
|---|---|---|---|---|---|
| 🇺🇸 United States | 37.4% | 21.7% | 28.7% | 9.2% | 3.0% |
| 🇯🇵 Japan | 38.4% | 19.1% | 29.4% | 10.7% | 2.3% |
| 🇮🇳 India | 25.4% | 25.2% | 41.5% | 6.7% | 1.3% |
| 🇰🇷 South Korea | 17.4% | 21.0% | 47.6% | 11.8% | 2.1% |
| 🇪🇺 European Union | 9.3% | 15.6% | 57.6% | 14.1% | 3.3% |
| Southeast Asia | 7.1% | 13.1% | 59.5% | 16.8% | 3.5% |
| 🇷🇺 Russia | 3.0% | 4.8% | 33.7% | 39.4% | 19.0% |
Japan ranked just below the U.S. in terms of overall unfavorability, though a slightly higher share of respondents saw Japan as “very unfavorable” compared to America. This is likely due to both modern tensions in the East China Sea over mutually claimed islands and historical tensions over the Sino-Japanese Wars.
Chinese sentiment towards India was also unfavorable at just over 50%, though notably the country also received the lowest favorability rating at just 8%.
Additional Survey Findings
The survey also found that 39% of Chinese people get their information on international security from Chinese state-run media (mainly through TV), with an additional 19% getting information from government websites and official social accounts. Conversely, only 1.7% get their news from foreign websites and foreign social media, partially due to the Great Firewall.
When asked about different international security issues, the biggest shares of Chinese citizens ranked the following as their top three:
- Pandemics (12.9%)
- Disputes over territory and territorial waters (12.9%)
- China-U.S. relations (12.0%)
The pandemic’s high score reflects the harsher impact COVID-19 had on China. Chinese borders were shut for years and the public faced intense measures to reduce spread.
In terms of other world events, the majority of Chinese people align with a more “Eastern” viewpoint. For example, in regards to the war in Ukraine, the report found that:
“About 80 percent of the respondents believe the U.S. and Western countries should be held most accountable [for the war], while less than ten percent of the respondents argue that Russia is mainly responsible.”– Center for International Security and Strategy, Tsinghua University
Overall, the views of the Chinese public reflect the opposite of those found in many Western countries. They provide an important insight that it is not just the Chinese government holding particular views about the world, but the Chinese public as well.
-

 Crime7 days ago
Mapped: The Safest Cities in the U.S.
-

 Markets2 weeks ago
Ranked: The Most Profitable U.S. Companies, by Sector
-

 Technology5 days ago
How Long it Took for Popular Apps to Reach 100 Million Users
-

 Markets4 weeks ago
The World’s Biggest Mutual Fund and ETF Providers
-

 Brands2 weeks ago
Brand Reputations: Ranking the Best and Worst in 2023
-

 Environment5 days ago
Hotter Than Ever: 2023 Sets New Global Temperature Records
-

 Datastream4 weeks ago
Can You Calculate Your Daily Carbon Footprint?
-

 Energy2 weeks ago
Who’s Still Buying Russian Fossil Fuels in 2023?