Maps
Mapped: The Largest 15 U.S. Cities by GDP


Mapped: The Largest 15 U.S. Cities by GDP
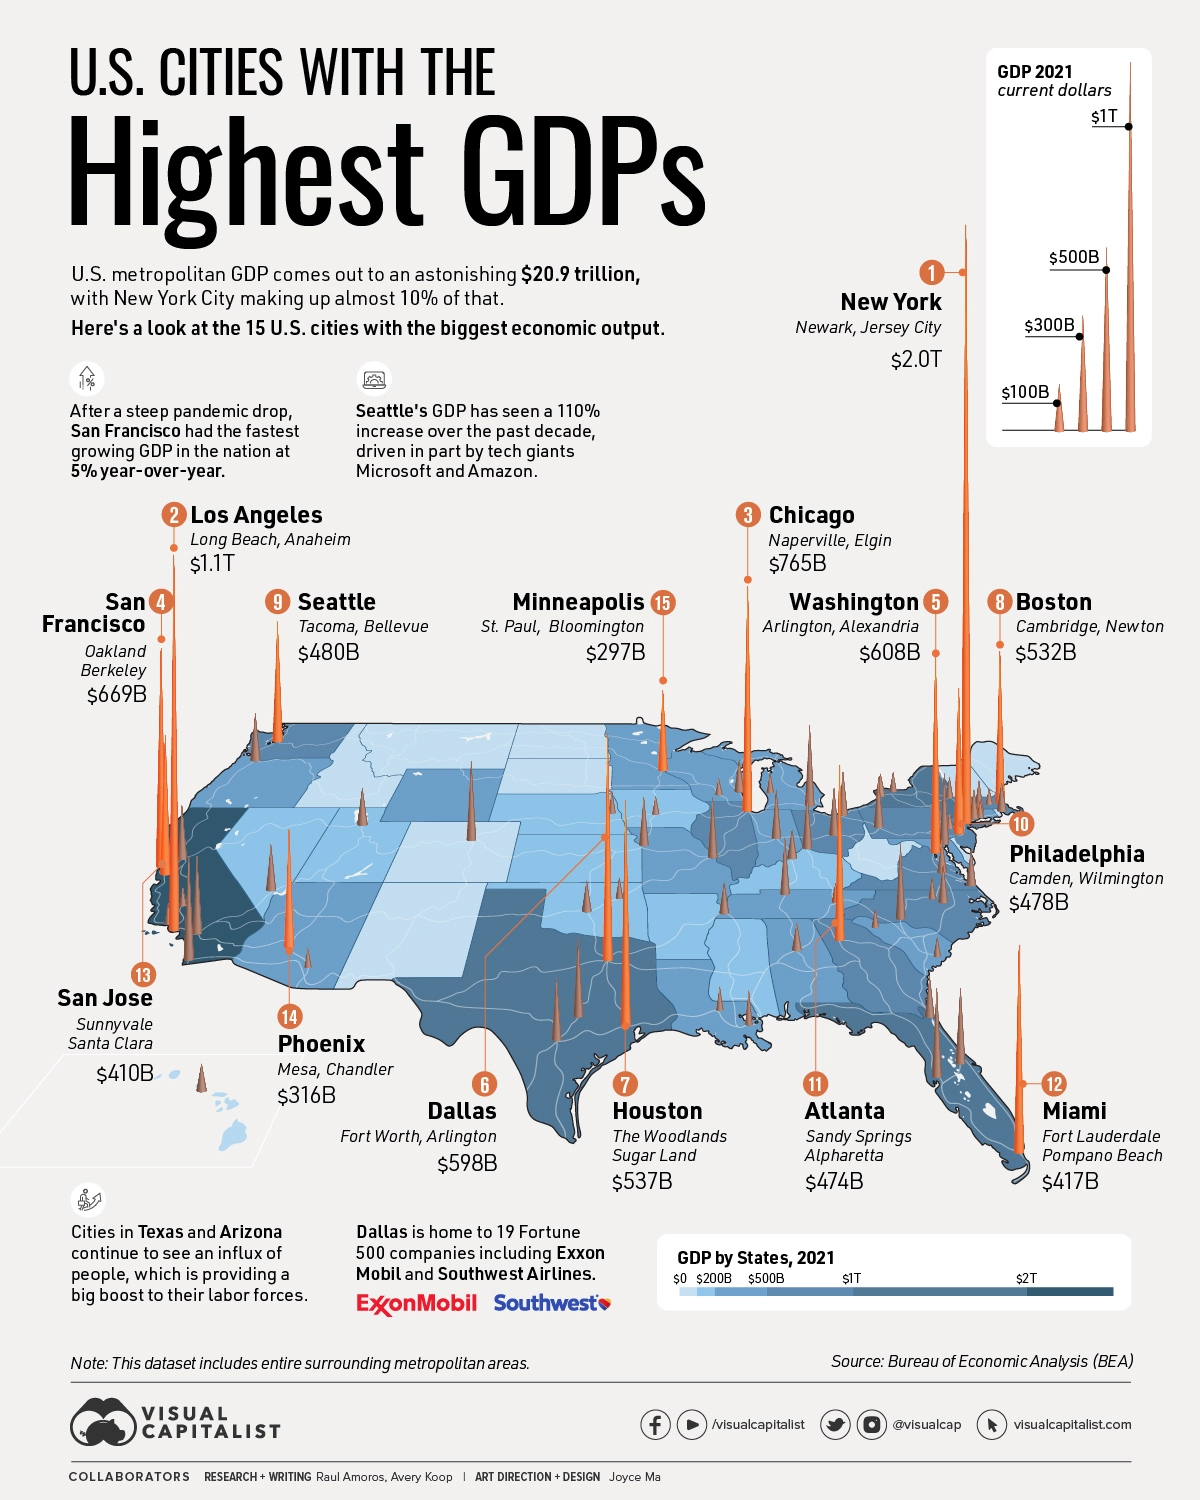
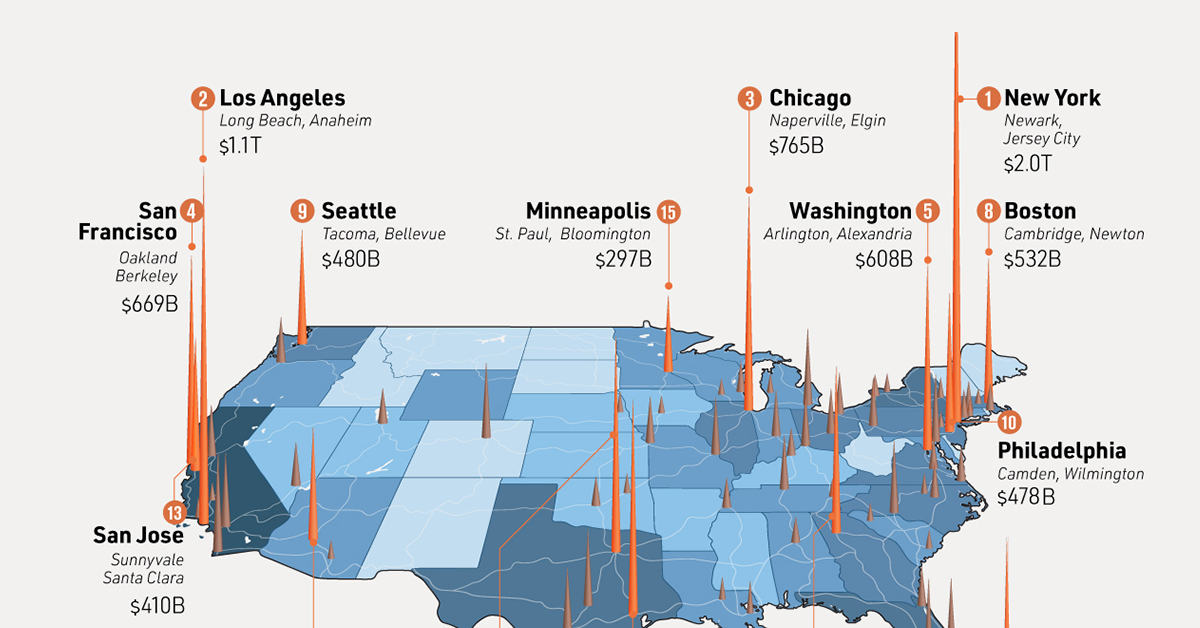
The United States has the largest GDP in the world in nominal terms, and urban areas are a major contributor to the country’s economic might. In fact, metropolitan areas account for roughly 90% of U.S. economic output.
In this visual we’ve ranked the economic output of the top 15 U.S. cities from New York City to Minneapolis, using data from the U.S. Bureau of Economic Analysis. The data covers 2021, which is the most recent release from BEA.
It’s important to note that the data considers entire surrounding metropolitan areas, so as an example, New York City includes neighboring population centers such as Newark, NJ, as well as Jersey City—reaching a GDP of nearly $2 trillion.
Measuring a city’s economy at the metro level can provide a more accurate representation of its economic activity. This is because the metropolitan areas include not only the central city but also the surrounding suburban and rural areas that are economically connected to it.
America’s Economic Hubs
There are some obvious winners when it comes to the largest U.S. cities by GDP, including NYC, Los Angeles, Dallas, and San Francisco.
In the table below, we’ve listed each of the 384 metropolitan areas out of the dataset all the way down to last place, Sebring-Avon Park, Florida, alongside respective ranks and GDP:
| Rank | City | GDP (in thousands) |
|---|---|---|
| #1 | New York-Newark-Jersey City, NY-NJ-PA | $1,992,779,274 |
| #2 | Los Angeles-Long Beach-Anaheim, CA | $1,124,682,354 |
| #3 | Chicago-Naperville-Elgin, IL-IN-WI | $764,583,227 |
| #4 | San Francisco-Oakland-Berkeley, CA | $668,677,573 |
| #5 | Washington-Arlington-Alexandria, DC-VA-MD-WV | $607,628,505 |
| #6 | Dallas-Fort Worth-Arlington, TX | $598,333,263 |
| #7 | Houston-The Woodlands-Sugar Land, TX | $537,066,232 |
| #8 | Boston-Cambridge-Newton, MA-NH | $531,671,846 |
| #9 | Seattle-Tacoma-Bellevue, WA | $479,966,484 |
| #10 | Philadelphia-Camden-Wilmington, PA-NJ-DE-MD | $477,580,629 |
| #11 | Atlanta-Sandy Springs-Alpharetta, GA | $473,823,474 |
| #12 | Miami-Fort Lauderdale-Pompano Beach, FL | $417,147,866 |
| #13 | San Jose-Sunnyvale-Santa Clara, CA | $410,418,579 |
| #14 | Phoenix-Mesa-Chandler, AZ | $316,090,586 |
| #15 | Minneapolis-St. Paul-Bloomington, MN-WI | $296,969,112 |
| #16 | Detroit-Warren-Dearborn, MI | $283,660,258 |
| #17 | San Diego-Chula Vista-Carlsbad, CA | $267,973,544 |
| #18 | Denver-Aurora-Lakewood, CO | $253,399,051 |
| #19 | Baltimore-Columbia-Towson, MD | $222,967,241 |
| #20 | Riverside-San Bernardino-Ontario, CA | $213,183,465 |
| #21 | Charlotte-Concord-Gastonia, NC-SC | $207,866,150 |
| #22 | Austin-Round Rock-Georgetown, TX | $193,773,558 |
| #23 | Tampa-St. Petersburg-Clearwater, FL | $190,708,533 |
| #24 | St. Louis, MO-IL | $187,569,544 |
| #25 | Portland-Vancouver-Hillsboro, OR-WA | $186,570,323 |
| #26 | Cincinnati, OH-KY-IN | $171,737,526 |
| #27 | Pittsburgh, PA | $168,021,049 |
| #28 | Orlando-Kissimmee-Sanford, FL | $167,279,974 |
| #29 | Nashville-Davidson--Murfreesboro--Franklin, TN | $163,031,737 |
| #30 | Indianapolis-Carmel-Anderson, IN | $162,062,985 |
| #31 | Sacramento-Roseville-Folsom, CA | $160,542,566 |
| #32 | Columbus, OH | $154,509,800 |
| #33 | Kansas City, MO-KS | $154,328,892 |
| #34 | Cleveland-Elyria, OH | $147,637,827 |
| #35 | San Antonio-New Braunfels, TX | $144,384,474 |
| #36 | Las Vegas-Henderson-Paradise, NV | $136,198,676 |
| #37 | Salt Lake City, UT | $118,494,536 |
| #38 | Milwaukee-Waukesha, WI | $111,479,649 |
| #39 | Raleigh-Cary, NC | $108,288,115 |
| #40 | Virginia Beach-Norfolk-Newport News, VA-NC | $107,067,798 |
| #41 | Hartford-East Hartford-Middletown, CT | $106,507,622 |
| #42 | Jacksonville, FL | $101,367,263 |
| #43 | Richmond, VA | $99,388,754 |
| #44 | Bridgeport-Stamford-Norwalk, CT | $98,751,750 |
| #45 | Providence-Warwick, RI-MA | $96,913,356 |
| #46 | Oklahoma City, OK | $86,662,243 |
| #47 | Memphis, TN-MS-AR | $86,493,147 |
| #48 | Louisville/Jefferson County, KY-IN | $82,866,115 |
| #49 | New Orleans-Metairie, LA | $81,829,573 |
| #50 | Buffalo-Cheektowaga, NY | $76,991,435 |
| #51 | Albany-Schenectady-Troy, NY | $73,995,509 |
| #52 | Omaha-Council Bluffs, NE-IA | $73,876,512 |
| #53 | Birmingham-Hoover, AL | $70,874,148 |
| #54 | Rochester, NY | $69,341,714 |
| #55 | Grand Rapids-Kentwood, MI | $68,401,313 |
| #56 | Urban Honolulu, HI | $67,383,319 |
| #57 | Des Moines-West Des Moines, IA | $61,171,285 |
| #58 | Durham-Chapel Hill, NC | $60,814,699 |
| #59 | Tulsa, OK | $60,392,165 |
| #60 | Oxnard-Thousand Oaks-Ventura, CA | $58,332,732 |
| #61 | New Haven-Milford, CT | $57,541,201 |
| #62 | Madison, WI | $56,636,713 |
| #63 | Baton Rouge, LA | $56,199,218 |
| #64 | Worcester, MA-CT | $54,941,620 |
| #65 | Knoxville, TN | $52,343,257 |
| #66 | Greenville-Anderson, SC | $52,328,843 |
| #67 | Bakersfield, CA | $52,239,044 |
| #68 | Allentown-Bethlehem-Easton, PA-NJ | $50,960,155 |
| #69 | Charleston-North Charleston, SC | $50,704,392 |
| #70 | Tucson, AZ | $50,231,611 |
| #71 | Fresno, CA | $49,987,063 |
| #72 | Dayton-Kettering, OH | $49,548,210 |
| #73 | Albuquerque, NM | $49,480,431 |
| #74 | Columbia, SC | $48,214,448 |
| #75 | Syracuse, NY | $46,414,861 |
| #76 | Greensboro-High Point, NC | $45,574,221 |
| #77 | North Port-Sarasota-Bradenton, FL | $44,746,013 |
| #78 | Harrisburg-Carlisle, PA | $43,867,213 |
| #79 | Trenton-Princeton, NJ | $43,633,044 |
| #80 | Boise City, ID | $43,601,402 |
| #81 | Colorado Springs, CO | $43,522,096 |
| #82 | Little Rock-North Little Rock-Conway, AR | $42,669,983 |
| #83 | Midland, TX | $42,035,915 |
| #84 | Akron, OH | $41,058,875 |
| #85 | Wichita, KS | $40,586,374 |
| #86 | Toledo, OH | $40,546,884 |
| #87 | Cape Coral-Fort Myers, FL | $39,813,620 |
| #88 | Poughkeepsie-Newburgh-Middletown, NY | $39,375,465 |
| #89 | Portland-South Portland, ME | $39,089,209 |
| #90 | Winston-Salem, NC | $38,504,784 |
| #91 | El Paso, TX | $37,507,586 |
| #92 | Springfield, MA | $37,189,530 |
| #93 | Provo-Orem, UT | $36,866,060 |
| #94 | Stockton, CA | $36,790,065 |
| #95 | Reno, NV | $35,471,910 |
| #96 | Ogden-Clearfield, UT | $35,071,325 |
| #97 | Santa Rosa-Petaluma, CA | $34,450,601 |
| #98 | Chattanooga, TN-GA | $34,425,793 |
| #99 | Huntsville, AL | $34,086,472 |
| #100 | Santa Maria-Santa Barbara, CA | $33,306,884 |
| #101 | Boulder, CO | $33,182,418 |
| #102 | Lakeland-Winter Haven, FL | $33,144,404 |
| #103 | Fayetteville-Springdale-Rogers, AR | $33,102,945 |
| #104 | Vallejo, CA | $33,100,194 |
| #105 | Lancaster, PA | $33,048,548 |
| #106 | Lexington-Fayette, KY | $32,851,535 |
| #107 | Manchester-Nashua, NH | $32,729,580 |
| #108 | Spokane-Spokane Valley, WA | $32,178,609 |
| #109 | Augusta-Richmond County, GA-SC | $31,718,339 |
| #110 | Jackson, MS | $30,785,111 |
| #111 | Salinas, CA | $30,712,263 |
| #112 | Palm Bay-Melbourne-Titusville, FL | $30,589,541 |
| #113 | Scranton--Wilkes-Barre, PA | $30,040,721 |
| #114 | Lansing-East Lansing, MI | $29,363,629 |
| #115 | Ann Arbor, MI | $28,604,834 |
| #116 | Anchorage, AK | $28,210,676 |
| #117 | Modesto, CA | $26,519,792 |
| #118 | Sioux Falls, SD | $26,063,548 |
| #119 | Savannah, GA | $25,681,434 |
| #120 | Deltona-Daytona Beach-Ormond Beach, FL | $25,516,019 |
| #121 | McAllen-Edinburg-Mission, TX | $25,508,724 |
| #122 | Salisbury, MD-DE | $25,194,103 |
| #123 | Fort Wayne, IN | $25,156,180 |
| #124 | Corpus Christi, TX | $24,937,471 |
| #125 | Davenport-Moline-Rock Island, IA-IL | $24,603,801 |
| #126 | Beaumont-Port Arthur, TX | $24,407,762 |
| #127 | Fort Collins, CO | $24,381,467 |
| #128 | Asheville, NC | $24,350,043 |
| #129 | Pensacola-Ferry Pass-Brent, FL | $24,309,017 |
| #130 | Fayetteville, NC | $24,254,218 |
| #131 | Shreveport-Bossier City, LA | $24,153,731 |
| #132 | Naples-Marco Island, FL | $24,020,049 |
| #133 | Springfield, MO | $23,930,761 |
| #134 | Mobile, AL | $23,876,616 |
| #135 | Peoria, IL | $23,599,643 |
| #136 | York-Hanover, PA | $23,406,852 |
| #137 | Youngstown-Warren-Boardman, OH-PA | $23,284,271 |
| #138 | Lafayette, LA | $22,650,406 |
| #139 | Lincoln, NE | $22,492,557 |
| #140 | Greeley, CO | $22,082,249 |
| #141 | Reading, PA | $22,055,785 |
| #142 | Green Bay, WI | $21,991,068 |
| #143 | Killeen-Temple, TX | $21,967,641 |
| #144 | Myrtle Beach-Conway-North Myrtle Beach, SC-NC | $21,787,862 |
| #145 | Salem, OR | $21,487,178 |
| #146 | Evansville, IN-KY | $21,248,968 |
| #147 | Gulfport-Biloxi, MS | $21,177,139 |
| #148 | Port St. Lucie, FL | $20,762,211 |
| #149 | Norwich-New London, CT | $20,743,047 |
| #150 | Visalia, CA | $20,580,771 |
| #151 | Montgomery, AL | $20,250,047 |
| #152 | Canton-Massillon, OH | $20,167,014 |
| #153 | Tallahassee, FL | $20,148,962 |
| #154 | Cedar Rapids, IA | $19,793,178 |
| #155 | San Luis Obispo-Paso Robles, CA | $19,639,637 |
| #156 | Elkhart-Goshen, IN | $19,271,838 |
| #157 | Crestview-Fort Walton Beach-Destin, FL | $18,899,397 |
| #158 | Eugene-Springfield, OR | $18,848,436 |
| #159 | Gainesville, FL | $18,353,884 |
| #160 | Roanoke, VA | $18,297,657 |
| #161 | Wilmington, NC | $18,203,444 |
| #162 | Santa Cruz-Watsonville, CA | $18,076,112 |
| #163 | Spartanburg, SC | $17,914,096 |
| #164 | Kennewick-Richland, WA | $17,836,850 |
| #165 | Fargo, ND-MN | $17,706,417 |
| #166 | Flint, MI | $17,234,628 |
| #167 | Longview, TX | $17,134,932 |
| #168 | South Bend-Mishawaka, IN-MI | $17,031,977 |
| #169 | Rockford, IL | $17,005,386 |
| #170 | Hickory-Lenoir-Morganton, NC | $16,787,117 |
| #171 | Huntington-Ashland, WV-KY-OH | $16,470,842 |
| #172 | Columbus, GA-AL | $16,456,091 |
| #173 | Lubbock, TX | $16,402,001 |
| #174 | Amarillo, TX | $16,313,319 |
| #175 | Olympia-Lacey-Tumwater, WA | $16,245,024 |
| #176 | Appleton, WI | $16,202,188 |
| #177 | Bellingham, WA | $16,036,428 |
| #178 | Kalamazoo-Portage, MI | $15,946,455 |
| #179 | Duluth, MN-WI | $15,905,385 |
| #180 | College Station-Bryan, TX | $15,896,707 |
| #181 | Lake Charles, LA | $15,791,901 |
| #182 | Charlottesville, VA | $15,762,678 |
| #183 | Burlington-South Burlington, VT | $15,669,774 |
| #184 | Rochester, MN | $15,644,852 |
| #185 | Atlantic City-Hammonton, NJ | $15,313,041 |
| #186 | Barnstable Town, MA | $15,150,695 |
| #187 | Bloomington, IL | $15,140,725 |
| #188 | Waco, TX | $15,125,143 |
| #189 | Kingsport-Bristol, TN-VA | $15,104,427 |
| #190 | Utica-Rome, NY | $14,678,570 |
| #191 | Clarksville, TN-KY | $14,546,292 |
| #192 | Bremerton-Silverdale-Port Orchard, WA | $14,373,182 |
| #193 | Laredo, TX | $13,581,543 |
| #194 | Gainesville, GA | $13,561,088 |
| #195 | Charleston, WV | $13,553,478 |
| #196 | Brownsville-Harlingen, TX | $13,225,538 |
| #197 | Champaign-Urbana, IL | $13,219,093 |
| #198 | Topeka, KS | $13,204,822 |
| #199 | Springfield, IL | $13,019,072 |
| #200 | Tyler, TX | $13,002,122 |
| #201 | Tuscaloosa, AL | $12,913,789 |
| #202 | Ocala, FL | $12,907,979 |
| #203 | Hagerstown-Martinsburg, MD-WV | $12,755,632 |
| #204 | Bend, OR | $12,618,710 |
| #205 | Lafayette-West Lafayette, IN | $12,537,390 |
| #206 | Erie, PA | $12,509,399 |
| #207 | Napa, CA | $12,387,136 |
| #208 | Binghamton, NY | $12,314,327 |
| #209 | St. Cloud, MN | $12,202,920 |
| #210 | Columbia, MO | $12,077,178 |
| #211 | Iowa City, IA | $11,989,228 |
| #212 | Yakima, WA | $11,864,827 |
| #213 | Macon-Bibb County, GA | $11,818,017 |
| #214 | Oshkosh-Neenah, WI | $11,586,606 |
| #215 | Billings, MT | $11,570,641 |
| #216 | Athens-Clarke County, GA | $11,562,554 |
| #217 | Hilton Head Island-Bluffton, SC | $11,497,194 |
| #218 | Lynchburg, VA | $11,430,306 |
| #219 | Odessa, TX | $11,399,343 |
| #220 | Wausau-Weston, WI | $11,250,695 |
| #221 | Wheeling, WV-OH | $11,239,365 |
| #222 | Waterloo-Cedar Falls, IA | $11,197,979 |
| #223 | Florence, SC | $11,018,873 |
| #224 | Medford, OR | $10,949,122 |
| #225 | Fort Smith, AR-OK | $10,920,156 |
| #226 | Greenville, NC | $10,841,765 |
| #227 | Merced, CA | $10,465,518 |
| #228 | Kahului-Wailuku-Lahaina, HI | $10,356,019 |
| #229 | Eau Claire, WI | $10,308,773 |
| #230 | Panama City, FL | $10,269,545 |
| #231 | Sioux City, IA-NE-SD | $10,111,866 |
| #232 | Chico, CA | $10,006,052 |
| #233 | Dover, DE | $9,984,324 |
| #234 | Idaho Falls, ID | $9,915,330 |
| #235 | El Centro, CA | $9,912,905 |
| #236 | Jacksonville, NC | $9,900,984 |
| #237 | Daphne-Fairhope-Foley, AL | $9,891,548 |
| #238 | Jackson, TN | $9,779,929 |
| #239 | State College, PA | $9,750,456 |
| #240 | Harrisonburg, VA | $9,499,442 |
| #241 | Redding, CA | $9,419,468 |
| #242 | Saginaw, MI | $9,363,549 |
| #243 | Houma-Thibodaux, LA | $9,350,744 |
| #244 | La Crosse-Onalaska, WI-MN | $9,294,924 |
| #245 | Johnson City, TN | $9,219,695 |
| #246 | Racine, WI | $9,100,374 |
| #247 | Warner Robins, GA | $8,993,124 |
| #248 | Yuma, AZ | $8,977,170 |
| #249 | Lima, OH | $8,962,374 |
| #250 | Jefferson City, MO | $8,956,976 |
| #251 | Abilene, TX | $8,848,793 |
| #252 | Prescott Valley-Prescott, AZ | $8,796,885 |
| #253 | Monroe, LA | $8,699,152 |
| #254 | Kingston, NY | $8,622,165 |
| #255 | Morgantown, WV | $8,597,534 |
| #256 | California-Lexington Park, MD | $8,554,244 |
| #257 | Janesville-Beloit, WI | $8,530,214 |
| #258 | Terre Haute, IN | $8,502,107 |
| #259 | East Stroudsburg, PA | $8,493,417 |
| #260 | Niles, MI | $8,455,695 |
| #261 | Flagstaff, AZ | $8,444,850 |
| #262 | Winchester, VA-WV | $8,419,006 |
| #263 | Bowling Green, KY | $8,368,247 |
| #264 | Las Cruces, NM | $8,339,710 |
| #265 | St. George, UT | $8,338,042 |
| #266 | Joplin, MO | $8,319,062 |
| #267 | San Angelo, TX | $8,284,455 |
| #268 | Bloomington, IN | $8,272,024 |
| #269 | Blacksburg-Christiansburg, VA | $8,271,597 |
| #270 | Bismarck, ND | $8,243,740 |
| #271 | Coeur d'Alene, ID | $8,112,478 |
| #272 | Yuba City, CA | $8,104,050 |
| #273 | Sebastian-Vero Beach, FL | $8,063,835 |
| #274 | Dalton, GA | $7,950,074 |
| #275 | Decatur, IL | $7,856,804 |
| #276 | Dubuque, IA | $7,840,579 |
| #277 | Manhattan, KS | $7,818,079 |
| #278 | Bangor, ME | $7,813,558 |
| #279 | Rocky Mount, NC | $7,799,020 |
| #280 | Sheboygan, WI | $7,747,640 |
| #281 | Pittsfield, MA | $7,682,977 |
| #282 | Mount Vernon-Anacortes, WA | $7,659,302 |
| #283 | Jackson, MI | $7,651,976 |
| #284 | Santa Fe, NM | $7,636,186 |
| #285 | Dothan, AL | $7,636,116 |
| #286 | Ames, IA | $7,583,257 |
| #287 | Rapid City, SD | $7,565,027 |
| #288 | Battle Creek, MI | $7,528,043 |
| #289 | Glens Falls, NY | $7,446,782 |
| #290 | Grand Junction, CO | $7,444,077 |
| #291 | Burlington, NC | $7,440,110 |
| #292 | Pueblo, CO | $7,436,671 |
| #293 | Logan, UT-ID | $7,425,275 |
| #294 | Wenatchee, WA | $7,403,597 |
| #295 | Vineland-Bridgeton, NJ | $7,376,321 |
| #296 | Auburn-Opelika, AL | $7,335,523 |
| #297 | Decatur, AL | $7,282,688 |
| #298 | Kankakee, IL | $7,282,382 |
| #299 | Hanford-Corcoran, CA | $7,258,824 |
| #300 | Columbus, IN | $7,205,692 |
| #301 | Hattiesburg, MS | $7,181,156 |
| #302 | Wichita Falls, TX | $7,096,972 |
| #303 | Ithaca, NY | $7,044,555 |
| #304 | Lake Havasu City-Kingman, AZ | $7,037,905 |
| #305 | Alexandria, LA | $7,037,021 |
| #306 | Watertown-Fort Drum, NY | $6,972,539 |
| #307 | Weirton-Steubenville, WV-OH | $6,966,489 |
| #308 | Lebanon, PA | $6,911,784 |
| #309 | Punta Gorda, FL | $6,911,071 |
| #310 | Madera, CA | $6,907,890 |
| #311 | Chambersburg-Waynesboro, PA | $6,846,649 |
| #312 | Elizabethtown-Fort Knox, KY | $6,819,777 |
| #313 | Muskegon, MI | $6,795,782 |
| #314 | Missoula, MT | $6,780,085 |
| #315 | Altoona, PA | $6,736,868 |
| #316 | Monroe, MI | $6,716,820 |
| #317 | St. Joseph, MO-KS | $6,700,369 |
| #318 | Cheyenne, WY | $6,608,922 |
| #319 | Williamsport, PA | $6,562,069 |
| #320 | Valdosta, GA | $6,529,753 |
| #321 | Jonesboro, AR | $6,494,679 |
| #322 | Fairbanks, AK | $6,477,984 |
| #323 | Albany, GA | $6,462,473 |
| #324 | New Bern, NC | $6,436,366 |
| #325 | Owensboro, KY | $6,434,476 |
| #326 | Ocean City, NJ | $6,279,126 |
| #327 | Grand Forks, ND-MN | $6,226,443 |
| #328 | Morristown, TN | $6,218,224 |
| #329 | Carbondale-Marion, IL | $6,206,570 |
| #330 | Mankato, MN | $6,157,026 |
| #331 | Texarkana, TX-AR | $6,086,205 |
| #332 | Longview, WA | $6,047,768 |
| #333 | Florence-Muscle Shoals, AL | $5,989,958 |
| #334 | Casper, WY | $5,887,565 |
| #335 | Twin Falls, ID | $5,878,885 |
| #336 | Staunton, VA | $5,865,980 |
| #337 | Sherman-Denison, TX | $5,852,474 |
| #338 | Midland, MI | $5,836,461 |
| #339 | Fond du Lac, WI | $5,817,790 |
| #340 | Goldsboro, NC | $5,761,092 |
| #341 | Farmington, NM | $5,698,394 |
| #342 | Lawton, OK | $5,636,670 |
| #343 | Lewiston-Auburn, ME | $5,614,156 |
| #344 | Albany-Lebanon, OR | $5,608,491 |
| #345 | Lawrence, KS | $5,586,561 |
| #346 | Sumter, SC | $5,539,578 |
| #347 | The Villages, FL | $5,507,387 |
| #348 | Cleveland, TN | $5,423,969 |
| #349 | Sierra Vista-Douglas, AZ | $5,399,087 |
| #350 | Mansfield, OH | $5,251,489 |
| #351 | Homosassa Springs, FL | $5,247,686 |
| #352 | Corvallis, OR | $5,242,566 |
| #353 | Johnstown, PA | $5,197,201 |
| #354 | Springfield, OH | $5,162,330 |
| #355 | Brunswick, GA | $5,136,201 |
| #356 | Anniston-Oxford, AL | $5,108,424 |
| #357 | Victoria, TX | $5,082,222 |
| #358 | Bloomsburg-Berwick, PA | $4,916,778 |
| #359 | Hammond, LA | $4,897,538 |
| #360 | Grand Island, NE | $4,871,762 |
| #361 | Cape Girardeau, MO-IL | $4,838,122 |
| #362 | Beckley, WV | $4,563,061 |
| #363 | Rome, GA | $4,539,453 |
| #364 | Michigan City-La Porte, IN | $4,521,182 |
| #365 | Kokomo, IN | $4,488,369 |
| #366 | Muncie, IN | $4,486,204 |
| #367 | Hinesville, GA | $4,427,847 |
| #368 | Gettysburg, PA | $4,310,644 |
| #369 | Elmira, NY | $4,230,830 |
| #370 | Carson City, NV | $4,225,603 |
| #371 | Bay City, MI | $4,158,772 |
| #372 | Great Falls, MT | $4,150,622 |
| #373 | Cumberland, MD-WV | $4,025,355 |
| #374 | Parkersburg-Vienna, WV | $4,000,337 |
| #375 | Pine Bluff, AR | $3,996,508 |
| #376 | Hot Springs, AR | $3,907,112 |
| #377 | Pocatello, ID | $3,732,010 |
| #378 | Grants Pass, OR | $3,666,285 |
| #379 | Danville, IL | $3,645,245 |
| #380 | Walla Walla, WA | $3,642,288 |
| #381 | Lewiston, ID-WA | $3,274,461 |
| #382 | Gadsden, AL | $3,175,372 |
| #383 | Enid, OK | $2,926,730 |
| #384 | Sebring-Avon Park, FL | $2,894,022 |
| All U.S. Metro Areas | $20,943,239,585 |
As the graphic above makes obvious, NYC’s GDP towers over the rest. The Big Apple is the nerve center for a number of high-impact industries, including finance and media.
Moving down the ranking, LA has a $1.1 trillion economy, followed by Chicago, with a GDP of just over $760 billion.
The Fastest Growing Cities
Although many of the top ranking cities are not surprising, there are a number of up-and-coming cities in the list. A report from the Kenan Institute, at the University of North Carolina’s Business School, reveals the fastest growing cities in the U.S. in terms of GDP growth year-over-year. Here’s a look at the top 10:
| Rank | City | State | GDP Growth (2022) |
|---|---|---|---|
| #1 | San Francisco/Bay Area | California | 4.8% |
| #2 | Austin | Texas | 4.3% |
| #3 | Seattle | Washington | 3.5% |
| #4 | Raleigh/Durham | North Carolina | 3.4% |
| #5 | Dallas | Texas | 3.1% |
| #6 | Denver | Colorado | 3.0% |
| #7 | Salt Lake City | Utah | 2.8% |
| #8 | Charlotte | North Carolina | 2.5% |
| #9 | New Orleans | Louisiana | 2.4% |
| #10 | Orlando | Florida | 2.4% |
San Francisco, Seattle, and Dallas appear on both the overall GDP size and growth lists. Dallas’ economy is driven in large part by a growing healthcare industry. The city also continues to attract talent being home to large companies AT&T, CBRE Group, and Texas Instruments.
North Carolina is home to two of the fastest growing metropolitan areas, Raleigh-Durham and Charlotte. These cities may be ones to watch as they are becoming hubs of tech, research, and manufacturing. In fact, North Carolina was recently ranked as the most attractive U.S. state to do business in and both cities are among the fastest growing in terms of population.
The economic center of gravity within the U.S. could be shifting away from the traditional centers of power towards booming cities in the South and West of the United States. The Kenan Institute found that the recovery of hospitality and leisure sectors has helped destinations in these regions like New Orleans and Orlando. Additionally, the shift towards high-tech industry jobs, remote work, and cheaper housing have made these cities very attractive.
Of course, the sunny climate in these cities is an attractive selling point as well.


Agriculture
Mapped: Meat Consumption By Country and Type
By examining meat consumption by country, we uncover regional differences in how much, and what type of meat people around the world prefer.
 Creator Program
Mapped: Meat Consumption By Country and Type
Meat is always on the menu in many parts of the world, as we can see when we map out meat consumption by country.
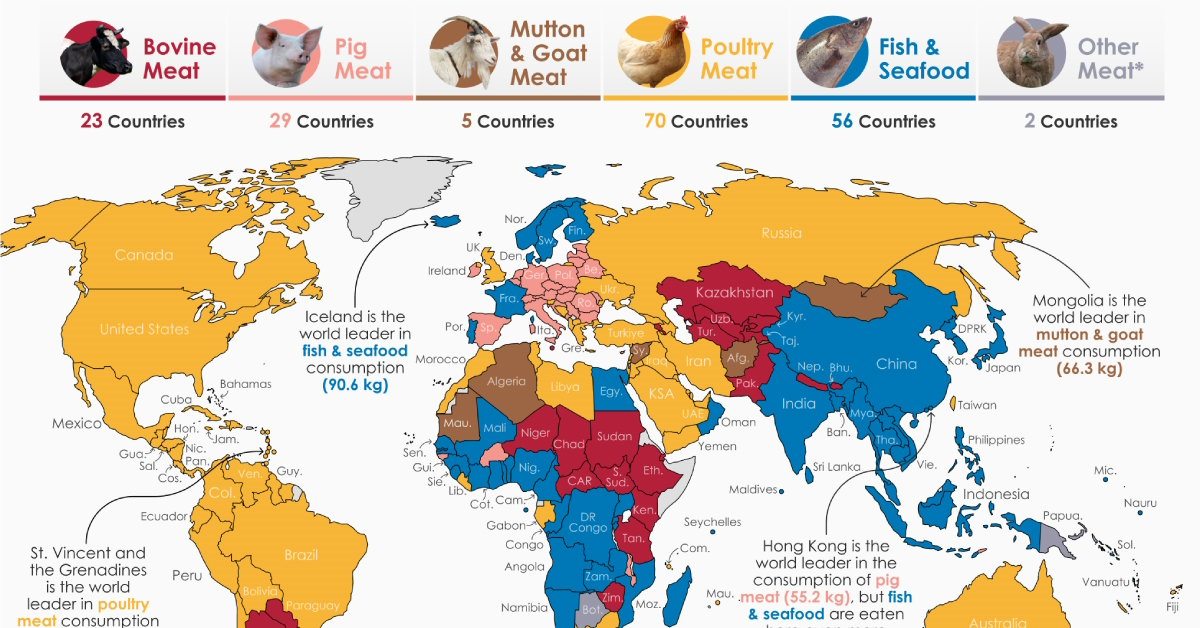
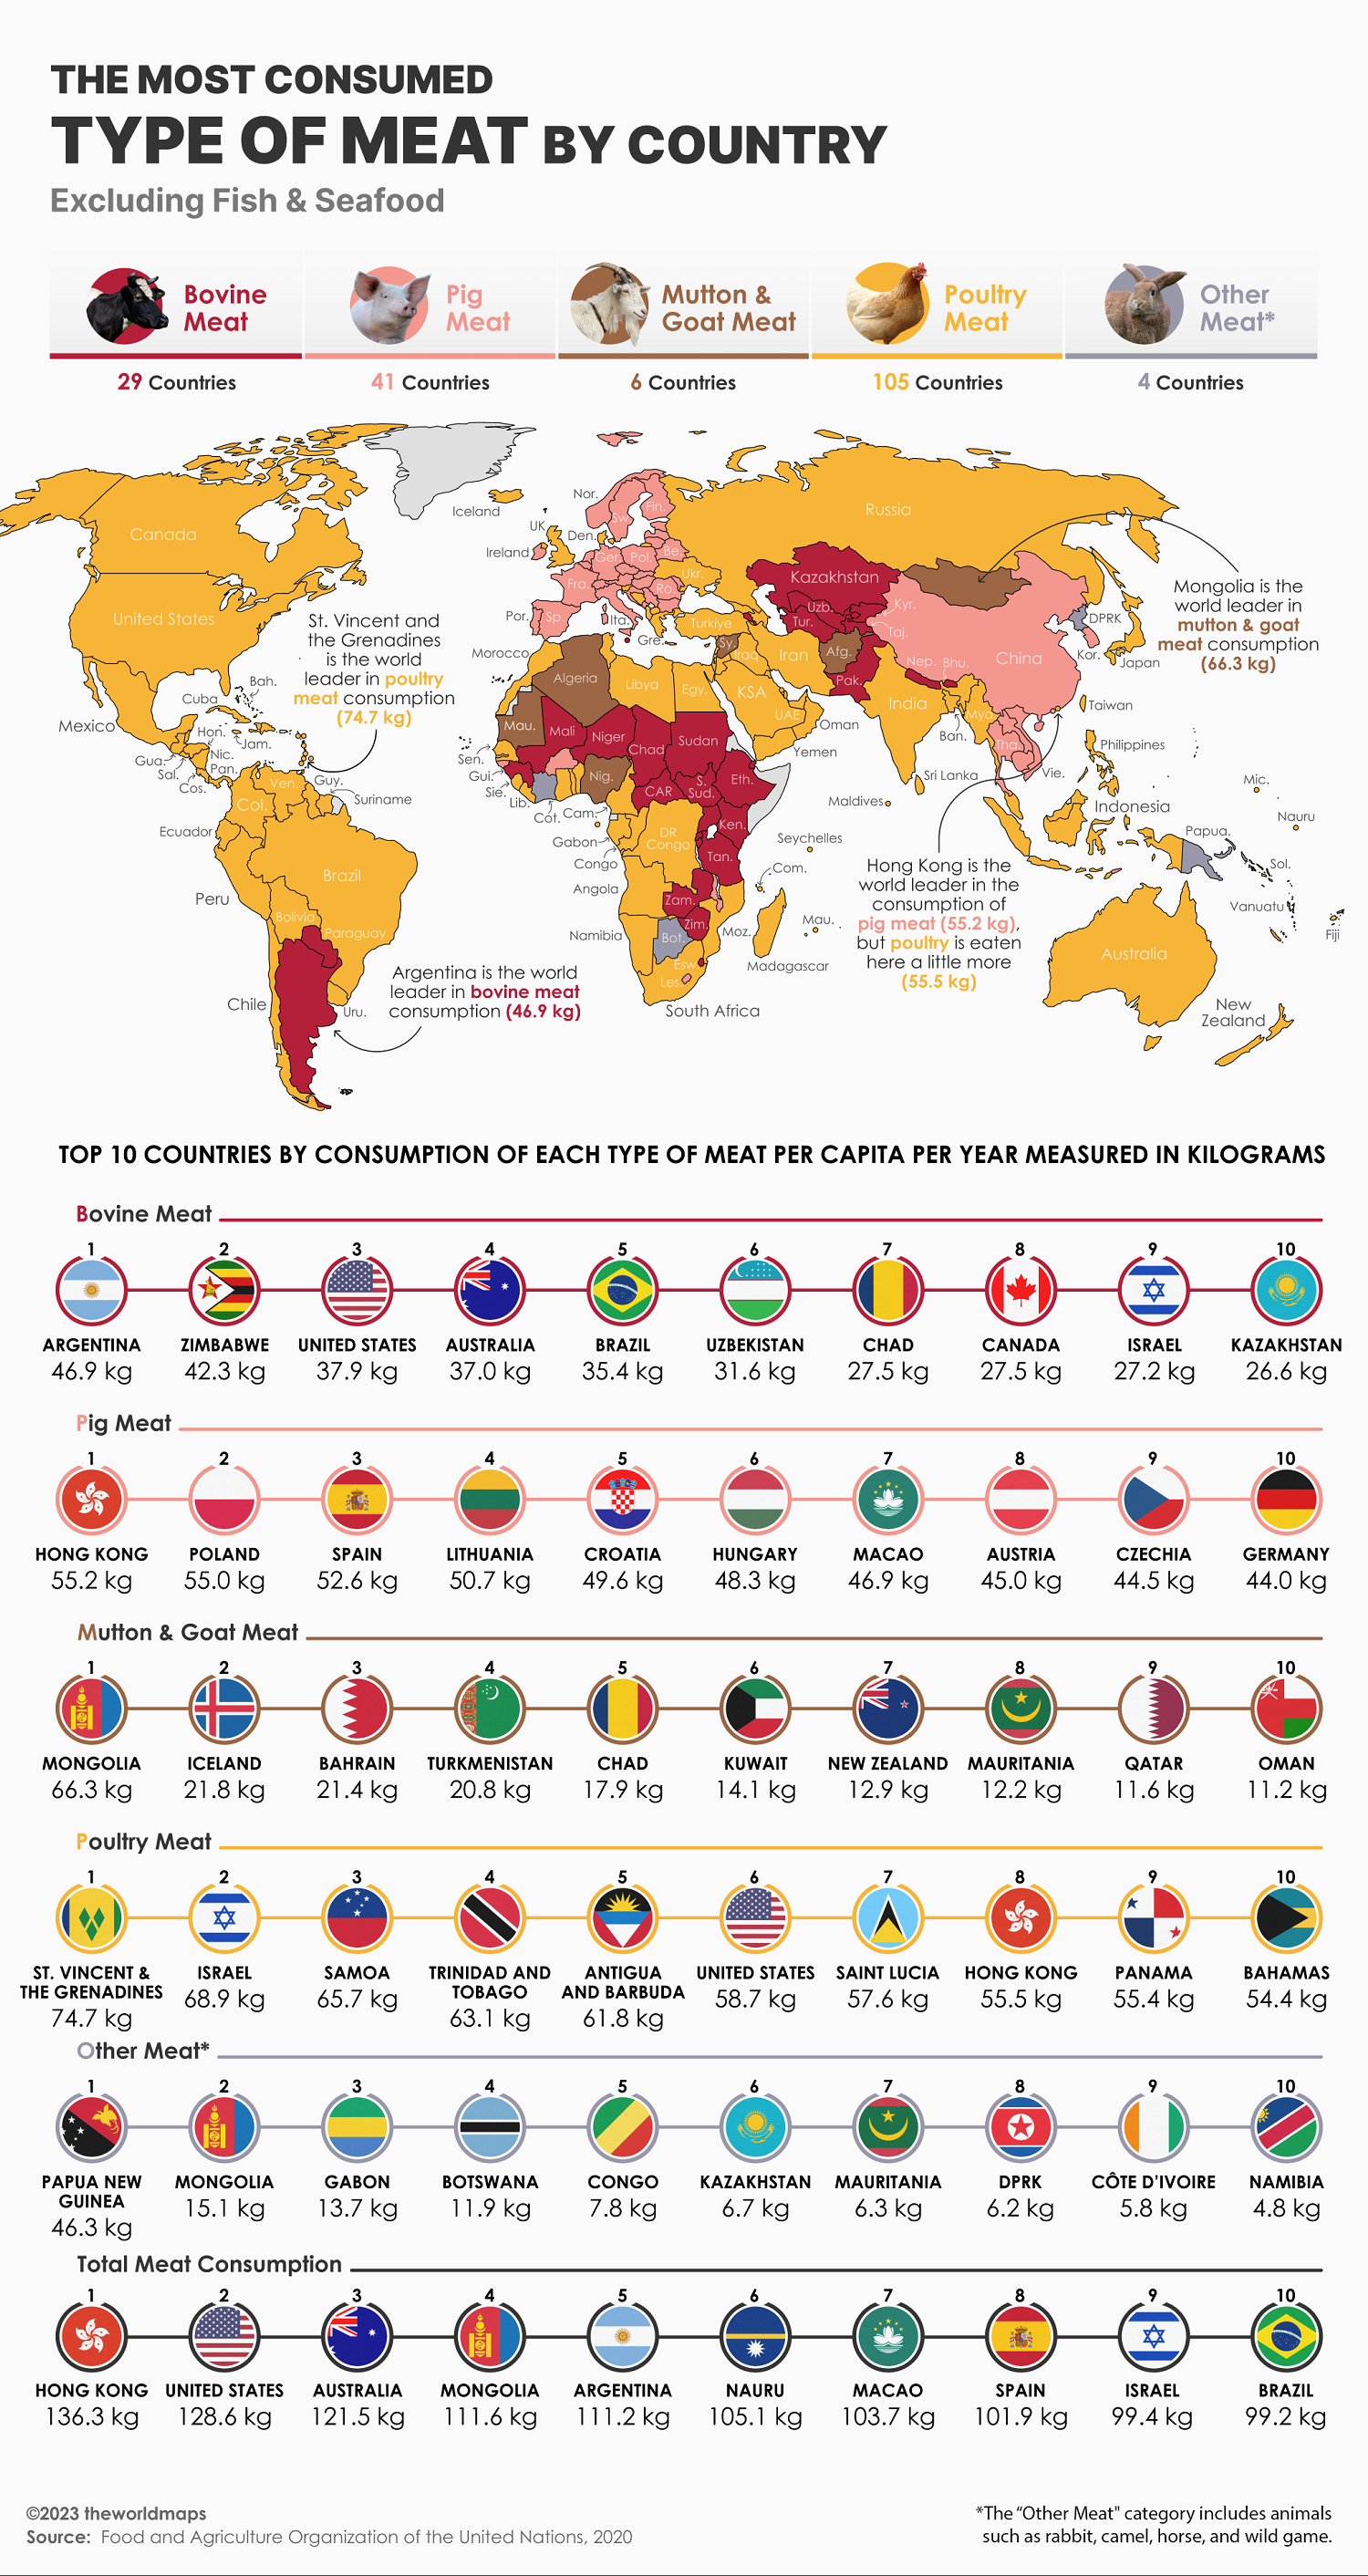
How do countries differ in how much, and what type of meat, they eat? In this colorful graphic, our creator theWORLDMAPS highlights the most consumed type of meat in every country in the world, using data from the UN’s Food and Agriculture Organization (FAO).
Each color denotes a different category of meat—beef, pork, mutton, poultry, seafood, or other—with annual consumption calculated per capita in kilograms (kg).
Let’s dig in to the data.
Is Fish Considered Meat?
Since meat is normally defined as the flesh of any animal (with the primary components being water, fat, and protein), that includes fish and other seafood.
But whether fish is considered “meat” or not depends a lot on cultural practices and dietary preferences, and has varied throughout history. Some earlier definitions of meat focused only on mammals, for example.
In Christianity for example, many denominations allow eating fish on fasting days when abstaining from meat. This was both due to distinctions between meat from warm-blooded land animals and cold-blooded animals (like fish), as well as the importance of fish consumption in parts of Europe where Christianity flourished.
To account for both sides of the debate, we’ll cover meat consumption by country both with and without fish and seafood.
The Most Consumed Meat by Country (Including Seafood)
Just by glancing at the map and the below table, poultry stands out as the most popular meat by weight consumption in 70 countries, or about 40% of the entire database.
Note: Other meat includes less frequently farmed animals like rabbit, horse, and camel, as well as game—meat from wild animals.
| Country | Most Consumed Meat |
|---|---|
| 🇦🇫 Afghanistan | Mutton & Goat |
| 🇦🇱 Albania | Poultry |
| 🇩🇿 Algeria | Mutton & Goat |
| 🇦🇴 Angola | Fish & Seafood |
| 🇦🇬 Antigua & Barbuda | Poultry |
| 🇦🇷 Argentina | Bovine |
| 🇦🇲 Armenia | Bovine |
| 🇦🇺 Australia | Poultry |
| 🇦🇹 Austria | Pork |
| 🇦🇿 Azerbaijan | Poultry |
| 🇧🇸 Bahamas | Poultry |
| 🇧🇭 Bahrain | Poultry |
| 🇧🇩 Bangladesh | Fish & Seafood |
| 🇧🇧 Barbados | Poultry |
| 🇧🇾 Belarus | Pork |
| 🇧🇪 Belgium | Pork |
| 🇧🇿 Belize | Poultry |
| 🇧🇯 Benin | Fish & Seafood |
| 🇧🇹 Bhutan | Bovine |
| 🇧🇴 Bolivia | Poultry |
| 🇧🇦 Bosnia & Herzegovina | Poultry |
| 🇧🇼 Botswana | Other |
| 🇧🇷 Brazil | Poultry |
| 🇧🇬 Bulgaria | Pork |
| 🇧🇫 Burkina Faso | Pork |
| 🇧🇮 Burundi | Fish & Seafood |
| 🇨🇻 Cabo Verde | Poultry |
| 🇰🇭 Cambodia | Fish & Seafood |
| 🇨🇲 Cameroon | Fish & Seafood |
| 🇨🇦 Canada | Poultry |
| 🇨🇫 Central African Republic | Bovine |
| 🇹🇩 Chad | Bovine |
| 🇨🇱 Chile | Poultry |
| 🇨🇳 China | Fish & Seafood |
| 🇨🇴 Colombia | Poultry |
| 🇰🇲 Comoros | Poultry |
| 🇨🇬 Congo | Fish & Seafood |
| 🇨🇷 Costa Rica | Poultry |
| 🇨🇮 Côte d’Ivoire | Fish & Seafood |
| 🇭🇷 Croatia | Pork |
| 🇨🇺 Cuba | Poultry |
| 🇨🇾 Cyprus | Pork |
| 🇨🇿 Czechia | Pork |
| 🇩🇰 Denmark | Fish & Seafood |
| 🇩🇯 Djibouti | Bovine |
| 🇩🇲 Dominica | Poultry |
| 🇩🇴 Dominican Republic | Poultry |
| 🇨🇩 DR Congo | Fish & Seafood |
| 🇪🇨 Ecuador | Poultry |
| 🇪🇬 Egypt | Fish & Seafood |
| 🇸🇻 El Salvador | Poultry |
| 🇪🇪 Estonia | Pork |
| 🇸🇿 Eswatini | Bovine |
| 🇪🇹 Ethiopia | Bovine |
| 🇫🇯 Fiji | Poultry |
| 🇫🇮 Finland | Fish & Seafood |
| 🇫🇷 France | Fish & Seafood |
| 🇵🇫 French Polynesia | Poultry |
| 🇬🇦 Gabon | Poultry |
| 🇬🇲 Gambia | Fish & Seafood |
| 🇬🇪 Georgia | Poultry |
| 🇩🇪 Germany | Pork |
| 🇬🇭 Ghana | Fish & Seafood |
| 🇬🇷 Greece | Poultry |
| 🇬🇩 Grenada | Poultry |
| 🇬🇹 Guatemala | Poultry |
| 🇬🇳 Guinea | Fish & Seafood |
| 🇬🇼 Guinea-Bissau | Pork |
| 🇬🇾 Guyana | Poultry |
| 🇭🇹 Haiti | Poultry |
| 🇭🇳 Honduras | Poultry |
| 🇭🇰 Hong Kong | Fish & Seafood |
| 🇭🇺 Hungary | Pork |
| 🇮🇸 Iceland | Fish & Seafood |
| 🇮🇳 India | Fish & Seafood |
| 🇮🇩 Indonesia | Fish & Seafood |
| 🇮🇷 Iran | Poultry |
| 🇮🇶 Iraq | Poultry |
| 🇮🇪 Ireland | Pork |
| 🇮🇱 Israel | Poultry |
| 🇮🇹 Italy | Pork |
| 🇯🇲 Jamaica | Poultry |
| 🇯🇵 Japan | Fish & Seafood |
| 🇯🇴 Jordan | Poultry |
| 🇰🇿 Kazakhstan | Bovine |
| 🇰🇪 Kenya | Bovine |
| 🇰🇮 Kiribati | Fish & Seafood |
| 🇰🇼 Kuwait | Poultry |
| 🇰🇬 Kyrgyzstan | Bovine |
| 🇱🇦 Laos | Fish & Seafood |
| 🇱🇻 Latvia | Pork |
| 🇱🇧 Lebanon | Poultry |
| 🇱🇸 Lesotho | Pork |
| 🇱🇷 Liberia | Poultry |
| 🇱🇾 Libya | Poultry |
| 🇱🇹 Lithuania | Pork |
| 🇱🇺 Luxembourg | Pork |
| 🇲🇴 Macao | Fish & Seafood |
| 🇲🇬 Madagascar | Fish & Seafood |
| 🇲🇼 Malawi | Pork |
| 🇲🇾 Malaysia | Fish & Seafood |
| 🇲🇻 Maldives | Fish & Seafood |
| 🇲🇱 Mali | Fish & Seafood |
| 🇲🇹 Malta | Bovine |
| 🇲🇷 Mauritania | Mutton & Goat |
| 🇲🇺 Mauritius | Poultry |
| 🇲🇽 Mexico | Poultry |
| 🇫🇲 Micronesia | Fish & Seafood |
| 🇲🇩 Moldova | Pork |
| 🇲🇳 Mongolia | Mutton & Goat |
| 🇲🇪 Montenegro | Pork |
| 🇲🇦 Morocco | Poultry |
| 🇲🇿 Mozambique | Fish & Seafood |
| 🇲🇲 Myanmar | Fish & Seafood |
| 🇳🇦 Namibia | Fish & Seafood |
| 🇳🇷 Nauru | Fish & Seafood |
| 🇳🇵 Nepal | Bovine |
| 🇳🇱 Netherlands | Pork |
| 🇳🇨 New Caledonia | Poultry |
| 🇳🇿 New Zealand | Fish & Seafood |
| 🇳🇮 Nicaragua | Poultry |
| 🇳🇪 Niger | Bovine |
| 🇳🇬 Nigeria | Fish & Seafood |
| 🇰🇵 North Korea | Fish & Seafood |
| 🇲🇰 North Macedonia | Poultry |
| 🇳🇴 Norway | Fish & Seafood |
| 🇴🇲 Oman | Fish & Seafood |
| 🇵🇰 Pakistan | Bovine |
| 🇵🇦 Panama | Poultry |
| 🇵🇬 Papua New Guinea | Other |
| 🇵🇾 Paraguay | Bovine |
| 🇵🇪 Peru | Poultry |
| 🇵🇭 Philippines | Fish & Seafood |
| 🇵🇱 Poland | Pork |
| 🇵🇹 Portugal | Fish & Seafood |
| 🇶🇦 Qatar | Poultry |
| 🇷🇴 Romania | Pork |
| 🇷🇺 Russia | Poultry |
| 🇷🇼 Rwanda | Fish & Seafood |
| 🇰🇳 Saint Kitts & Nevis | Poultry |
| 🇱🇨 Saint Lucia | Poultry |
| 🇻🇨 Saint Vincent & the Grenadines | Poultry |
| 🇼🇸 Samoa | Poultry |
| 🇸🇹 Sao Tome & Principe | Fish & Seafood |
| 🇸🇦 Saudi Arabia | Poultry |
| 🇸🇳 Senegal | Fish & Seafood |
| 🇷🇸 Serbia | Pork |
| 🇸🇨 Seychelles | Fish & Seafood |
| 🇸🇱 Sierra Leone | Fish & Seafood |
| 🇸🇰 Slovakia | Pork |
| 🇸🇮 Slovenia | Poultry |
| 🇸🇧 Solomon Islands | Fish & Seafood |
| 🇿🇦 South Africa | Poultry |
| 🇰🇷 South Korea | Fish & Seafood |
| 🇸🇸 South Sudan | Bovine |
| 🇪🇸 Spain | Pork |
| 🇱🇰 Sri Lanka | Fish & Seafood |
| 🇸🇩 Sudan | Bovine |
| 🇸🇷 Suriname | Poultry |
| 🇸🇪 Sweden | Fish & Seafood |
| 🇨🇭 Switzerland | Pork |
| 🇸🇾 Syria | Mutton & Goat |
| 🇹🇼 Taiwan | Poultry |
| 🇹🇯 Tajikistan | Bovine |
| 🇹🇿 Tanzania | Bovine |
| 🇹🇭 Thailand | Fish & Seafood |
| 🇹🇱 Timor-Leste | Pork |
| 🇹🇬 Togo | Fish & Seafood |
| 🇹🇹 Trinidad & Tobago | Poultry |
| 🇹🇳 Tunisia | Poultry |
| 🇹🇷 Türkiye | Poultry |
| 🇹🇲 Turkmenistan | Bovine |
| 🇺🇸 U.S. | Poultry |
| 🇦🇪 UAE | Poultry |
| 🇺🇬 Uganda | Fish & Seafood |
| 🇬🇧 UK | Poultry |
| 🇺🇦 Ukraine | Poultry |
| 🇺🇾 Uruguay | Poultry |
| 🇺🇿 Uzbekistan | Bovine |
| 🇻🇺 Vanuatu | Fish & Seafood |
| 🇻🇪 Venezuela | Poultry |
| 🇻🇳 Vietnam | Fish & Seafood |
| 🇾🇪 Yemen | Poultry |
| 🇿🇲 Zambia | Fish & Seafood |
| 🇿🇼 Zimbabwe | Bovine |
Fish & Seafood ranks as the second most popularly consumed meat in 56 countries, most of them with significant coastlines.
Here’s a breakdown of how much of each type of meat is eaten per capita in each country, measured in kilograms.
| Country | Poultry | Pork | Fish & Seafood | Bovine | Mutton & Other |
|---|---|---|---|---|---|
| 🇦🇫 Afghanistan | 1.7 | 0.0 | 0.4 | 3.2 | 4.3 |
| 🇦🇱 Albania | 13.9 | 5.3 | 8.7 | 11.7 | 8.3 |
| 🇩🇿 Algeria | 6.4 | 0.0 | 3.8 | 3.8 | 8.4 |
| 🇦🇴 Angola | 8.4 | 7.0 | 14.1 | 3.4 | 1.1 |
| 🇦🇬 Antigua & Barbuda | 61.8 | 14.3 | 54.1 | 5.0 | 1.0 |
| 🇦🇷 Argentina | 46.2 | 14.4 | 6.8 | 46.9 | 2.6 |
| 🇦🇲 Armenia | 15.3 | 8.1 | 5.5 | 23.9 | 3.6 |
| 🇦🇺 Australia | 48.7 | 24.2 | 24.1 | 37.0 | 11.5 |
| 🇦🇹 Austria | 15.7 | 45.0 | 14.3 | 14.9 | 1.4 |
| 🇦🇿 Azerbaijan | 14.4 | 0.6 | 2.0 | 13.5 | 8.4 |
| 🇧🇸 Bahamas | 54.4 | 23.8 | 24.2 | 5.2 | 1.7 |
| 🇧🇭 Bahrain | 44.0 | 0.8 | 16.3 | 13.7 | 22.2 |
| 🇧🇩 Bangladesh | 1.6 | 0.0 | 26.7 | 1.3 | 1.4 |
| 🇧🇧 Barbados | 49.3 | 12.3 | 42.9 | 8.0 | 3.4 |
| 🇧🇾 Belarus | 32.2 | 39.2 | 11.8 | 18.6 | 0.4 |
| 🇧🇪 Belgium | 12.4 | 32.8 | 22.7 | 14.0 | 2.6 |
| 🇧🇿 Belize | 23.8 | 20.8 | 13.3 | 3.6 | 0.3 |
| 🇧🇯 Benin | 8.7 | 0.7 | 16.2 | 3.6 | 1.5 |
| 🇧🇹 Bhutan | 4.6 | 1.9 | 7.3 | 9.3 | 0.3 |
| 🇧🇴 Bolivia | 40.9 | 9.7 | 2.8 | 21.6 | 4.9 |
| 🇧🇦 Bosnia & Herzegovina | 20.0 | 9.3 | 7.3 | 12.8 | 0.6 |
| 🇧🇼 Botswana | 3.5 | 0.5 | 2.6 | 10.2 | 14.3 |
| 🇧🇷 Brazil | 48.4 | 14.2 | 8.1 | 35.4 | 1.2 |
| 🇧🇬 Bulgaria | 21.5 | 30.0 | 7.4 | 3.5 | 2.0 |
| 🇧🇫 Burkina Faso | 9.5 | 15.2 | 8.9 | 5.3 | 4.3 |
| 🇧🇮 Burundi | 0.6 | 0.9 | 2.6 | 0.9 | 0.8 |
| 🇨🇻 Cabo Verde | 19.4 | 7.3 | 10.8 | 1.7 | 1.9 |
| 🇰🇭 Cambodia | 2.8 | 5.9 | 45.8 | 4.2 | 0.0 |
| 🇨🇲 Cameroon | 3.3 | 1.2 | 19.1 | 3.1 | 4.0 |
| 🇨🇦 Canada | 40.1 | 21.4 | 20.7 | 27.5 | 1.6 |
| 🇨🇫 Central African Republic | 2.6 | 4.1 | 7.4 | 20.8 | 10.4 |
| 🇹🇩 Chad | 0.5 | 0.2 | 6.6 | 27.5 | 18.7 |
| 🇨🇱 Chile | 36.1 | 22.1 | 14.8 | 23.7 | 1.3 |
| 🇨🇳 China | 15.6 | 35.5 | 39.9 | 6.8 | 4.2 |
| 🇨🇴 Colombia | 33.8 | 10.5 | 8.9 | 13.7 | 0.1 |
| 🇰🇲 Comoros | 26.8 | 0.1 | 14.3 | 3.0 | 1.2 |
| 🇨🇬 Congo | 23.2 | 6.8 | 24.5 | 1.9 | 8.1 |
| 🇨🇷 Costa Rica | 34.3 | 12.7 | 18.0 | 11.4 | 0.0 |
| 🇨🇮 Côte d’Ivoire | 2.9 | 1.0 | 23.2 | 1.4 | 6.5 |
| 🇭🇷 Croatia | 16.6 | 49.6 | 19.1 | 11.2 | 2.1 |
| 🇨🇺 Cuba | 37.7 | 21.6 | 6.1 | 7.4 | 4.9 |
| 🇨🇾 Cyprus | 28.4 | 36.8 | 25.5 | 5.9 | 4.6 |
| 🇨🇿 Czechia | 23.5 | 44.5 | 10.5 | 10.2 | 0.9 |
| 🇩🇰 Denmark | 24.6 | 13.5 | 26.5 | 24.3 | 1.3 |
| 🇩🇯 Djibouti | 3.6 | 0.1 | 3.5 | 6.2 | 5.4 |
| 🇩🇲 Dominica | 39.4 | 11.4 | 27.9 | 8.1 | 1.1 |
| 🇩🇴 Dominican Republic | 32.2 | 9.9 | 8.5 | 6.3 | 0.2 |
| 🇨🇩 DR Congo | 1.3 | 0.5 | 4.2 | 0.3 | 1.2 |
| 🇪🇨 Ecuador | 18.9 | 12.9 | 8.2 | 13.3 | 0.4 |
| 🇪🇬 Egypt | 14.3 | 0.0 | 27.1 | 7.4 | 1.5 |
| 🇸🇻 El Salvador | 25.9 | 4.7 | 6.5 | 8.2 | 0.0 |
| 🇪🇪 Estonia | 21.1 | 37.7 | 14.7 | 8.5 | 0.5 |
| 🇸🇿 Eswatini | 7.3 | 2.0 | 4.3 | 16.1 | 2.0 |
| 🇪🇹 Ethiopia | 0.6 | 0.0 | 0.5 | 3.8 | 3.5 |
| 🇫🇯 Fiji | 28.8 | 3.7 | 26.5 | 3.1 | 5.3 |
| 🇫🇮 Finland | 21.1 | 30.8 | 33.5 | 18.4 | 1.1 |
| 🇫🇷 France | 23.0 | 31.0 | 33.2 | 20.8 | 3.5 |
| 🇵🇫 French Polynesia | 48.8 | 14.3 | 47.3 | 21.4 | 3.7 |
| 🇬🇦 Gabon | 39.7 | 8.3 | 28.7 | 4.7 | 14.3 |
| 🇬🇲 Gambia | 10.6 | 0.3 | 25.2 | 3.4 | 1.1 |
| 🇬🇪 Georgia | 18.2 | 9.3 | 10.0 | 5.8 | 1.8 |
| 🇩🇪 Germany | 18.3 | 44.0 | 12.6 | 14.6 | 1.8 |
| 🇬🇭 Ghana | 11.6 | 1.2 | 24.9 | 1.6 | 4.2 |
| 🇬🇷 Greece | 25.6 | 25.0 | 21.7 | 14.5 | 9.4 |
| 🇬🇩 Grenada | 37.4 | 14.6 | 33.8 | 4.1 | 1.4 |
| 🇬🇹 Guatemala | 28.7 | 3.6 | 3.0 | 11.7 | 0.3 |
| 🇬🇳 Guinea | 2.7 | 0.2 | 9.7 | 8.2 | 2.8 |
| 🇬🇼 Guinea-Bissau | 3.1 | 7.2 | 1.2 | 3.7 | 1.3 |
| 🇬🇾 Guyana | 41.4 | 5.0 | 25.0 | 4.2 | 1.2 |
| 🇭🇹 Haiti | 10.9 | 4.0 | 5.0 | 4.2 | 0.9 |
| 🇭🇳 Honduras | 21.6 | 5.0 | 2.6 | 6.0 | 0.1 |
| 🇭🇰 Hong Kong | 55.5 | 55.2 | 65.8 | 22.5 | 3.0 |
| 🇭🇺 Hungary | 29.8 | 48.3 | 6.4 | 4.6 | 0.3 |
| 🇮🇸 Iceland | 30.0 | 21.8 | 90.6 | 14.0 | 24.4 |
| 🇮🇳 India | 2.6 | 0.2 | 8.0 | 1.1 | 0.6 |
| 🇮🇩 Indonesia | 13.7 | 0.9 | 44.4 | 2.8 | 0.5 |
| 🇮🇷 Iran | 26.0 | 0.0 | 12.6 | 7.6 | 4.5 |
| 🇮🇶 Iraq | 5.4 | 0.0 | 3.6 | 3.1 | 1.7 |
| 🇮🇪 Ireland | 24.7 | 31.1 | 22.6 | 19.8 | 3.6 |
| 🇮🇱 Israel | 68.9 | 1.6 | 24.7 | 27.2 | 1.7 |
| 🇮🇹 Italy | 19.6 | 32.9 | 29.2 | 15.9 | 1.8 |
| 🇯🇲 Jamaica | 53.9 | 3.1 | 25.2 | 3.8 | 0.7 |
| 🇯🇵 Japan | 22.3 | 21.3 | 46.2 | 9.6 | 0.3 |
| 🇯🇴 Jordan | 26.1 | 0.0 | 5.1 | 6.8 | 4.8 |
| 🇰🇿 Kazakhstan | 21.2 | 8.2 | 2.8 | 26.6 | 15.9 |
| 🇰🇪 Kenya | 1.3 | 0.4 | 2.9 | 4.5 | 4.5 |
| 🇰🇮 Kiribati | 26.6 | 10.3 | 73.2 | 1.9 | 0.3 |
| 🇰🇼 Kuwait | 46.6 | 0.0 | 14.0 | 9.4 | 16.7 |
| 🇰🇬 Kyrgyzstan | 5.2 | 2.1 | 1.1 | 14.9 | 10.0 |
| 🇱🇦 Laos | 6.6 | 13.5 | 24.1 | 8.4 | 0.5 |
| 🇱🇻 Latvia | 26.2 | 38.4 | 25.0 | 5.3 | 0.8 |
| 🇱🇧 Lebanon | 18.6 | 0.6 | 8.7 | 9.2 | 1.1 |
| 🇱🇸 Lesotho | 2.1 | 3.8 | 3.0 | 2.0 | 3.9 |
| 🇱🇷 Liberia | 11.3 | 5.3 | 4.3 | 0.4 | 2.1 |
| 🇱🇾 Libya | 32.8 | 0.0 | 14.3 | 2.9 | 6.5 |
| 🇱🇹 Lithuania | 33.3 | 50.7 | 33.1 | 5.9 | 1.1 |
| 🇱🇺 Luxembourg | 18.1 | 33.1 | 31.7 | 25.7 | 2.0 |
| 🇲🇴 Macao | 45.6 | 46.9 | 73.2 | 9.4 | 1.8 |
| 🇲🇬 Madagascar | 3.1 | 1.0 | 4.0 | 1.3 | 0.5 |
| 🇲🇼 Malawi | 5.7 | 11.8 | 10.1 | 2.9 | 3.1 |
| 🇲🇾 Malaysia | 50.2 | 7.4 | 54.7 | 6.0 | 1.0 |
| 🇲🇻 Maldives | 11.0 | 0.4 | 83.1 | 5.9 | 0.8 |
| 🇲🇱 Mali | 2.4 | 0.1 | 8.5 | 3.6 | 2.6 |
| 🇲🇹 Malta | 25.2 | 25.8 | 22.8 | 26.4 | 1.8 |
| 🇲🇷 Mauritania | 6.3 | 0.0 | 8.4 | 6.4 | 18.4 |
| 🇲🇺 Mauritius | 38.7 | 3.2 | 24.0 | 4.5 | 4.2 |
| 🇲🇽 Mexico | 35.9 | 19.1 | 13.6 | 14.6 | 1.5 |
| 🇫🇲 Micronesia | 38.2 | 16.2 | 47.4 | 4.9 | 0.2 |
| 🇲🇩 Moldova | 17.2 | 19.2 | 11.7 | 1.9 | 0.3 |
| 🇲🇳 Mongolia | 3.0 | 0.6 | 0.6 | 26.6 | 81.4 |
| 🇲🇪 Montenegro | 17.1 | 43.2 | 15.6 | 15.0 | 2.1 |
| 🇲🇦 Morocco | 24.0 | 0.0 | 18.4 | 7.7 | 6.9 |
| 🇲🇿 Mozambique | 3.8 | 3.1 | 13.4 | 0.6 | 0.1 |
| 🇲🇲 Myanmar | 29.9 | 20.1 | 45.0 | 9.3 | 1.7 |
| 🇳🇦 Namibia | 10.2 | 4.5 | 11.9 | 8.8 | 8.9 |
| 🇳🇷 Nauru | 51.0 | 28.2 | 51.0 | 19.1 | 6.9 |
| 🇳🇵 Nepal | 2.3 | 1.0 | 3.5 | 8.2 | 2.7 |
| 🇳🇱 Netherlands | 10.0 | 27.7 | 21.9 | 16.2 | 5.2 |
| 🇳🇨 New Caledonia | 40.9 | 17.4 | 23.4 | 17.7 | 2.3 |
| 🇳🇿 New Zealand | 26.0 | 25.2 | 26.4 | 18.6 | 15.3 |
| 🇳🇮 Nicaragua | 21.8 | 5.3 | 6.6 | 2.2 | 0.4 |
| 🇳🇪 Niger | 1.0 | 0.1 | 1.8 | 2.8 | 4.4 |
| 🇳🇬 Nigeria | 1.2 | 1.5 | 6.7 | 1.6 | 2.8 |
| 🇰🇵 North Korea | 1.8 | 4.3 | 11.0 | 0.8 | 6.7 |
| 🇲🇰 North Macedonia | 20.0 | 12.6 | 6.2 | 6.8 | 0.9 |
| 🇳🇴 Norway | 20.0 | 23.7 | 50.2 | 17.8 | 5.8 |
| 🇴🇲 Oman | 19.7 | 0.4 | 26.1 | 9.0 | 14.3 |
| 🇵🇰 Pakistan | 6.2 | 0.0 | 1.6 | 9.8 | 2.6 |
| 🇵🇦 Panama | 55.4 | 15.9 | 13.7 | 14.5 | 1.0 |
| 🇵🇬 Papua New Guinea | 3.9 | 9.9 | 14.6 | 0.8 | 47.8 |
| 🇵🇾 Paraguay | 9.6 | 8.8 | 4.0 | 21.9 | 0.6 |
| 🇵🇪 Peru | 42.7 | 4.5 | 27.1 | 4.2 | 1.9 |
| 🇵🇭 Philippines | 15.9 | 14.5 | 29.1 | 3.1 | 0.3 |
| 🇵🇱 Poland | 32.9 | 55.0 | 12.5 | 1.5 | 0.1 |
| 🇵🇹 Portugal | 30.6 | 38.1 | 60.0 | 18.8 | 2.8 |
| 🇶🇦 Qatar | 54.3 | 1.2 | 21.1 | 8.4 | 12.1 |
| 🇷🇴 Romania | 23.9 | 34.5 | 8.3 | 5.2 | 2.7 |
| 🇷🇺 Russia | 30.8 | 28.2 | 21.7 | 12.9 | 5.1 |
| 🇷🇼 Rwanda | 1.5 | 1.0 | 4.6 | 2.7 | 3.2 |
| 🇰🇳 Saint Kitts & Nevis | 48.7 | 15.5 | 38.8 | 2.9 | 2.5 |
| 🇱🇨 Saint Lucia | 57.6 | 14.9 | 33.6 | 3.8 | 2.0 |
| 🇻🇨 Saint Vincent & the Grenadines | 74.7 | 11.3 | 19.4 | 7.8 | 0.7 |
| 🇼🇸 Samoa | 65.7 | 12.3 | 47.6 | 6.9 | 3.5 |
| 🇸🇹 Sao Tome & Principe | 17.1 | 4.7 | 27.7 | 1.7 | 0.1 |
| 🇸🇦 Saudi Arabia | 43.0 | 0.0 | 11.7 | 4.4 | 7.7 |
| 🇸🇳 Senegal | 7.4 | 1.2 | 11.9 | 5.0 | 3.7 |
| 🇷🇸 Serbia | 14.1 | 37.3 | 6.7 | 6.1 | 4.1 |
| 🇸🇨 Seychelles | 36.9 | 13.7 | 56.8 | 9.2 | 2.7 |
| 🇸🇱 Sierra Leone | 5.4 | 1.0 | 25.5 | 1.3 | 1.9 |
| 🇸🇰 Slovakia | 16.9 | 38.8 | 10.2 | 5.8 | 0.9 |
| 🇸🇮 Slovenia | 30.4 | 25.8 | 13.2 | 15.3 | 1.1 |
| 🇸🇧 Solomon Islands | 6.1 | 4.4 | 28.1 | 1.8 | 0.1 |
| 🇿🇦 South Africa | 34.9 | 4.2 | 6.5 | 17.2 | 3.5 |
| 🇰🇷 South Korea | 22.8 | 38.4 | 55.3 | 16.9 | 0.5 |
| 🇸🇸 South Sudan | 4.3 | 0.0 | 2.9 | 12.4 | 4.3 |
| 🇪🇸 Spain | 33.6 | 52.6 | 40.8 | 12.3 | 3.4 |
| 🇱🇰 Sri Lanka | 10.4 | 0.1 | 29.0 | 1.2 | 0.1 |
| 🇸🇩 Sudan | 1.9 | 0.0 | 1.1 | 8.0 | 10.5 |
| 🇸🇷 Suriname | 49.6 | 8.0 | 16.5 | 4.4 | 0.3 |
| 🇸🇪 Sweden | 15.4 | 28.6 | 32.2 | 22.5 | 1.5 |
| 🇨🇭 Switzerland | 16.9 | 27.8 | 16.0 | 19.1 | 2.4 |
| 🇸🇾 Syria | 6.4 | 0.0 | 2.2 | 2.2 | 7.3 |
| 🇹🇼 Taiwan | 41.6 | 38.4 | 29.8 | 6.1 | 0.9 |
| 🇹🇯 Tajikistan | 3.5 | 0.1 | 0.7 | 25.8 | 7.8 |
| 🇹🇿 Tanzania | 1.5 | 0.3 | 6.4 | 7.8 | 1.6 |
| 🇹🇭 Thailand | 11.4 | 13.1 | 29.2 | 1.2 | 0.0 |
| 🇹🇱 Timor-Leste | 9.4 | 11.5 | 6.4 | 1.6 | 0.4 |
| 🇹🇬 Togo | 7.2 | 2.3 | 11.7 | 0.8 | 2.2 |
| 🇹🇹 Trinidad & Tobago | 63.1 | 5.6 | 23.6 | 5.7 | 1.5 |
| 🇹🇳 Tunisia | 17.9 | 0.0 | 14.1 | 3.7 | 5.8 |
| 🇹🇷 Türkiye | 20.0 | 0.0 | 5.5 | 16.0 | 1.3 |
| 🇹🇲 Turkmenistan | 6.1 | 0.1 | 2.8 | 22.5 | 20.8 |
| 🇺🇸 U.S. | 58.7 | 30.6 | 22.8 | 37.9 | 1.4 |
| 🇦🇪 UAE | 31.1 | 0.0 | 25.4 | 6.7 | 10.4 |
| 🇺🇬 Uganda | 1.5 | 2.9 | 14.3 | 3.6 | 1.0 |
| 🇬🇧 UK | 32.7 | 24.0 | 17.9 | 17.4 | 5.0 |
| 🇺🇦 Ukraine | 24.9 | 16.7 | 13.8 | 7.2 | 0.7 |
| 🇺🇾 Uruguay | 21.0 | 14.1 | 9.1 | 19.4 | 3.5 |
| 🇺🇿 Uzbekistan | 3.1 | 0.2 | 4.0 | 31.6 | 6.1 |
| 🇻🇺 Vanuatu | 14.6 | 12.4 | 29.0 | 7.2 | 0.3 |
| 🇻🇪 Venezuela | 16.1 | 4.4 | 10.2 | 12.0 | 0.3 |
| 🇻🇳 Vietnam | 15.8 | 38.2 | 39.6 | 6.1 | 0.5 |
| 🇾🇪 Yemen | 11.2 | 0.0 | 3.0 | 3.0 | 4.5 |
| 🇿🇲 Zambia | 2.6 | 1.5 | 13.1 | 9.3 | 2.7 |
| 🇿🇼 Zimbabwe | 4.6 | 0.7 | 3.0 | 42.3 | 4.3 |
The world’s largest consumers of meat per capita? Hong Kong, Iceland, and Macao have the highest total meat consumption, all above 170 kg (370 lbs) per capita.
We take a brief look through the biggest consumers of each type of meat below.
Who Eats the Most Poultry?
While the U.S. and China eat the most chicken by absolute numbers, the countries rank 7th and 112th respectively when it comes to poultry consumption on a per capita basis.
Several island nations—St. Vincent and the Grenadines, Trinidad & Tobago, Samoa—along with Israel eat more than 60 kilograms of poultry meat (about 15 large birds) per person on an annual basis.
Regionally, poultry consumption can be seen spanning almost all of the Americas, as well as in the UK and former British colonies Australia and South Africa, and in the Middle East.
Who Eats the Most Pork?
Despite eating more seafood and poultry, Hong Kong leads the world in pork consumption per capita annually at 55 kg (121 lbs). This is almost equivalent to the average amount of retail pork harvested from a single 250 lb pig.
Poland and Spain—who are also top pork producers—rank close behind Hong Kong with similar pork consumption numbers. Indeed, we can see pork as the most consumed meat in many European countries with local histories of pork foods, as well as in a few countries in Africa including Burkina Faso and one Southeast Asian country, Timor-Leste.
Who Eats the Most Fish and Seafood?
In the middle of the North Atlantic ocean, Iceland eats the most fish and seafood in the world, at a staggering 90 kg (nearly 200 lbs), per person per year. That also gives Iceland the crown for the highest per-capita consumption of any single type of meat.
Behind Iceland are other island and high coastline nations, including the Maldives, Hong Kong, Macao, and Portugal. Regionally we can see the importance of seafood reflected in East and South Asia, the Atlantic coastline of Africa, and the Nordic countries in Europe.
Who Eats the Most Beef?
Argentina’s 46-million-strong population eats nearly 47 kg (103 lbs) of bovine meat per person per year, the most by any country in the UN’s database.
The South American country has a rich culinary history with beef, as cattle brought by Spanish settlers flourished on the grassy plains of the region. Such is cattle’s importance on the continent that the gaucho—a horseman engaged in cattle work—is a folk symbol in Argentina, Uruguay and parts of Brazil (which ranks 5th in beef consumption).
The map of beef consumption highlights Central Asian countries including Uzbekistan and Eastern African countries including Ethiopia.
Who Eats the Most Mutton & Other Meat?
The people of Mongolia are unrivaled in their consumption of mutton and goat meat, devouring an impressive 66 kilograms (145 pounds) per capita annually. This voracious appetite for meat is deeply rooted in their heritage as a nation of skilled shepherds.
Papua New Guinea, meanwhile, tops the “other meat” consumption rankings. The country is the largest producer of game meat in the world, due to its mostly rural and indigenous population relying on hunting. One 2023 study found that a sample of villages in the country primarily hunted wild deer and boar for meat, although marsupials like bandicoots, tree-kangaroos, and cuscus were occasionally hunted and consumed as well.
Mongolia also ranks highly in consumption of other meat per capita, likely due to their traditional consumption of horse meat. The country produced just over 100,000 tons of horse meat in 2020, one-sixth of the country’s total meat production that year.
Mapping Meat Consumption By Country, Without Seafood
What happens to each country’s meat consumption habits if we remove fish and seafood from the dataset? The map, and the rankings change quite a bit.
Most of the blue on the map is replaced with a wash of yellow, indicating the global popularity of poultry meat as a cheap and efficient source of protein. However, much of East Asia including China and European countries like France and Sweden consume more pork.
The rankings for total meat consumption also shuffle.
| Country | Total (With Seafood) | Total (Without Seafood) |
|---|---|---|
| 🇦🇫 Afghanistan | 9.6 | 9.3 |
| 🇦🇱 Albania | 47.8 | 39.1 |
| 🇩🇿 Algeria | 22.4 | 18.6 |
| 🇦🇴 Angola | 34.1 | 19.9 |
| 🇦🇬 Antigua & Barbuda | 136.2 | 82.1 |
| 🇦🇷 Argentina | 116.9 | 110.2 |
| 🇦🇲 Armenia | 56.4 | 50.9 |
| 🇦🇺 Australia | 145.6 | 121.5 |
| 🇦🇹 Austria | 91.2 | 76.9 |
| 🇦🇿 Azerbaijan | 38.9 | 36.9 |
| 🇧🇸 Bahamas | 109.3 | 85.1 |
| 🇧🇭 Bahrain | 96.9 | 80.6 |
| 🇧🇩 Bangladesh | 31.1 | 4.3 |
| 🇧🇧 Barbados | 115.8 | 73.0 |
| 🇧🇾 Belarus | 102.2 | 90.4 |
| 🇧🇪 Belgium | 84.5 | 61.9 |
| 🇧🇿 Belize | 61.8 | 48.5 |
| 🇧🇯 Benin | 30.8 | 14.6 |
| 🇧🇹 Bhutan | 23.4 | 16.1 |
| 🇧🇴 Bolivia | 79.9 | 77.1 |
| 🇧🇦 Bosnia & Herzegovina | 50.1 | 42.8 |
| 🇧🇼 Botswana | 31.1 | 28.6 |
| 🇧🇷 Brazil | 107.2 | 99.2 |
| 🇧🇬 Bulgaria | 64.3 | 56.9 |
| 🇧🇫 Burkina Faso | 43.2 | 34.3 |
| 🇧🇮 Burundi | 5.7 | 3.1 |
| 🇨🇻 Cabo Verde | 41.2 | 30.4 |
| 🇰🇭 Cambodia | 58.6 | 12.9 |
| 🇨🇲 Cameroon | 30.8 | 11.6 |
| 🇨🇦 Canada | 111.3 | 90.6 |
| 🇨🇫 Central African Republic | 45.1 | 37.8 |
| 🇹🇩 Chad | 53.5 | 46.9 |
| 🇨🇱 Chile | 97.8 | 83.0 |
| 🇨🇳 China | 102.0 | 62.1 |
| 🇨🇴 Colombia | 67.0 | 58.1 |
| 🇰🇲 Comoros | 45.5 | 31.2 |
| 🇨🇬 Congo | 64.5 | 40.0 |
| 🇨🇷 Costa Rica | 76.4 | 58.5 |
| 🇨🇮 Côte d’Ivoire | 35.0 | 11.8 |
| 🇭🇷 Croatia | 98.6 | 79.5 |
| 🇨🇺 Cuba | 77.6 | 71.6 |
| 🇨🇾 Cyprus | 101.1 | 75.6 |
| 🇨🇿 Czechia | 89.6 | 79.2 |
| 🇩🇰 Denmark | 90.1 | 63.7 |
| 🇩🇯 Djibouti | 18.9 | 15.4 |
| 🇩🇲 Dominica | 87.9 | 60.1 |
| 🇩🇴 Dominican Republic | 57.1 | 48.6 |
| 🇨🇩 DR Congo | 7.4 | 3.3 |
| 🇪🇨 Ecuador | 53.6 | 45.4 |
| 🇪🇬 Egypt | 50.3 | 23.3 |
| 🇸🇻 El Salvador | 45.4 | 38.8 |
| 🇪🇪 Estonia | 82.4 | 67.8 |
| 🇸🇿 Eswatini | 31.7 | 27.4 |
| 🇪🇹 Ethiopia | 8.4 | 7.9 |
| 🇫🇯 Fiji | 67.4 | 40.9 |
| 🇫🇮 Finland | 104.8 | 71.4 |
| 🇫🇷 France | 111.5 | 78.2 |
| 🇵🇫 French Polynesia | 135.4 | 88.2 |
| 🇬🇦 Gabon | 95.7 | 67.0 |
| 🇬🇲 Gambia | 40.6 | 15.5 |
| 🇬🇪 Georgia | 45.1 | 35.1 |
| 🇩🇪 Germany | 91.4 | 78.8 |
| 🇬🇭 Ghana | 43.5 | 18.5 |
| 🇬🇷 Greece | 96.2 | 74.5 |
| 🇬🇩 Grenada | 91.3 | 57.5 |
| 🇬🇹 Guatemala | 47.2 | 44.2 |
| 🇬🇳 Guinea | 23.6 | 13.9 |
| 🇬🇼 Guinea-Bissau | 16.5 | 15.3 |
| 🇬🇾 Guyana | 76.8 | 51.8 |
| 🇭🇹 Haiti | 25.0 | 20.0 |
| 🇭🇳 Honduras | 35.4 | 32.8 |
| 🇭🇰 Hong Kong | 202.1 | 136.3 |
| 🇭🇺 Hungary | 89.3 | 82.9 |
| 🇮🇸 Iceland | 180.9 | 90.2 |
| 🇮🇳 India | 12.6 | 4.6 |
| 🇮🇩 Indonesia | 62.3 | 17.9 |
| 🇮🇷 Iran | 50.6 | 38.0 |
| 🇮🇶 Iraq | 13.8 | 10.2 |
| 🇮🇪 Ireland | 101.8 | 79.2 |
| 🇮🇱 Israel | 124.1 | 99.4 |
| 🇮🇹 Italy | 99.4 | 70.2 |
| 🇯🇲 Jamaica | 86.7 | 61.5 |
| 🇯🇵 Japan | 99.6 | 53.4 |
| 🇯🇴 Jordan | 42.8 | 37.7 |
| 🇰🇿 Kazakhstan | 74.7 | 71.9 |
| 🇰🇪 Kenya | 13.6 | 10.7 |
| 🇰🇮 Kiribati | 112.4 | 39.2 |
| 🇰🇼 Kuwait | 86.6 | 72.7 |
| 🇰🇬 Kyrgyzstan | 33.2 | 32.1 |
| 🇱🇦 Laos | 53.1 | 29.0 |
| 🇱🇻 Latvia | 95.8 | 70.8 |
| 🇱🇧 Lebanon | 38.2 | 29.5 |
| 🇱🇸 Lesotho | 14.7 | 11.7 |
| 🇱🇷 Liberia | 23.4 | 19.1 |
| 🇱🇾 Libya | 56.5 | 42.2 |
| 🇱🇹 Lithuania | 123.9 | 90.9 |
| 🇱🇺 Luxembourg | 110.6 | 78.9 |
| 🇲🇴 Macao | 176.9 | 103.7 |
| 🇲🇬 Madagascar | 9.8 | 5.8 |
| 🇲🇼 Malawi | 33.7 | 23.6 |
| 🇲🇾 Malaysia | 119.4 | 64.7 |
| 🇲🇻 Maldives | 101.2 | 18.1 |
| 🇲🇱 Mali | 17.1 | 8.6 |
| 🇲🇹 Malta | 102.0 | 79.1 |
| 🇲🇷 Mauritania | 39.5 | 31.1 |
| 🇲🇺 Mauritius | 74.5 | 50.5 |
| 🇲🇽 Mexico | 84.7 | 71.1 |
| 🇫🇲 Micronesia | 106.7 | 59.4 |
| 🇲🇩 Moldova | 50.3 | 38.6 |
| 🇲🇳 Mongolia | 112.1 | 111.6 |
| 🇲🇪 Montenegro | 93.0 | 77.4 |
| 🇲🇦 Morocco | 57.0 | 38.6 |
| 🇲🇿 Mozambique | 21.0 | 7.6 |
| 🇲🇲 Myanmar | 106.0 | 61.0 |
| 🇳🇦 Namibia | 44.3 | 32.4 |
| 🇳🇷 Nauru | 156.2 | 105.1 |
| 🇳🇵 Nepal | 17.7 | 14.2 |
| 🇳🇱 Netherlands | 81.0 | 59.1 |
| 🇳🇨 New Caledonia | 101.7 | 78.3 |
| 🇳🇿 New Zealand | 111.4 | 85.0 |
| 🇳🇮 Nicaragua | 36.3 | 29.6 |
| 🇳🇪 Niger | 10.1 | 8.3 |
| 🇳🇬 Nigeria | 13.8 | 7.0 |
| 🇰🇵 North Korea | 24.6 | 13.6 |
| 🇲🇰 North Macedonia | 46.6 | 40.3 |
| 🇳🇴 Norway | 117.4 | 67.2 |
| 🇴🇲 Oman | 69.5 | 43.4 |
| 🇵🇰 Pakistan | 20.2 | 18.6 |
| 🇵🇦 Panama | 100.5 | 86.8 |
| 🇵🇬 Papua New Guinea | 77.0 | 62.4 |
| 🇵🇾 Paraguay | 44.9 | 40.9 |
| 🇵🇪 Peru | 80.5 | 53.4 |
| 🇵🇭 Philippines | 62.8 | 33.7 |
| 🇵🇱 Poland | 102.0 | 89.5 |
| 🇵🇹 Portugal | 150.2 | 90.2 |
| 🇶🇦 Qatar | 96.9 | 75.9 |
| 🇷🇴 Romania | 74.7 | 66.4 |
| 🇷🇺 Russia | 98.6 | 76.9 |
| 🇷🇼 Rwanda | 12.9 | 8.4 |
| 🇰🇳 Saint Kitts & Nevis | 108.5 | 69.7 |
| 🇱🇨 Saint Lucia | 111.9 | 78.3 |
| 🇻🇨 Saint Vincent & the Grenadines | 113.8 | 94.4 |
| 🇼🇸 Samoa | 135.9 | 88.3 |
| 🇸🇹 Sao Tome & Principe | 51.3 | 23.6 |
| 🇸🇦 Saudi Arabia | 66.8 | 55.0 |
| 🇸🇳 Senegal | 29.1 | 17.2 |
| 🇷🇸 Serbia | 68.3 | 61.6 |
| 🇸🇨 Seychelles | 119.2 | 62.5 |
| 🇸🇱 Sierra Leone | 35.0 | 9.5 |
| 🇸🇰 Slovakia | 72.7 | 62.5 |
| 🇸🇮 Slovenia | 85.7 | 72.5 |
| 🇸🇧 Solomon Islands | 40.5 | 12.4 |
| 🇿🇦 South Africa | 66.2 | 59.8 |
| 🇰🇷 South Korea | 133.8 | 78.5 |
| 🇸🇸 South Sudan | 23.9 | 21.0 |
| 🇪🇸 Spain | 142.7 | 101.9 |
| 🇱🇰 Sri Lanka | 40.8 | 11.8 |
| 🇸🇩 Sudan | 21.5 | 20.3 |
| 🇸🇷 Suriname | 78.8 | 62.3 |
| 🇸🇪 Sweden | 100.2 | 68.0 |
| 🇨🇭 Switzerland | 82.2 | 66.2 |
| 🇸🇾 Syria | 18.0 | 15.8 |
| 🇹🇼 Taiwan | 116.7 | 87.0 |
| 🇹🇯 Tajikistan | 37.9 | 37.2 |
| 🇹🇿 Tanzania | 17.6 | 11.2 |
| 🇹🇭 Thailand | 54.9 | 25.8 |
| 🇹🇱 Timor-Leste | 29.3 | 22.9 |
| 🇹🇬 Togo | 24.2 | 12.5 |
| 🇹🇹 Trinidad & Tobago | 99.5 | 75.9 |
| 🇹🇳 Tunisia | 41.4 | 27.3 |
| 🇹🇷 Türkiye | 42.8 | 37.3 |
| 🇹🇲 Turkmenistan | 52.2 | 49.4 |
| 🇺🇸 U.S. | 151.4 | 128.6 |
| 🇦🇪 UAE | 73.6 | 48.2 |
| 🇺🇬 Uganda | 23.3 | 9.0 |
| 🇬🇧 UK | 97.0 | 79.1 |
| 🇺🇦 Ukraine | 63.3 | 49.5 |
| 🇺🇾 Uruguay | 67.3 | 58.1 |
| 🇺🇿 Uzbekistan | 45.0 | 41.0 |
| 🇻🇺 Vanuatu | 63.5 | 34.5 |
| 🇻🇪 Venezuela | 43.1 | 32.9 |
| 🇻🇳 Vietnam | 100.2 | 60.6 |
| 🇾🇪 Yemen | 21.7 | 18.7 |
| 🇿🇲 Zambia | 29.3 | 16.2 |
| 🇿🇼 Zimbabwe | 54.9 | 51.9 |
Hong Kong remains at the top, but the U.S. jumps up three spots to second place, with annual per capita meat consumption at 128 kg (282 lbs) when seafood isn’t included.
Iceland and Macao drop to the top 15, while Australia, Mongolia, and Argentina climb into the top five. Other countries that preferred seafood dropped a lot lower, such as Japan, which fell 40 spots in the total consumption rankings when fish was removed.
-

 Technology1 week ago
Charted: Changing Sentiments Towards AI in the Workplace
-

 Markets3 weeks ago
What are Top Investment Managers Holding in Their Portfolios?
-

 Markets1 week ago
The 50 Best One-Year Returns on the S&P 500 (1980-2022)
-

 Markets3 weeks ago
Chart: U.S. Home Price Growth Over 50 Years
-

 Crime1 week ago
Mapped: The Most Dangerous Cities in the U.S.
-

 Energy3 weeks ago
How Old Are the World’s Nuclear Reactors?
-

 Countries7 days ago
Mapped: World’s Top 40 Largest Military Budgets
-

 Markets3 weeks ago
How Big is the Market for Crude Oil?