Urbanization
Mapping Human Impact Across the World
Article/Editing:
Click to view this graphic in a higher-resolution.
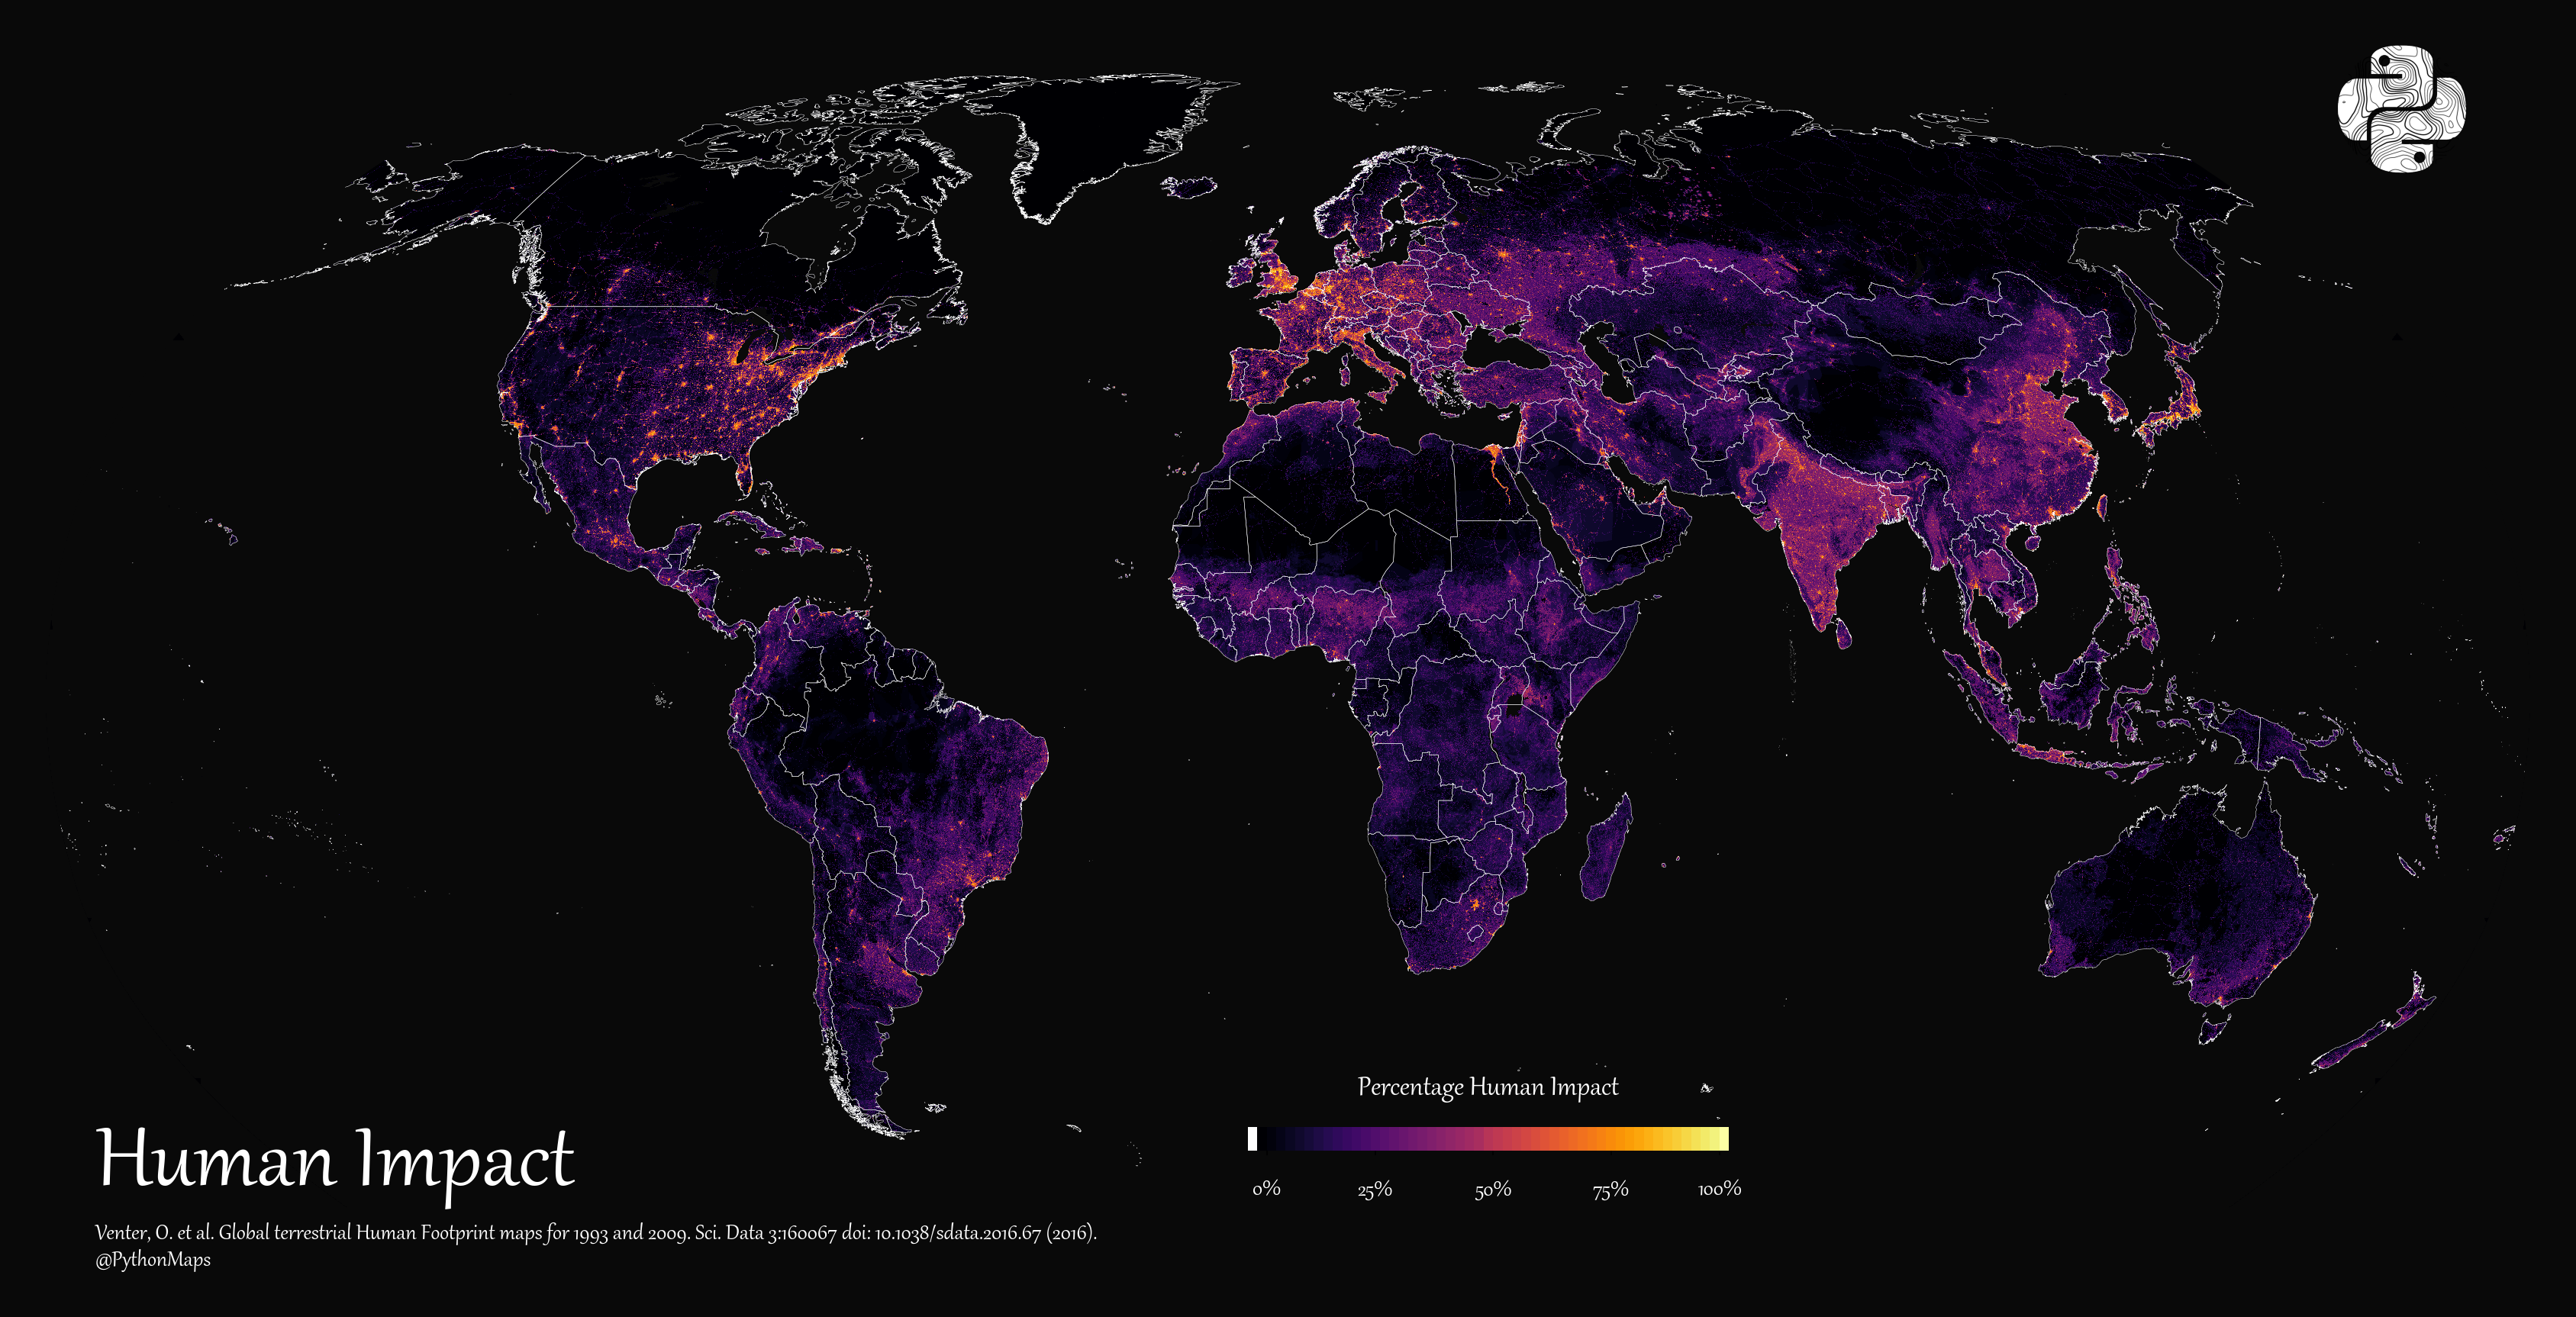
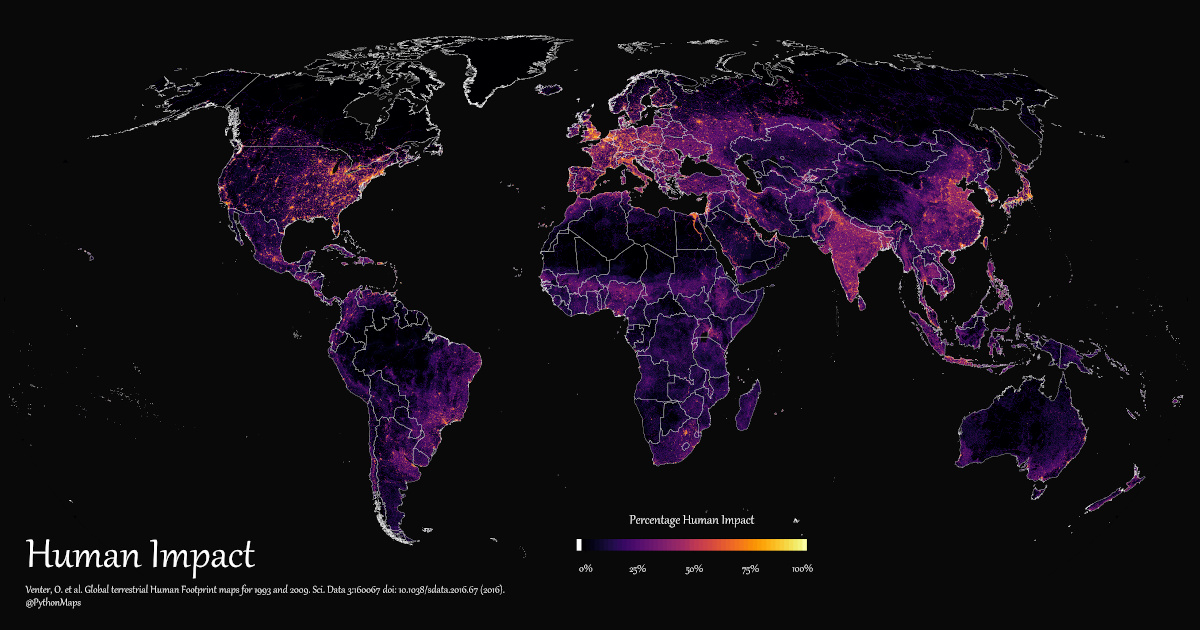
Mapping Human Impact Across the World
Since the dawn of human history, our activities have left an impact on Earth—from gathering food to farming, from building homes and cities to traveling across oceans.
And as the global population expanded and civilizations became more complex, that impact grew alongside it. Mass agriculture, natural resource extraction, and creation of urban infrastructure are just some of the visible markers of modern human development.
In this graphic, Adam Symington maps the extent of humanity’s impact on the world from 1993 to 2009, using information provided by the scientific paper titled “Global Terrestrial Human Footprint Maps for 1993 and 2009.”
Variables for Measuring Human Impact
To accurately plot and measure human impact, the researches compiled studies and surveys from 1993 to 2009 across eight variables of human “pressure”:
- Built environments
- Population density
- Night-time lights
- Croplands
- Pasture
- Roads
- Railways
- Navigable waterways
- The Boston–Washington corridor (including New York City) in the U.S.
- The “Blue Banana” corridor in Europe from the UK to Northern Italy.
- The Nile Delta and Greater Cairo in Egypt.
- The Taiheiyō Belt in Japan (including Tokyo and Osaka).
These different pressures were then normalized and weighted, as some have a noticeably greater impact on the surrounding environments than others. Once plotted and overlayed, we can see where human impact was the highest.
What Caused the Largest Impact?
According to the research, increases in population density, housing development, and road and rail networks were the primary growth factors for human impact.
This caused the overall footprint to increase dramatically in densest urban centers of the world. The brightest and most visible on the map include:
Many other areas in South America, Central Africa, and South Asia, also saw human impact increase due to both increased urbanization and agriculture. Especially noticeable is the relatively even growth in human impact across Pakistan, India, and Bangladesh.
Untouched Wildernesses
While humanity’s footprint has transformed various parts of the world, some areas have been left untouched, to some extent.
The frigid Arctic terrains of Northern Canada, Greenland, Iceland, and Eastern Russia barely saw any change between 1993 and 2009.
Likewise, the Amazon rainforest in South America, the Sahara Desert in Africa, the Tibetan Plateau in Asia and the desert in Western Australia had large swaths of land with almost no human impact. However, they all had small patches of measured human impact, either through infrastructure development or resource extraction.
And though there were still corners of the Earth with little to no human impact in 2009, changes since in demographics, politics, and consumption could have an outsized effect on humanity’s footprint both now and into the future.

This article was published as a part of Visual Capitalist's Creator Program, which features data-driven visuals from some of our favorite Creators around the world.


Base Metals
Ranked: The World’s Biggest Steel Producers, by Country
China has dominated global steel production the past few decades, but how did the country get here, and is its production growth over?
Ranked: The World’s Biggest Steel Producers, by Country
This was originally posted on Elements. Sign up to the free mailing list to get beautiful visualizations on real assets and resource megatrends each week.
Steel is a critical component of modern industry and economy, essential for the construction of buildings, automobiles, and many other appliances and infrastructure used in our daily lives.
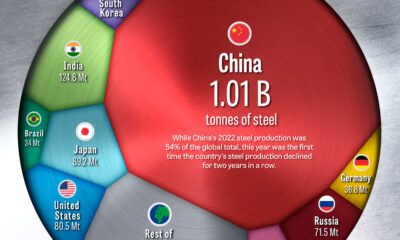
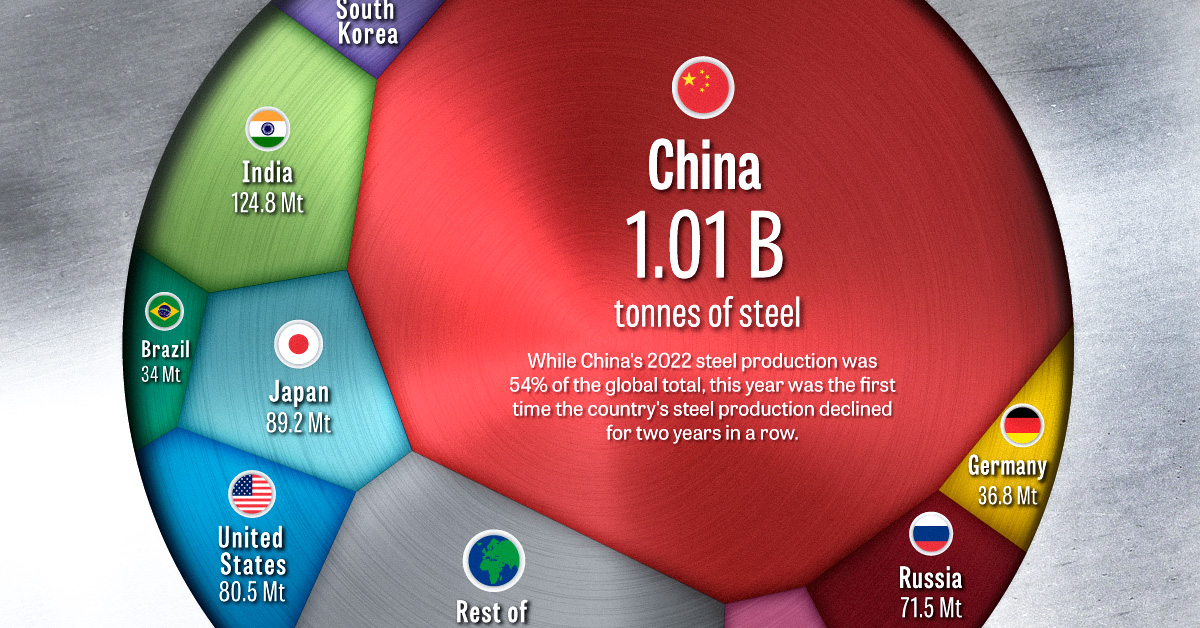
This graphic uses data from the World Steel Association to visualize the world’s top steel-producing countries, and highlights China’s ascent to the top, as it now makes up more than half of the world’s steel production.
The State of Global Steel Production
Global steel production in 2022 reached 1,878 million tonnes, barely surpassing the pre-pandemic production of 1,875 million tonnes in 2019.
| Country | 2022 Production (in million tonnes) | Annual Production Change | Global Share |
|---|---|---|---|
| 🇨🇳 China | 1013.0 | -2.0% | 53.9% |
| 🇮🇳 India | 124.8 | 5.3% | 6.6% |
| 🇯🇵 Japan | 89.2 | -7.9% | 4.8% |
| 🇺🇸 United States | 80.5 | -6.5% | 4.3% |
| 🇷🇺 Russia | 71.5 | -5.8% | 3.8% |
| 🇰🇷 South Korea | 65.9 | -6.9% | 3.5% |
| 🇩🇪 Germany | 36.8 | -8.8% | 2.0% |
| 🇹🇷 Türkiye | 35.1 | -15.0% | 1.9% |
| 🇧🇷 Brazil | 34.0 | -6.5% | 1.8% |
| 🇮🇷 Iran | 30.6 | 6.8% | 1.6% |
| 🇮🇹 Italy | 21.6 | -13.0% | 1.1% |
| 🇹🇼 Taiwan | 20.7 | -12.1% | 1.1% |
| 🇻🇳 Vietnam | 20.0 | -15.0% | 1.1% |
| 🇲🇽 Mexico | 18.2 | -1.9% | 1.0% |
| 🇮🇩 Indonesia | 15.6 | 8.3% | 0.8% |
| Rest of World | 201.0 | -11.2% | 10.7% |
| World Total | 1878.5 | -3.9% | 100.0% |
2022’s steel production marked a significant reduction compared to the post-pandemic rebound of 1,960 million tonnes in 2021, with a year-over-year decline of 4.2%–the largest drop since 2009, and prior to that, 1991.
This decline was spread across many of the world’s top steel producers, with only three of the top fifteen countries, India, Iran, and Indonesia, increasing their yearly production. Most of the other top steel-producing countries saw annual production declines of more than 5%, with Turkey, Italy, Taiwan, and Vietnam’s production all declining by double digits.
Even the world’s top steel-producing nation, China, experienced a modest 2% decline, which due to the country’s large production amounted to a decline of 19.8 million tonnes, more than many other nations produce in a year.
Despite India, the world’s second-largest steel producer, increasing its production by 5.3%, the country’s output still amounts to just over one-tenth of the steel produced by China.
China’s Meteoric Rise in Steel Production
Although China dominates the world’s steel production with more than a 54% share today, this hasn’t always been the case.
In 1967, the World Steel Association’s first recorded year of steel production figures, China only produced an estimated 14 million tonnes, making up barely 3% of global output. At that time, the U.S. and the USSR were competing as the world’s top steel producers at 115 and 102 million tonnes respectively, followed by Japan at 62 million tonnes.
Almost three decades later in 1996, China had successively overtaken Russia, the U.S., and Japan to become the top steel-producing nation with 101 million tonnes of steel produced that year.
The early 2000s marked a period of rapid growth for China, with consistent double-digit percentage increases in steel production each year.
The Recent Decline in China’s Steel Production
Since the early 2000s, China’s average annual growth in steel production has slowed to 3.4% over the last decade (2013-2022), a considerable decline compared to the previous decade’s (2003-2012) 15.2% average annual growth rate.
The past couple of years have seen China’s steel production decline, with 2021 and 2022 marking the first time the country’s production fell for two consecutive years in a row.
While it’s unlikely China will relinquish its position as the top steel-producing nation anytime soon, it remains to be seen whether this recent decline marks the beginning of a new trend or just a brief deviation from the country’s consistent production growth.
-

 Environment5 days ago
Hotter Than Ever: 2023 Sets New Global Temperature Records
-

 Datastream4 weeks ago
Can You Calculate Your Daily Carbon Footprint?
-

 Energy2 weeks ago
Who’s Still Buying Russian Fossil Fuels in 2023?
-

 VC+4 days ago
What’s New on VC+ in July
-

 Investor Education4 weeks ago
Visualizing BlackRock’s Top Equity Holdings
-

 apps2 weeks ago
Meet the Competing Apps Battling for Twitter’s Market Share
-

 Politics14 hours ago
How Do Chinese Citizens Feel About Other Countries?
-

 Markets4 weeks ago
Visualizing Every Company on the S&P 500 Index