Batteries
Visualizing China’s Dominance in Clean Energy Metals
![]() Subscribe to the Elements free mailing list for more like this
Subscribe to the Elements free mailing list for more like this
Visualizing China’s Dominance in Clean Energy Metals
This was originally posted on Elements. Sign up to the free mailing list to get beautiful visualizations on natural resource megatrends in your email every week.
Renewable sources of energy are expected to replace fossil fuels over the coming decades, and this large-scale transition will have a downstream effect on the demand of raw materials. More green energy means more wind turbines, solar panels, and batteries needed, and more clean energy metals necessary to build these technologies.
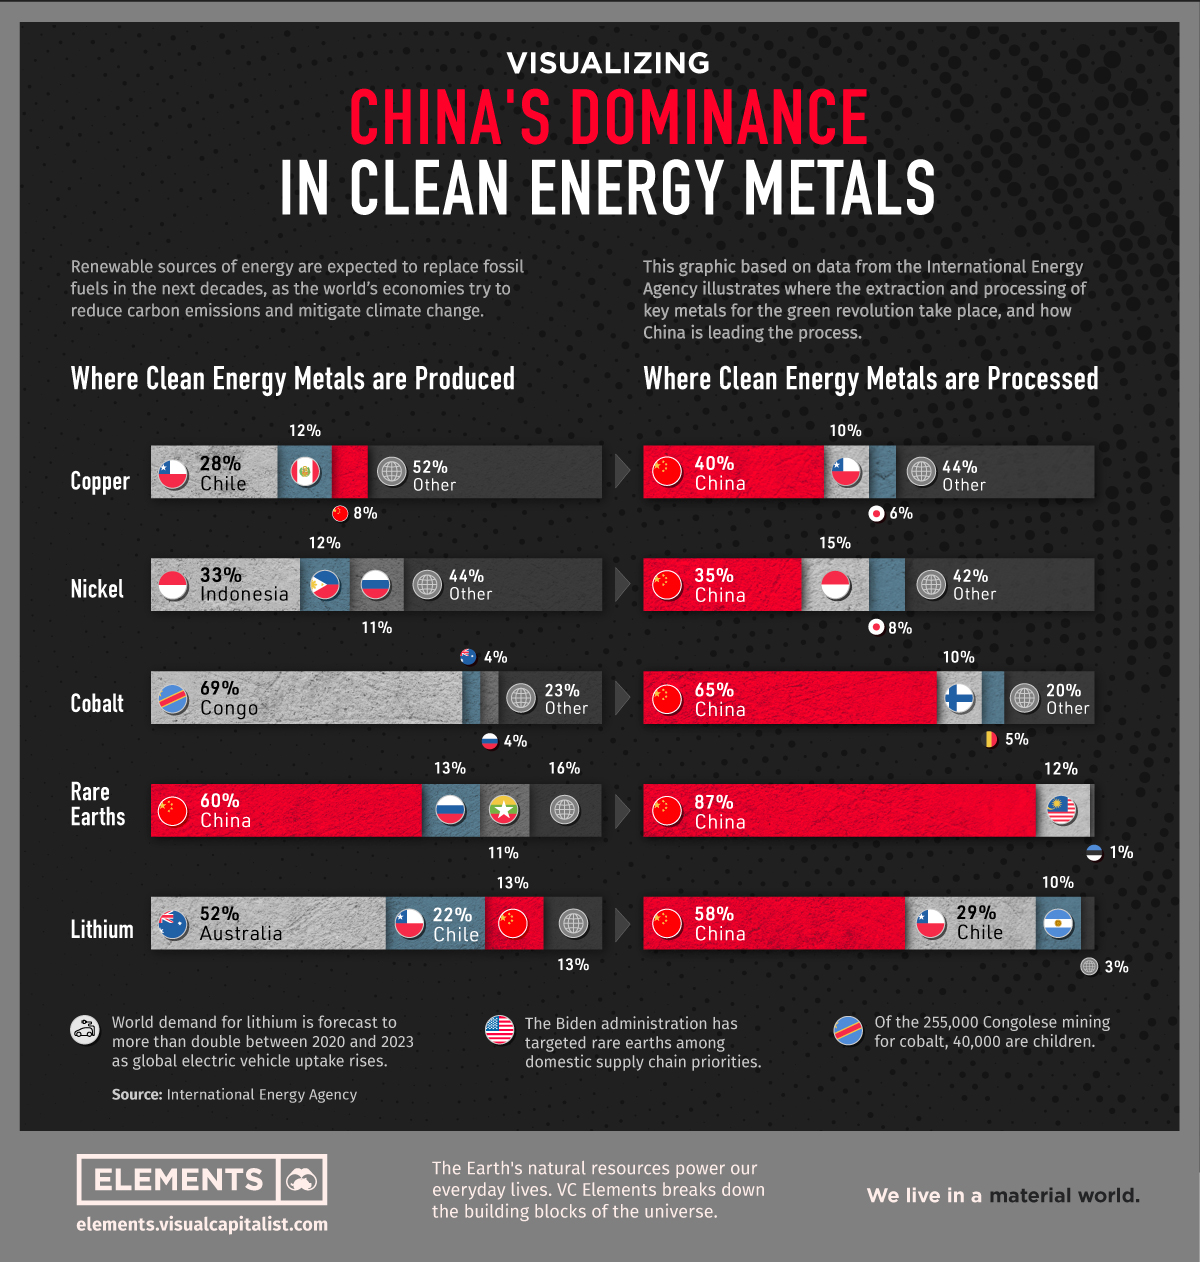
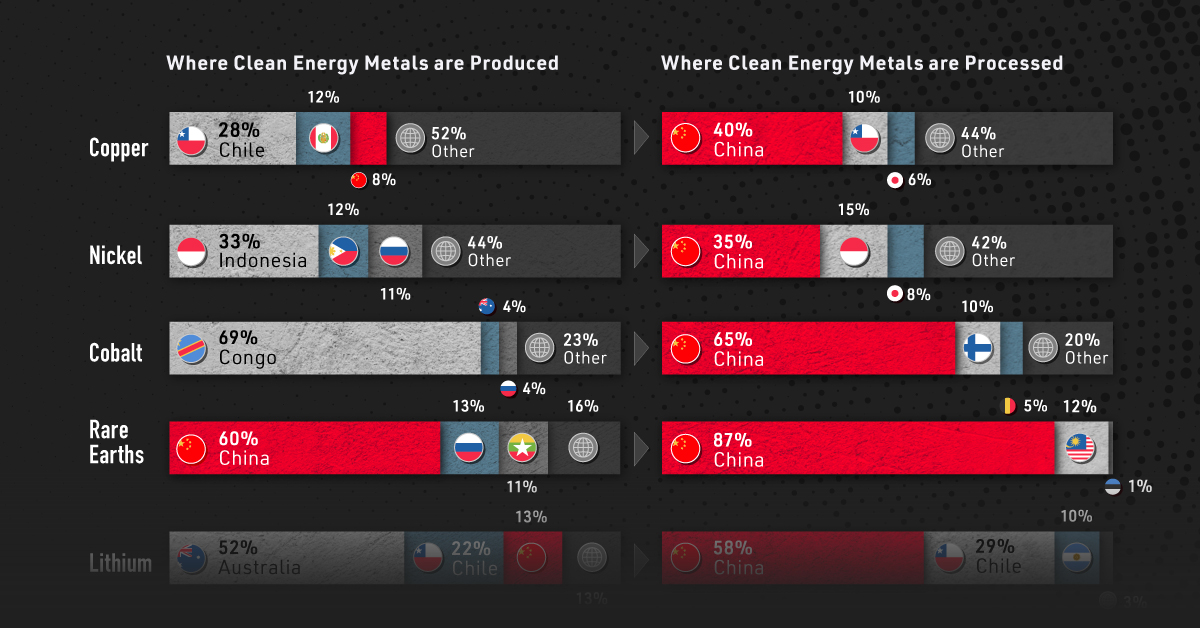
This visualization, based on data from the International Energy Agency (IEA), illustrates where the extraction and processing of key metals for the green revolution take place.
It shows that despite being the world’s biggest carbon polluter, China is also the largest producer of most of the world’s critical minerals for the green revolution.
Where Clean Energy Metals are Produced
China produces 60% of all rare earth elements used as components in high technology devices, including smartphones and computers.
The country also has a 13% share of the lithium production market, which is still dominated by Australia (52%) and Chile (22%). The highly reactive element is key to producing rechargeable batteries for mobile phones, laptops, and electric vehicles.
| China's Share | Extraction | Processing |
|---|---|---|
| Copper | 8% | 40% |
| Nickel | 5% | 35% |
| Cobalt | 1.5% | 65% |
| Rare Earths | 60% | 87% |
| Lithium | 13% | 58% |
But even more than extraction, China is the dominant economy when it comes to processing operations. The country’s share of refining is around 35% for nickel, 58% for lithium, 65% for cobalt, and 87% for rare earth elements.
Despite being the largest economy in the world, the U.S. does not appear among the largest producers of any of the metals listed. To shorten the gap, the Biden administration recently launched an executive order to review the American strategy for critical and strategic materials.
It’s also worth noting that Russia also does not appear among the top producers when it comes to clean energy metals, despite being one of the world’s leading producers of minerals like copper, iron, and palladium.
Low Regulation in the Clean Metal Supply Chain
While China leads all countries in terms of cobalt processing, the metal itself is primarily extracted in the Democratic Republic of Congo (DRC). Still, Chinese interests own 15 of the 17 industrial cobalt operations in the DRC, according to a data analysis by The New York Times and Benchmark Mineral Intelligence.
Unfortunately, the DRC’s cobalt production has been criticized due to reports of corruption and lack of regulation.
Part of the Congolese cobalt comes from artisanal mines with low regulation. Of the 255,000 Congolese artisanal miners, an estimated 40,000 are children, some as young as six years old.
The Rise of Clean Energy Metals
The necessary shift from fossil fuels to renewable energy opens up interesting questions about how geopolitics, and these supply chains, will be affected.
In the race to secure raw materials needed for the green revolution, new world powers could emerge as demand for clean energy metals grows.
For now, China has the lead.


Batteries
Visualized: The Rise of the LFP Battery
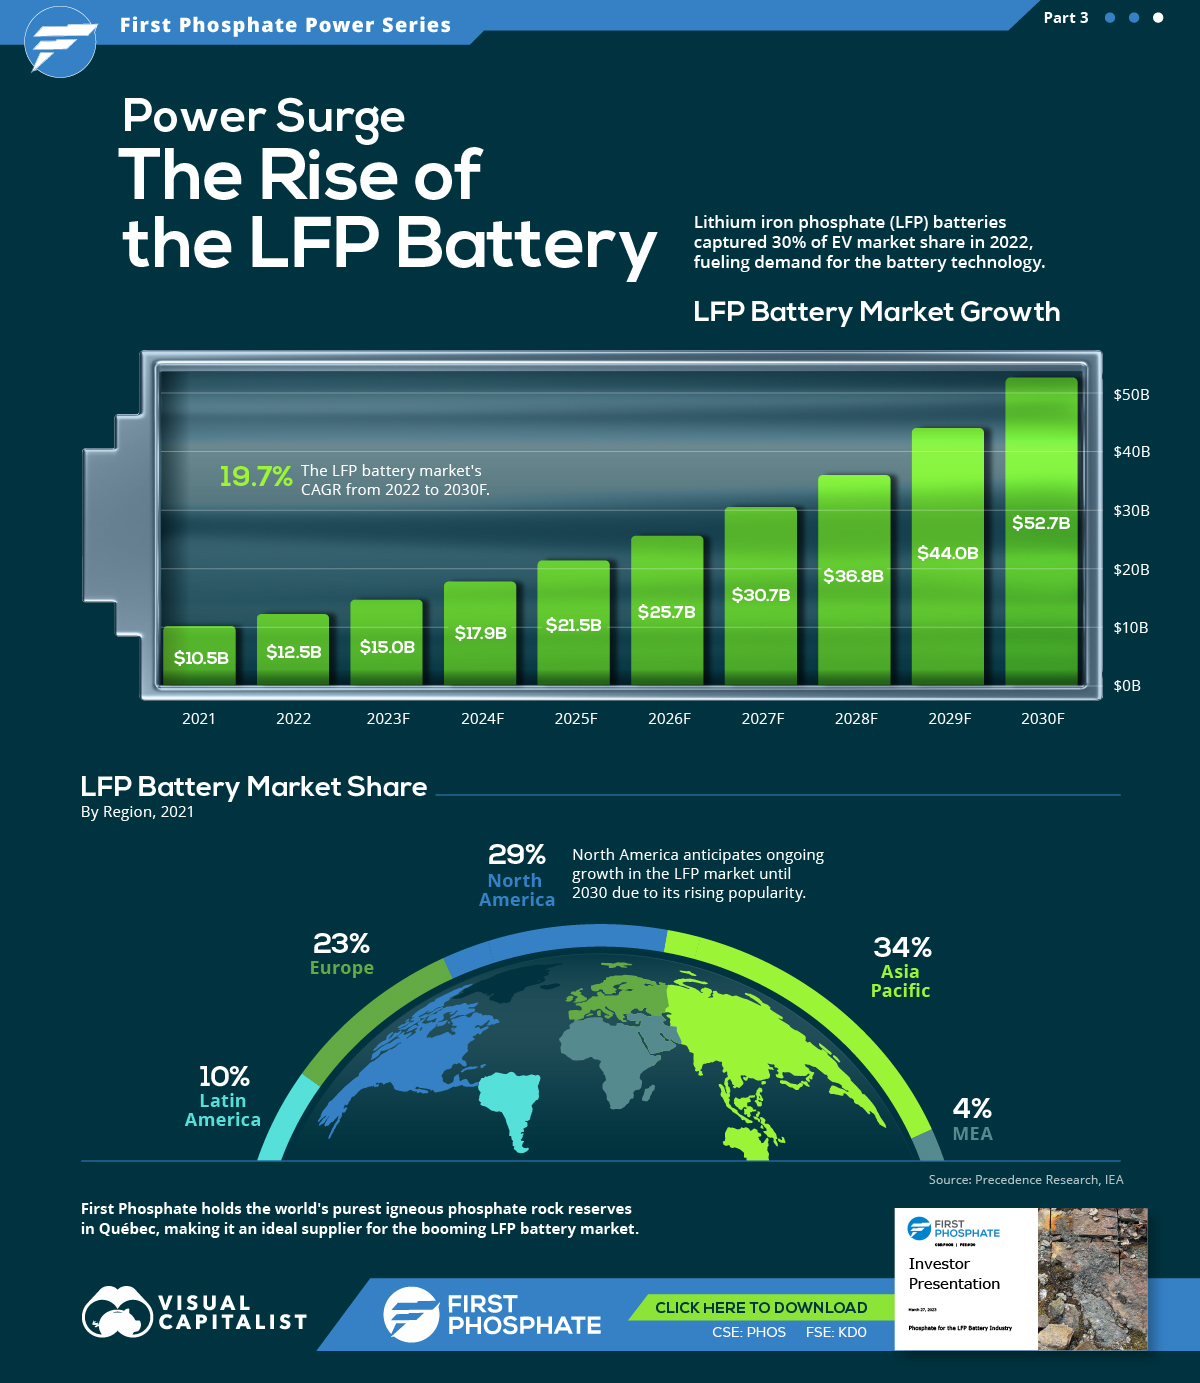
In 2022, the EV sector’s market share of the LFP battery rose from just 6% in 2020 to 30%, highlighting its growing popularity.


The Rise of the LFP Battery
Primarily a key component in fertilizers, phosphate is also essential to lithium iron phosphate (LFP) battery technology.
LFP is an emerging favorite in the expanding EV market, particularly in standard-range EVs. Factors driving this popularity include superior safety, longevity, cost-effectiveness, and environmental sustainability.
In this graphic, our sponsor First Phosphate looks at the growing LFP market, highlighting forecasted growth and current market share.
Market Growth
In 2022, the global LFP battery market stood at $12.5 billion. By 2030, this figure is expected to catapult to nearly $52.7 billion, signifying a CAGR of 19.7%.
| Year | USD (Billion) |
|---|---|
| 2021 | $10.5B |
| 2022 | $12.5B |
| 2023F | $15.0B |
| 2024F | $17.9B |
| 2025F | $21.5B |
| 2026F | $25.7B |
| 2027F | $30.7B |
| 2028F | $36.8B |
| 2029F | $44.0B |
| 2030F | $52.7B |
In 2022, LFP batteries cornered a sizable 30% of the EV market share from just 6% in 2020, demonstrating the growing appeal of this type of lithium-ion battery in the electric vehicle sector.
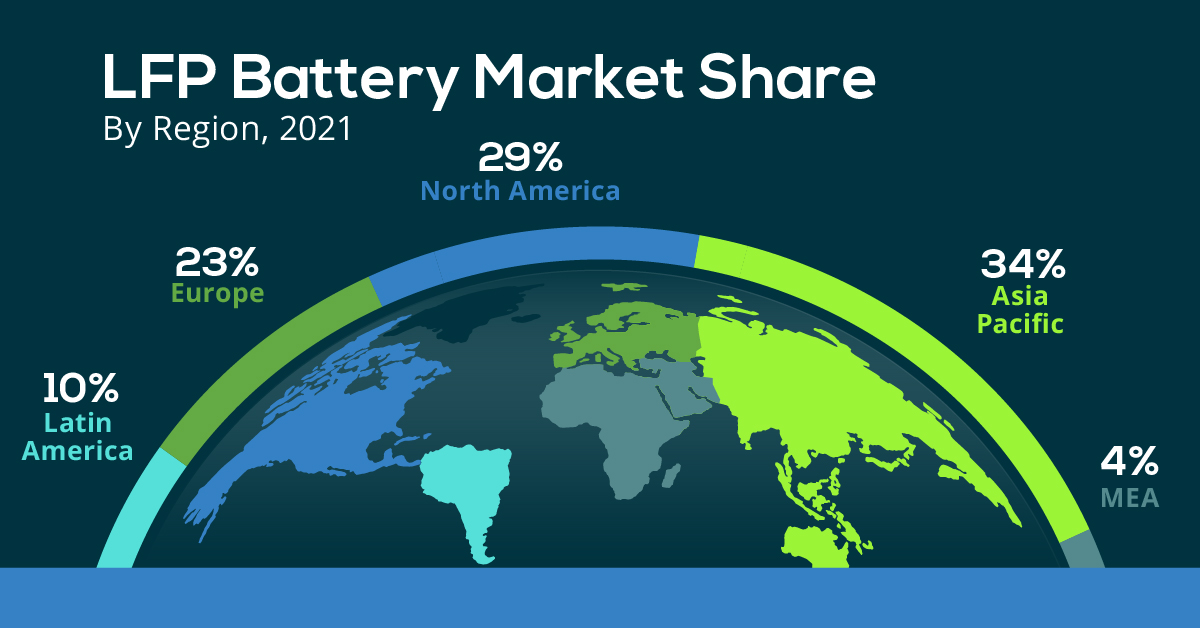
Market Share
The Asia Pacific region dominated the LFP battery market in 2021, accounting for over 34% of the global share.
| Regions | Revenue Share (%) |
|---|---|
| Asia Pacific | 34% |
| North America | 29% |
| Europe | 23% |
| Latin America | 10% |
| MEA | 4% |
Meanwhile, North America, with the second largest share, is projected to witness ongoing growth through 2030.
First Phosphate holds access to 1% of the world’s purest igneous rock phosphate reserves in Québec, making it an ideal supplier for the growing LFP market.

-

 Maps2 months ago
Mapped: Renewable Energy and Battery Installations in the U.S. in 2023
This graphic describes new U.S. renewable energy installations by state along with nameplate capacity, planned to come online in 2023.
-

 Batteries2 months ago
How EV Adoption Will Impact Oil Consumption (2015-2025P)
How much oil is saved by adding electric vehicles into the mix? We look at data from 2015 to 2025P for different types of EVs.
-
 Automotive3 months ago
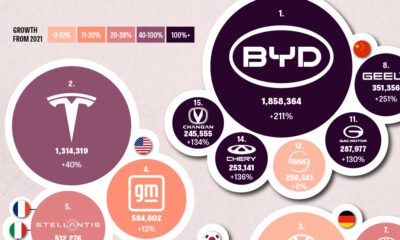
Global EV Production: BYD Surpasses Tesla
This graphic explores the latest EV production data for 2022, which shows BYD taking a massive step forward to surpass Tesla.
-

 Energy6 months ago
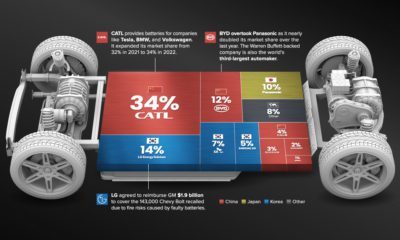
Visualizing China’s Dominance in Battery Manufacturing (2022-2027P)
This infographic breaks down battery manufacturing capacity by country in 2022 and 2027.
-

 Energy7 months ago
Visualizing 25 Years of Lithium Production, by Country
Lithium production has grown exponentially over the last few decades. Which countries produce the most lithium, and how how has this mix evolved?
-
 Energy10 months ago
The Top 10 EV Battery Manufacturers in 2022
Despite efforts from the U.S. and Europe to increase the domestic production of batteries, the market is still dominated by Asian suppliers.

-

 Finance3 weeks ago
Visualized: The 100 Largest U.S. Banks by Consolidated Assets
-

 Technology1 week ago
Charted: Changing Sentiments Towards AI in the Workplace
-

 Markets3 weeks ago
What are Top Investment Managers Holding in Their Portfolios?
-

 Markets1 week ago
The 50 Best One-Year Returns on the S&P 500 (1980-2022)
-

 Markets3 weeks ago
Chart: U.S. Home Price Growth Over 50 Years
-

 Crime1 week ago
Mapped: The Most Dangerous Cities in the U.S.
-

 Energy3 weeks ago
How Old Are the World’s Nuclear Reactors?
-

 Countries7 days ago
Mapped: World’s Top 40 Largest Military Budgets