Energy
Visualizing the World’s Largest Hydroelectric Dams
![]() Subscribe to the Elements free mailing list for more like this
Subscribe to the Elements free mailing list for more like this
Visualizing the World’s Largest Hydroelectric Dams
This was originally posted on Elements. Sign up to the free mailing list to get beautiful visualizations on natural resource megatrends in your email every week.
Did you know that hydroelectricity is the world’s biggest source of renewable energy? According to recent figures from the International Renewable Energy Agency (IRENA), it represents 40% of total capacity, ahead of solar (28%) and wind (27%).
This type of energy is generated by hydroelectric power stations, which are essentially large dams that use the water flow to spin a turbine. They can also serve secondary functions such as flow monitoring and flood control.
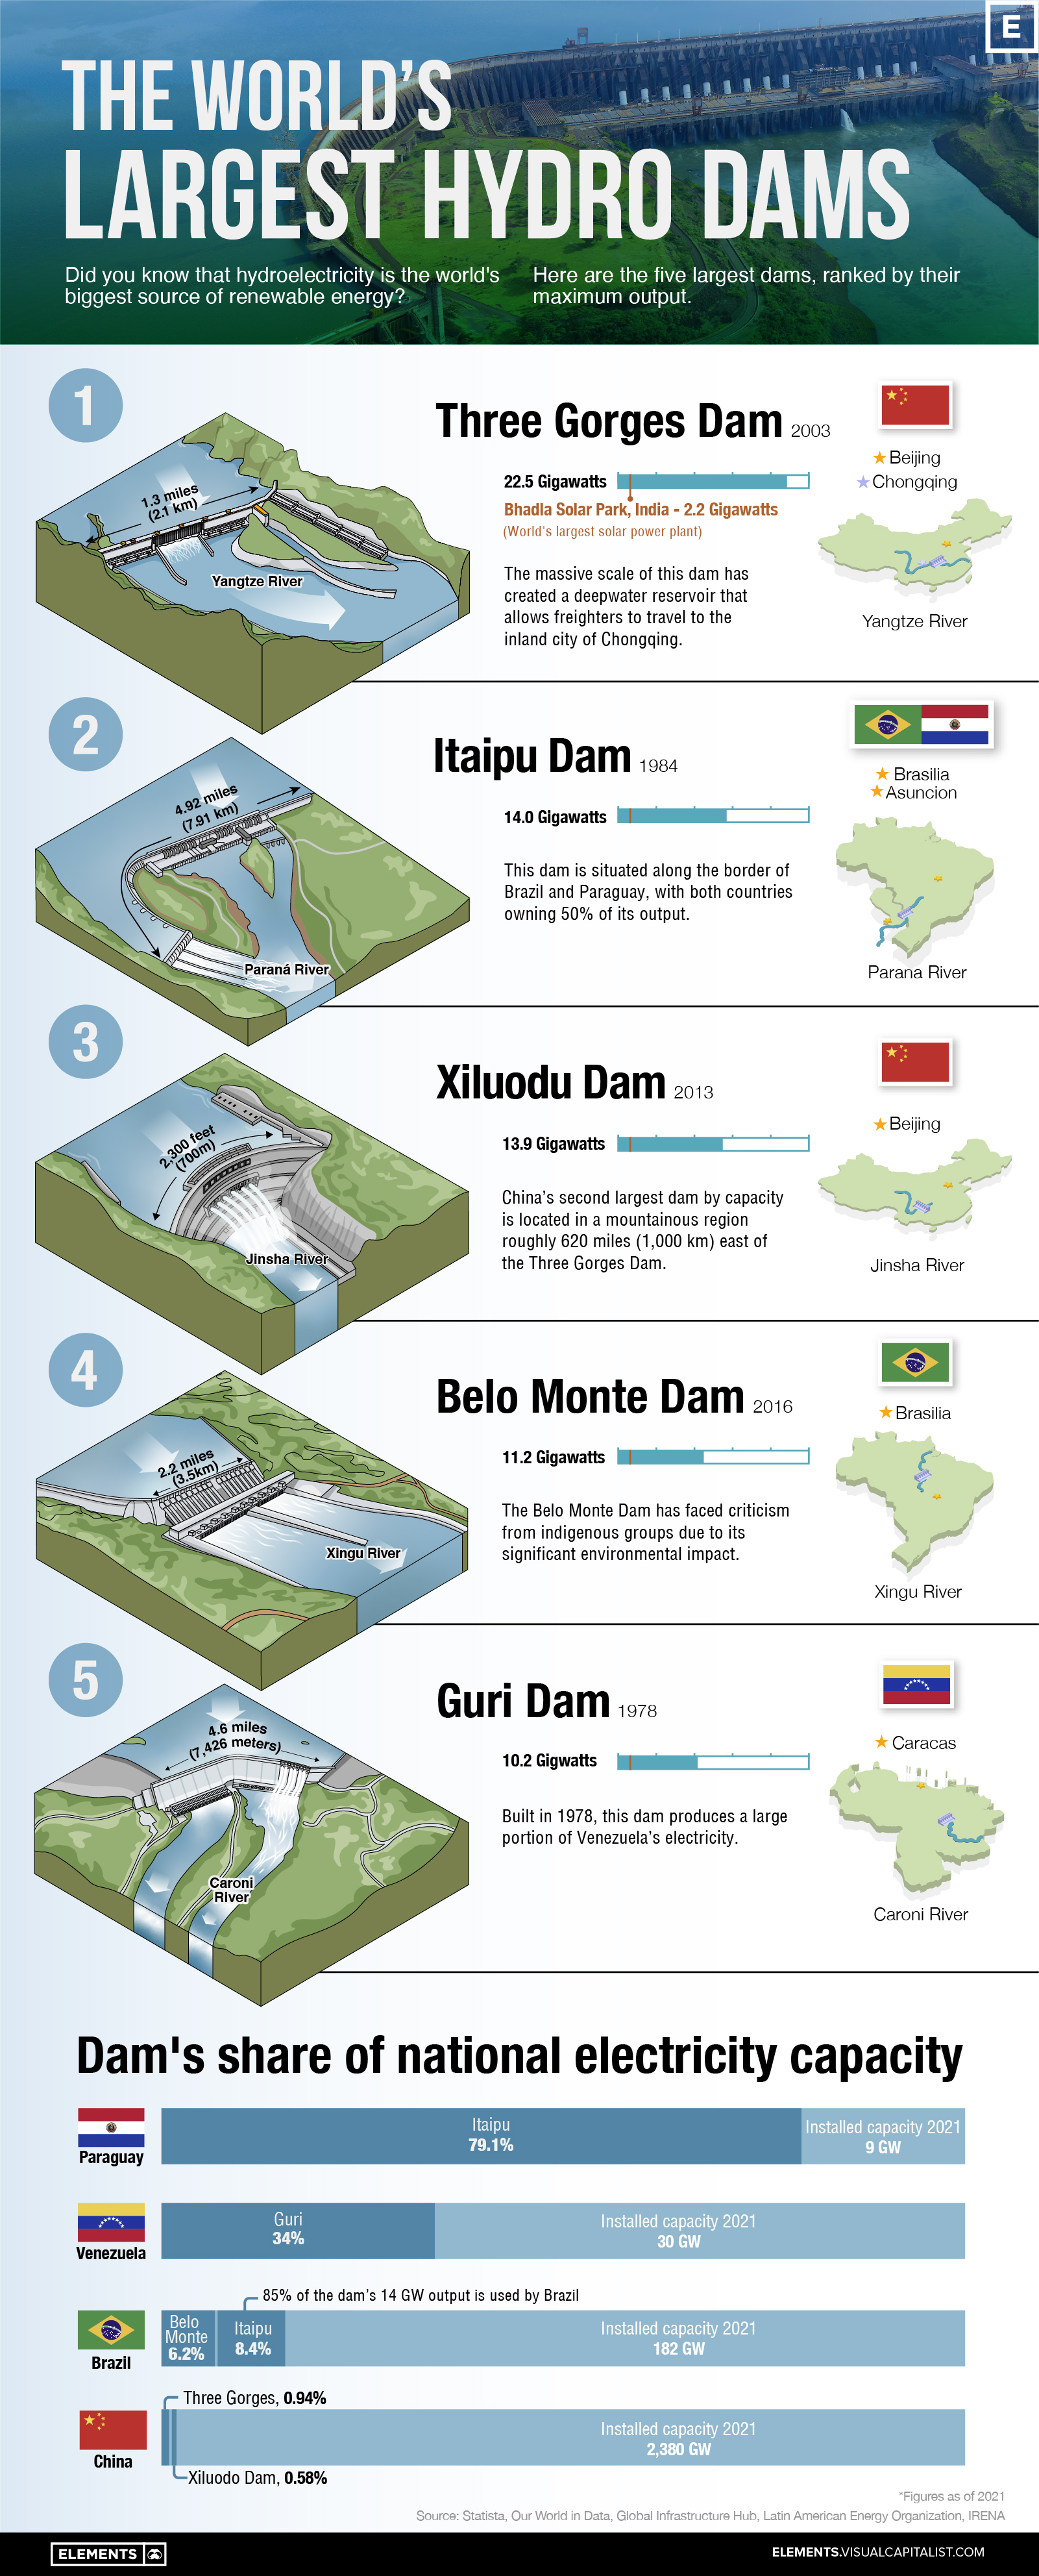
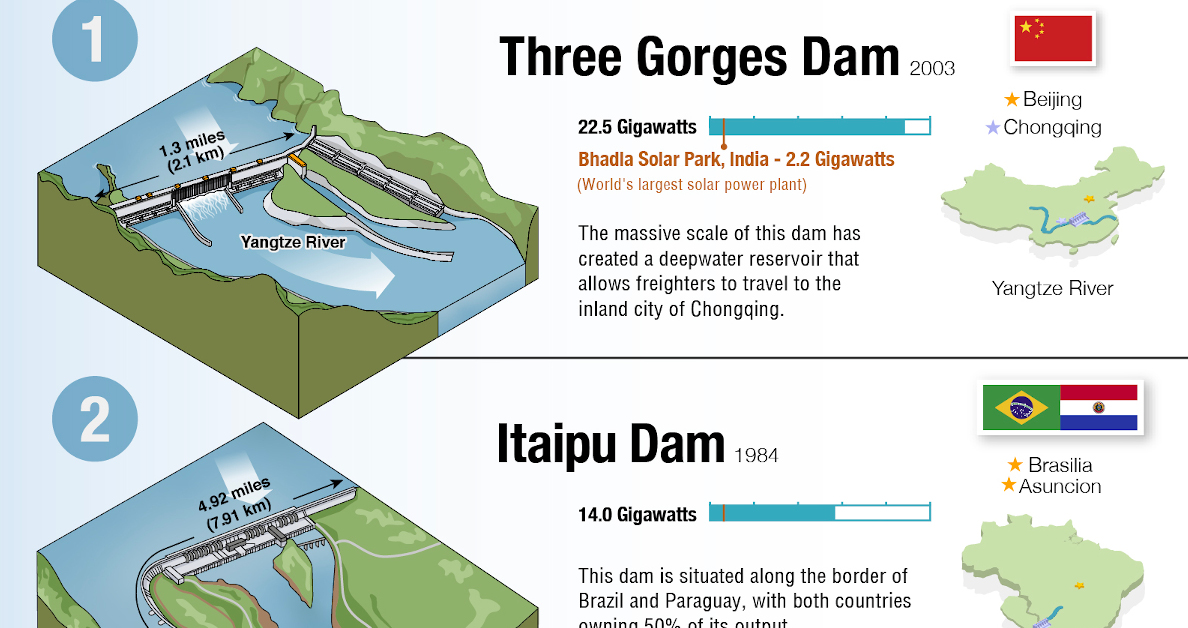
To help you learn more about hydropower, we’ve visualized the five largest hydroelectric dams in the world, ranked by their maximum output.
Overview of the Data
The following table lists key information about the five dams shown in this graphic, as of 2021. Installed capacity is the maximum amount of power that a plant can generate under full load.
| Country | Dam | River | Installed Capacity (gigawatts) | Dimensions (meters) |
|---|---|---|---|---|
| 🇨🇳 China | Three Gorges Dam | Yangtze River | 22.5 | 181 x 2,335 |
| 🇧🇷 Brazil / 🇵🇾 Paraguay | Itaipu Dam | Parana River | 14.0 | 196 x 7,919 |
| 🇨🇳 China | Xiluodu Dam | Jinsha River | 13.9 | 286 x 700 |
| 🇧🇷 Brazil | Belo Monte Dam | Xingu River | 11.2 | 90 X 3,545 |
| 🇻🇪 Venezuela | Guri Dam | Caroni River | 10.2 | 162 x 7,426 |
At the top of the list is China’s Three Gorges Dam, which opened in 2003. It has an installed capacity of 22.5 gigawatts (GW), which is close to double the second-place Itaipu Dam.
In terms of annual output, the Itaipu Dam actually produces about the same amount of electricity. This is because the Parana River has a low seasonal variance, meaning the flow rate changes very little throughout the year. On the other hand, the Yangtze River has a significant drop in flow for several months of the year.
For a point of comparison, here is the installed capacity of the world’s three largest solar power plants, also as of 2021:
- Bhadla Solar Park, India: 2.2 GW
- Hainan Solar Park, China: 2.2 GW
- Pavagada Solar Park, India: 2.1 GW
Compared to our largest dams, solar plants have a much lower installed capacity. However, in terms of cost (cents per kilowatt-hour), the two are actually quite even.
Closer Look: Three Gorges Dam
The Three Gorges Dam is an engineering marvel, costing over $32 billion to construct. To wrap your head around its massive scale, consider the following facts:
- The Three Gorges Reservoir (which feeds the dam) contains 39 trillion kg of water (42 billion tons)
- In terms of area, the reservoir spans 400 square miles (1,045 square km)
- The mass of this reservoir is large enough to slow the Earth’s rotation by 0.06 microseconds
Of course, any man-made structure this large is bound to have a profound impact on the environment. In a 2010 study, it was found that the dam has triggered over 3,000 earthquakes and landslides since 2003.
The Consequences of Hydroelectric Dams
While hydropower can be cost-effective, there are some legitimate concerns about its long-term sustainability.
For starters, hydroelectric dams require large upstream reservoirs to ensure a consistent supply of water. Flooding new areas of land can disrupt wildlife, degrade water quality, and even cause natural disasters like earthquakes.
Dams can also disrupt the natural flow of rivers. Other studies have found that millions of people living downstream from large dams suffer from food insecurity and flooding.
Whereas the benefits have generally been delivered to urban centers or industrial-scale agricultural developments, river-dependent populations located downstream of dams have experienced a difficult upheaval of their livelihoods.
– Richter, B.D. et al. (2010)
Perhaps the greatest risk to hydropower is climate change itself. For example, due to the rising frequency of droughts, hydroelectric dams in places like California are becoming significantly less economical.


Batteries
Visualized: The Rise of the LFP Battery
In 2022, the EV sector’s market share of the LFP battery rose from just 6% in 2020 to 30%, highlighting its growing popularity.


The Rise of the LFP Battery
Primarily a key component in fertilizers, phosphate is also essential to lithium iron phosphate (LFP) battery technology.
LFP is an emerging favorite in the expanding EV market, particularly in standard-range EVs. Factors driving this popularity include superior safety, longevity, cost-effectiveness, and environmental sustainability.
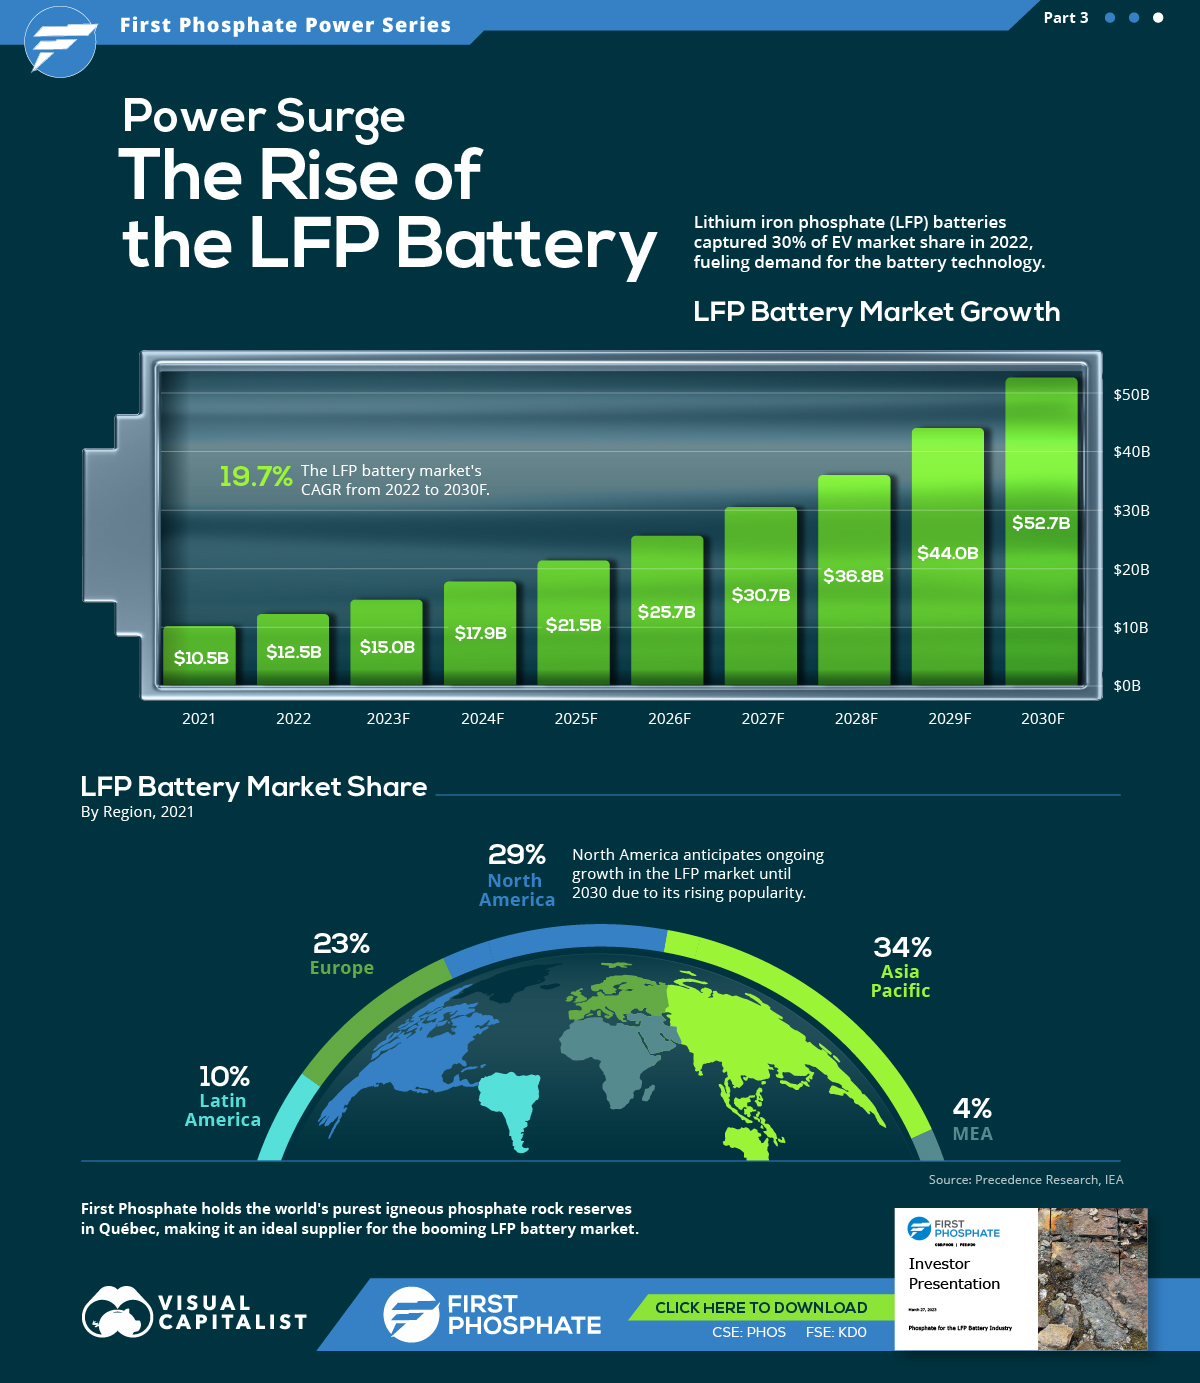
In this graphic, our sponsor First Phosphate looks at the growing LFP market, highlighting forecasted growth and current market share.
Market Growth
In 2022, the global LFP battery market stood at $12.5 billion. By 2030, this figure is expected to catapult to nearly $52.7 billion, signifying a CAGR of 19.7%.
| Year | USD (Billion) |
|---|---|
| 2021 | $10.5B |
| 2022 | $12.5B |
| 2023F | $15.0B |
| 2024F | $17.9B |
| 2025F | $21.5B |
| 2026F | $25.7B |
| 2027F | $30.7B |
| 2028F | $36.8B |
| 2029F | $44.0B |
| 2030F | $52.7B |
In 2022, LFP batteries cornered a sizable 30% of the EV market share from just 6% in 2020, demonstrating the growing appeal of this type of lithium-ion battery in the electric vehicle sector.
Market Share
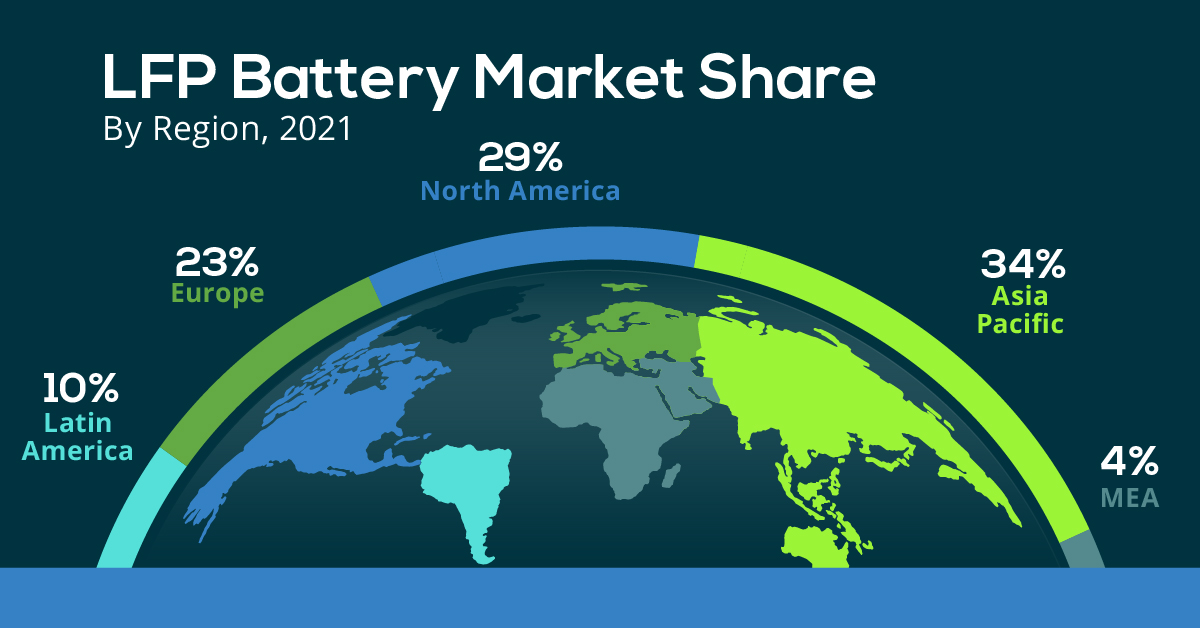
The Asia Pacific region dominated the LFP battery market in 2021, accounting for over 34% of the global share.
| Regions | Revenue Share (%) |
|---|---|
| Asia Pacific | 34% |
| North America | 29% |
| Europe | 23% |
| Latin America | 10% |
| MEA | 4% |
Meanwhile, North America, with the second largest share, is projected to witness ongoing growth through 2030.
First Phosphate holds access to 1% of the world’s purest igneous rock phosphate reserves in Québec, making it an ideal supplier for the growing LFP market.

-

 Maps2 months ago
Mapped: Renewable Energy and Battery Installations in the U.S. in 2023
This graphic describes new U.S. renewable energy installations by state along with nameplate capacity, planned to come online in 2023.
-

 Energy2 months ago
How EV Adoption Will Impact Oil Consumption (2015-2025P)
How much oil is saved by adding electric vehicles into the mix? We look at data from 2015 to 2025P for different types of EVs.
-
 Automotive3 months ago
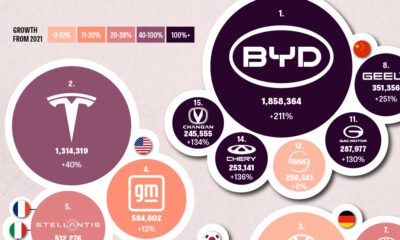
Global EV Production: BYD Surpasses Tesla
This graphic explores the latest EV production data for 2022, which shows BYD taking a massive step forward to surpass Tesla.
-

 Energy6 months ago
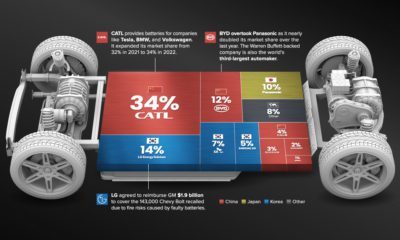
Visualizing China’s Dominance in Battery Manufacturing (2022-2027P)
This infographic breaks down battery manufacturing capacity by country in 2022 and 2027.
-

 Batteries7 months ago
Visualizing 25 Years of Lithium Production, by Country
Lithium production has grown exponentially over the last few decades. Which countries produce the most lithium, and how how has this mix evolved?
-
 Energy10 months ago
The Top 10 EV Battery Manufacturers in 2022
Despite efforts from the U.S. and Europe to increase the domestic production of batteries, the market is still dominated by Asian suppliers.

-

 Energy3 weeks ago
How Old Are the World’s Nuclear Reactors?
-

 Maps7 days ago
Mapped: World’s Top 40 Largest Military Budgets
-

 Energy3 weeks ago
How Big is the Market for Crude Oil?
-

 Cities7 days ago
Mapped: The Safest Cities in the U.S.
-

 Markets2 weeks ago
Ranked: The Most Profitable U.S. Companies, by Sector
-

 apps5 days ago
How Long it Took for Popular Apps to Reach 100 Million Users
-

 Markets4 weeks ago
The World’s Biggest Mutual Fund and ETF Providers
-

 Brands2 weeks ago
Brand Reputations: Ranking the Best and Worst in 2023