Energy
A Visual Crash Course on Geothermal Energy
![]() Subscribe to the Elements free mailing list for more like this
Subscribe to the Elements free mailing list for more like this


A Visual Crash Course on Geothermal Energy
This was originally posted on Elements. Sign up to the free mailing list to get beautiful visualizations on natural resource megatrends in your email every week.
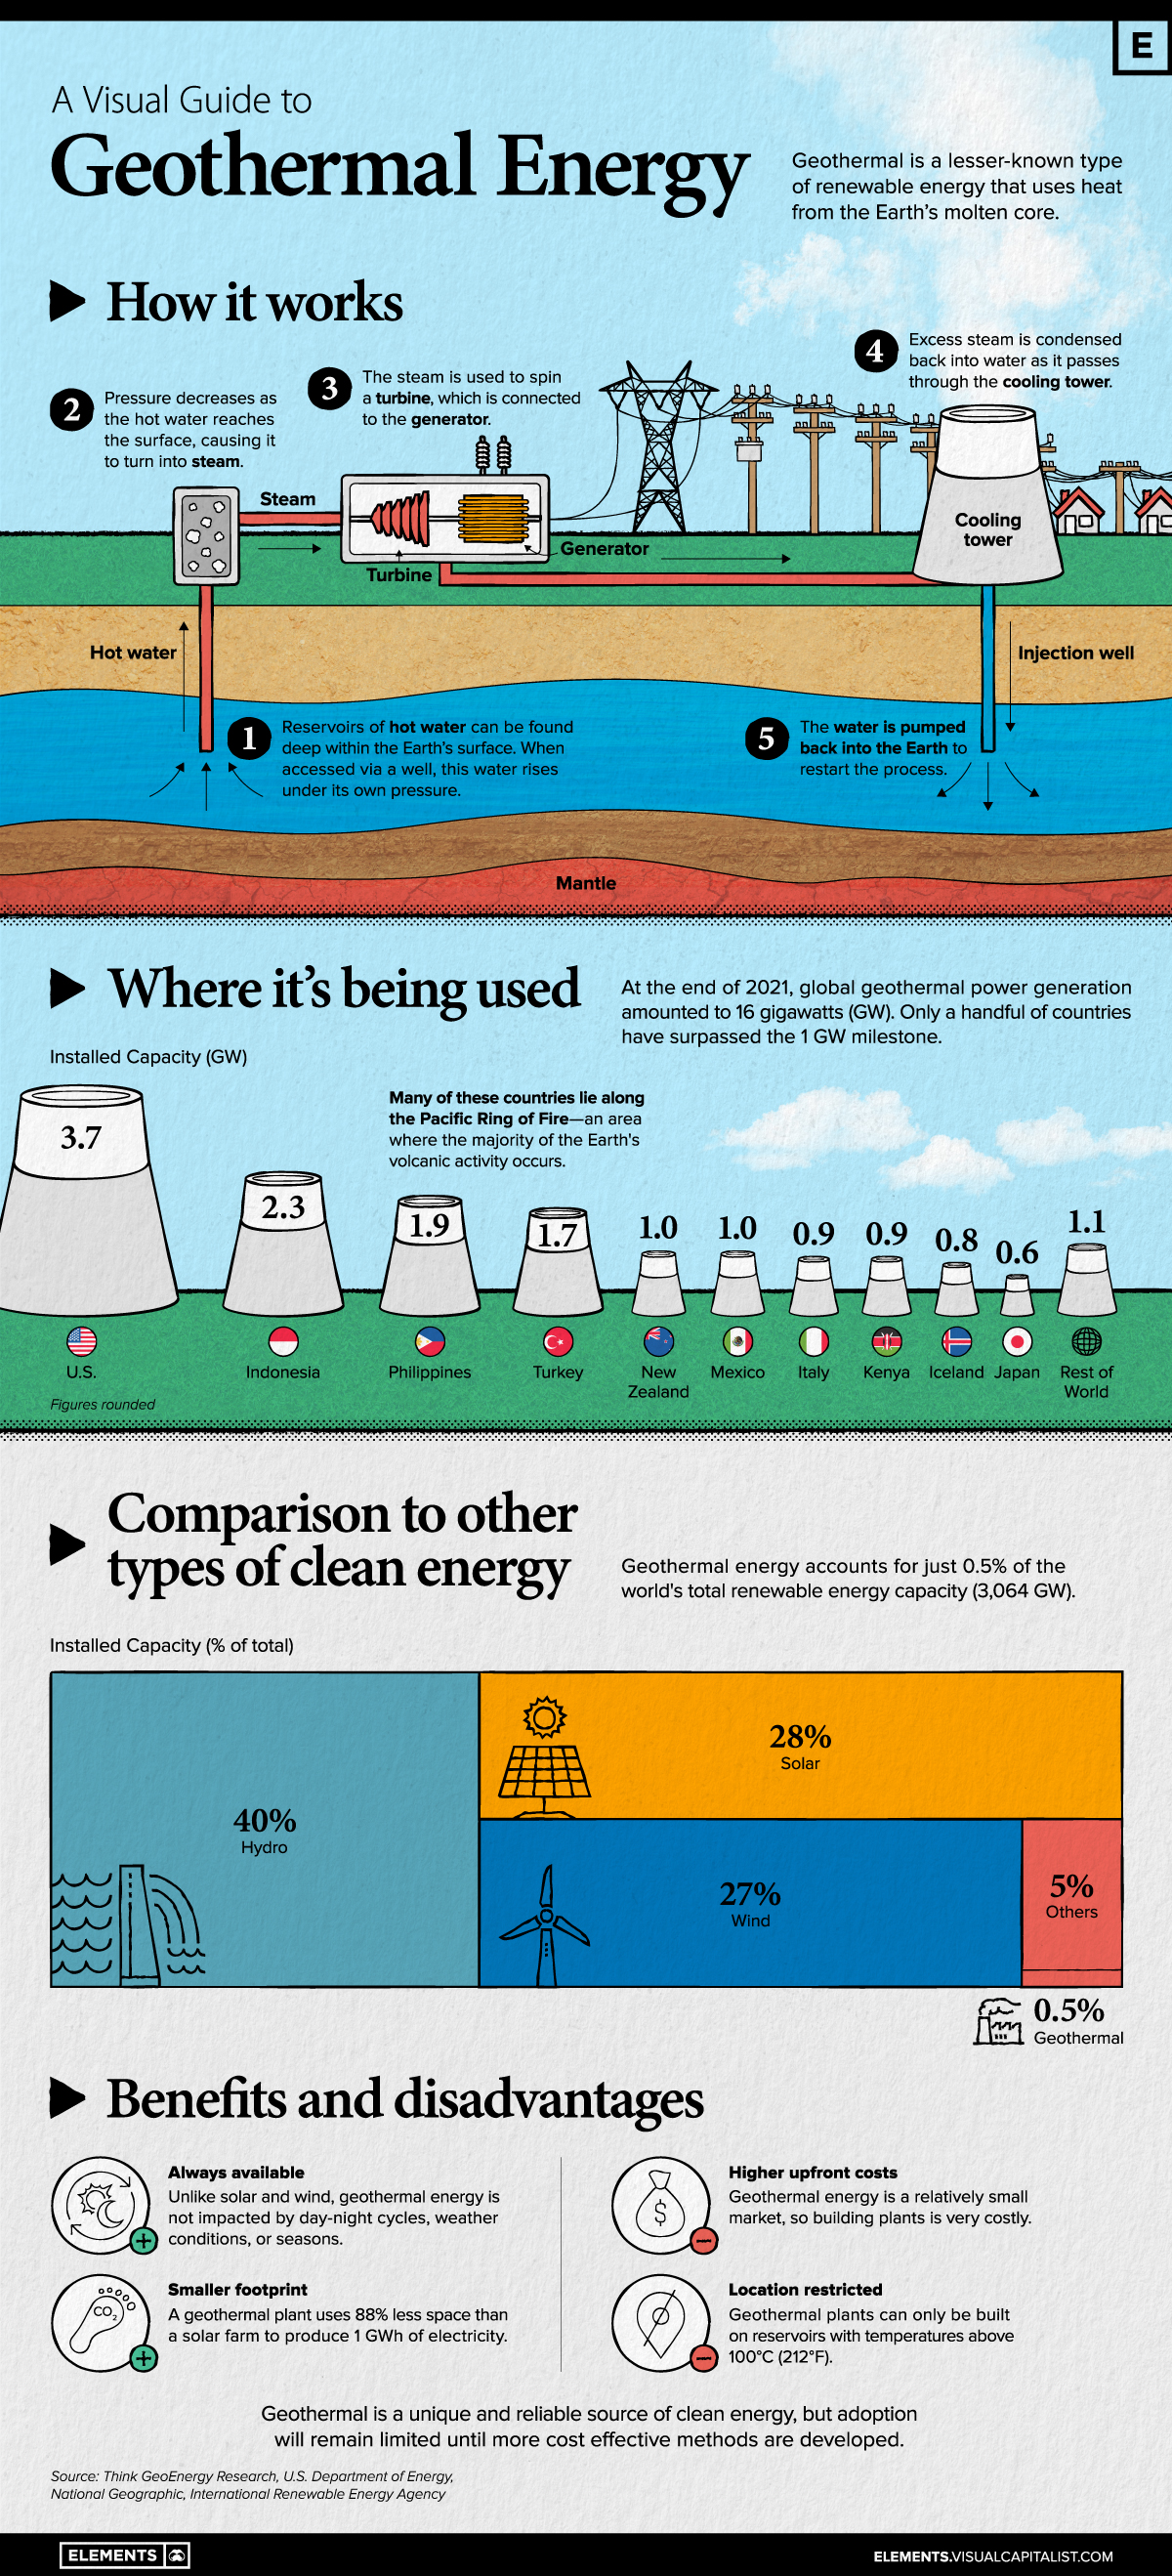
Geothermal is a lesser-known type of renewable energy that uses heat from the Earth’s molten core to produce electricity.
While this unique feature gives it key benefits over solar and wind, it also suffers from high costs and geographic restrictions. Because of this, few countries have managed to produce geothermal energy at scale.
In this infographic, we’ve used a combination of diagrams and charts to give you a high level overview of this sustainable energy source.
How Geothermal Works
Geothermal energy is produced by accessing reservoirs of hot water that are found several miles below the earth’s surface. In certain parts of the planet, this water naturally breaks through the surface, creating what’s known as a hot spring (or in some cases, a geyser).
When accessed via a well, this pressurized water rises up and rapidly expands into steam. That steam is used to spin a turbine, which then drives an electric generator.
Further along the process, excess steam is condensed back into water as it passes through a cooling tower. An injection well pumps this water back into the Earth to ensure sustainability.
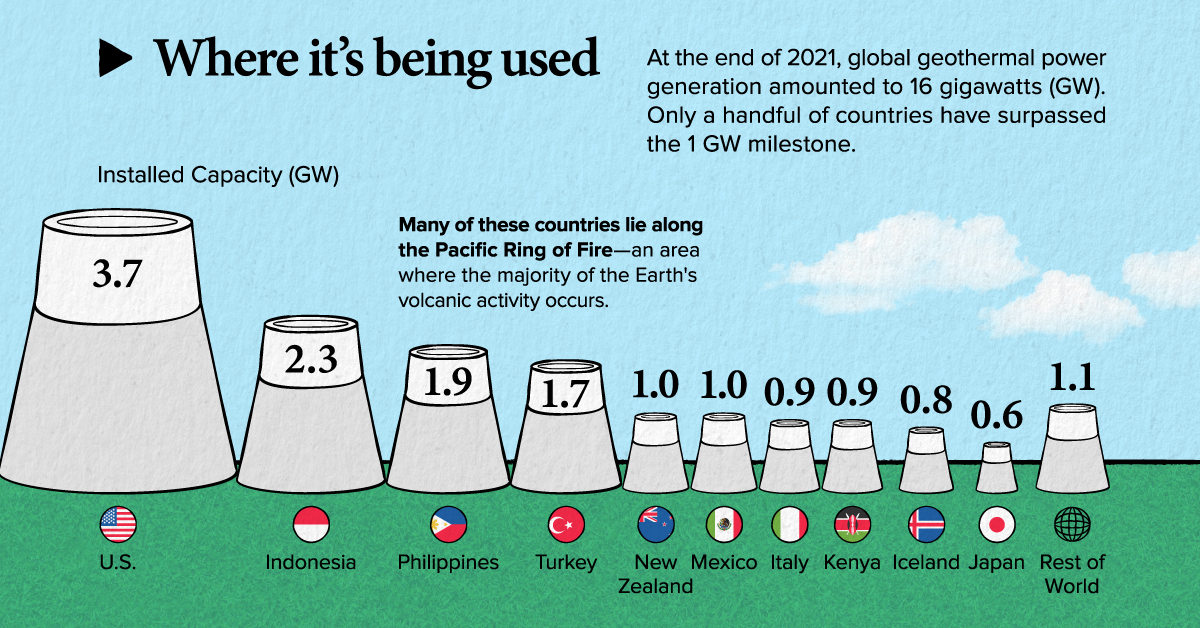
Where Is Geothermal Energy Being Used?
As of 2021, global geothermal power generation amounted to 16 gigawatts (GW). Only a handful of countries have surpassed the 1GW milestone.
| Country | Installed Capacity (GW) |
|---|---|
| 🇺🇸 U.S. | 3.7 |
| 🇮🇩 Indonesia | 2.3 |
| 🇵🇭 Philippines | 1.9 |
| 🇹🇷 Turkey | 1.7 |
| 🇳🇿 New Zealand | 1 |
| 🇲🇽 Mexico | 1 |
| 🇮🇹 Italy | 0.9 |
| 🇰🇪 Kenya | 0.9 |
| 🇮🇸 Iceland | 0.8 |
| 🇯🇵 Japan | 0.6 |
| 🌎 Rest of World | 1.1 |
To give these numbers context, consider the following datapoints:
- America’s 3.7 GW capacity is split across 61 geothermal plants.
- The world’s largest solar plant, the Bhadla Solar Park, has a maximum output of 2.2 GW
- The world’s largest hydroelectric plant, the Three Gorges Dam, can produce up to 22.5 GW
While geothermal plants clearly produce less power, they do have benefits over other types of renewables. For example, geothermal energy is not impacted by day-night cycles, weather conditions, or seasons.
The Big Picture
We now look at a second dataset, which shows the global contribution of each type of renewable energy. These figures are as of April 2022, and were sourced from the International Renewable Energy Agency (IRENA).
| Type | Installed Capacity (% of total) | Installed Capacity (GW) |
|---|---|---|
| Hydro | 40% | 1226 |
| Solar | 28% | 858 |
| Wind | 27% | 827 |
| Others (Geothermal) | 5% (0.5%) | 153 (15*) |
| Total | 100% | 3064 |
*Geothermal’s total capacity in this dataset differs from the previous value of 16GW. This is due to differing sources and rounding.
One reason for the slow adoption of geothermal energy is that they can only be built in regions that have suitable geological features (such as places where there is volcanic activity).
To expand on that point, consider the following data from Fitch Solutions, which shows the forecasted growth of geothermal energy capacity by region.
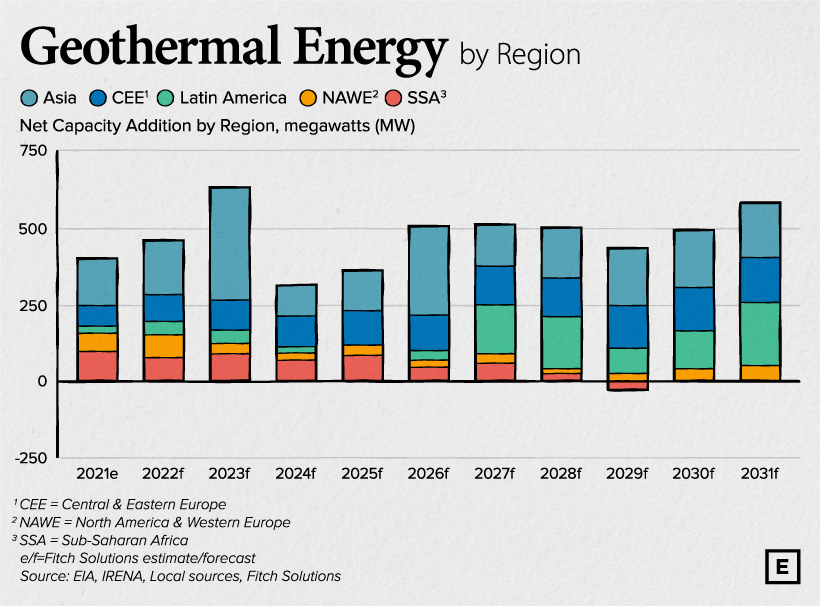
Fitch believes that over the next decade, the majority of new geothermal capacity will be installed in Asia. On the flipside, investment in North America and Western Europe (NAWE) is expected to decrease.
Over the coming years, NAWE will experience a gradual slowdown in geothermal capacity additions as we expect that investments will be crowded out by cheaper wind and solar projects.
– Fitch Solutions
The top markets for geothermal are expected to be Indonesia, the Philippines, and New Zealand, which all lie along the Pacific Ring of Fire. The Ring of Fire is a path along the Pacific Ocean where the majority of volcanic activity occurs.


Batteries
Visualized: The Rise of the LFP Battery
In 2022, the EV sector’s market share of the LFP battery rose from just 6% in 2020 to 30%, highlighting its growing popularity.


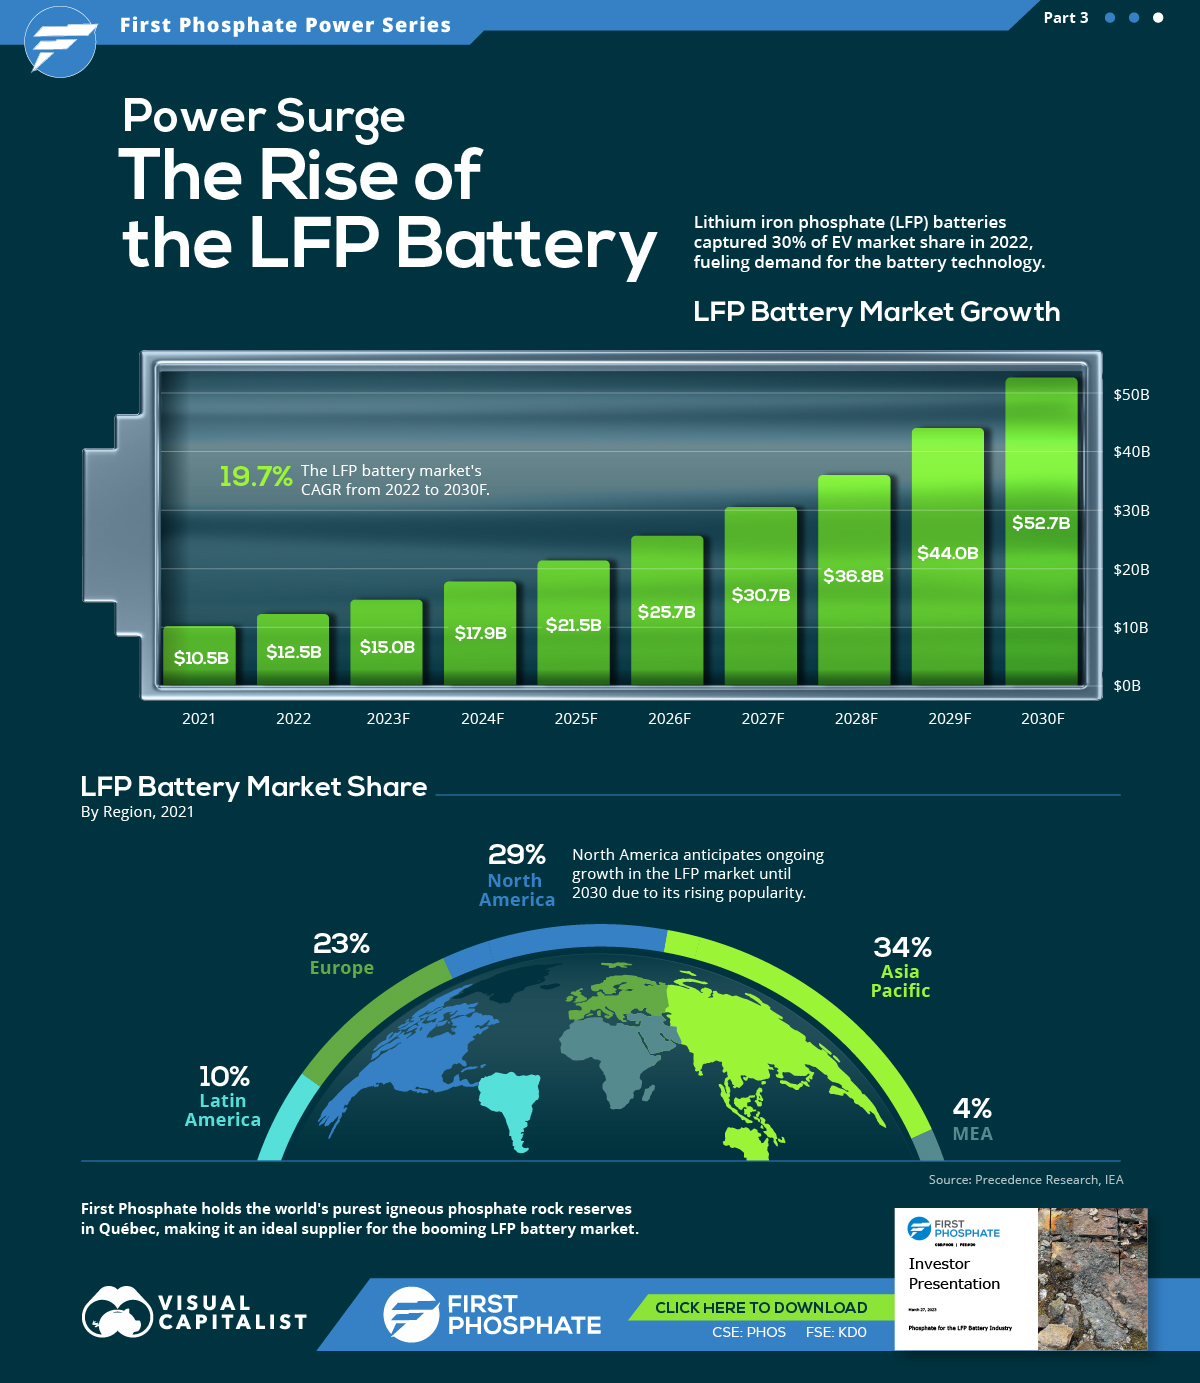
The Rise of the LFP Battery
Primarily a key component in fertilizers, phosphate is also essential to lithium iron phosphate (LFP) battery technology.
LFP is an emerging favorite in the expanding EV market, particularly in standard-range EVs. Factors driving this popularity include superior safety, longevity, cost-effectiveness, and environmental sustainability.
In this graphic, our sponsor First Phosphate looks at the growing LFP market, highlighting forecasted growth and current market share.
Market Growth
In 2022, the global LFP battery market stood at $12.5 billion. By 2030, this figure is expected to catapult to nearly $52.7 billion, signifying a CAGR of 19.7%.
| Year | USD (Billion) |
|---|---|
| 2021 | $10.5B |
| 2022 | $12.5B |
| 2023F | $15.0B |
| 2024F | $17.9B |
| 2025F | $21.5B |
| 2026F | $25.7B |
| 2027F | $30.7B |
| 2028F | $36.8B |
| 2029F | $44.0B |
| 2030F | $52.7B |
In 2022, LFP batteries cornered a sizable 30% of the EV market share from just 6% in 2020, demonstrating the growing appeal of this type of lithium-ion battery in the electric vehicle sector.
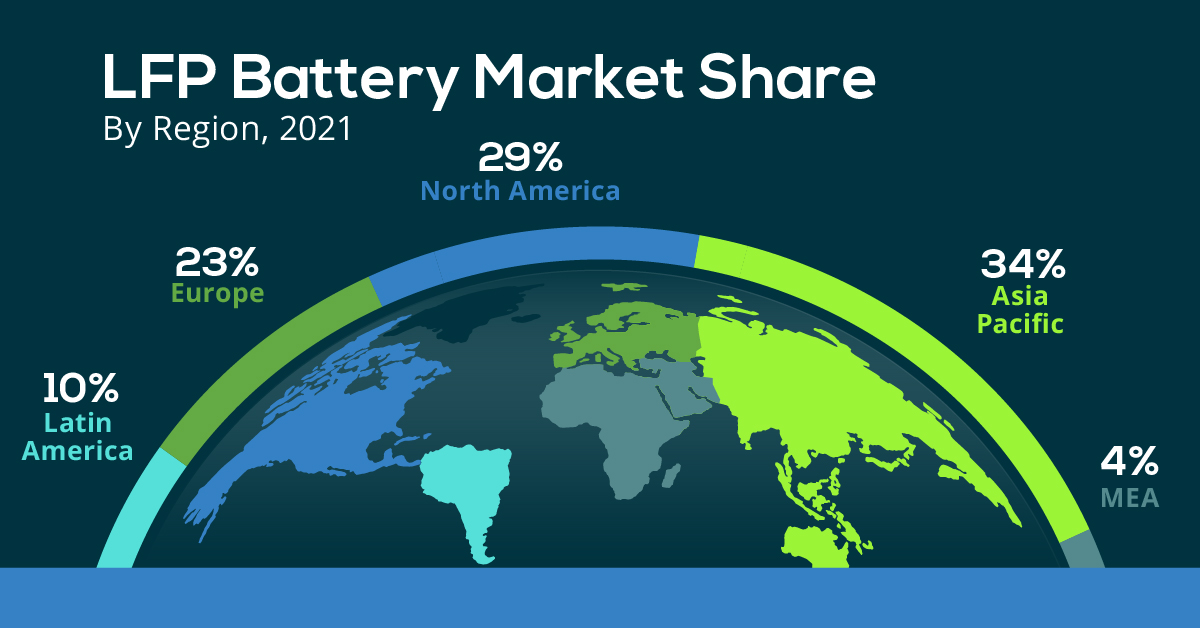
Market Share
The Asia Pacific region dominated the LFP battery market in 2021, accounting for over 34% of the global share.
| Regions | Revenue Share (%) |
|---|---|
| Asia Pacific | 34% |
| North America | 29% |
| Europe | 23% |
| Latin America | 10% |
| MEA | 4% |
Meanwhile, North America, with the second largest share, is projected to witness ongoing growth through 2030.
First Phosphate holds access to 1% of the world’s purest igneous rock phosphate reserves in Québec, making it an ideal supplier for the growing LFP market.

-

 Energy2 months ago
Mapped: Renewable Energy and Battery Installations in the U.S. in 2023
This graphic describes new U.S. renewable energy installations by state along with nameplate capacity, planned to come online in 2023.
-

 Energy2 months ago
How EV Adoption Will Impact Oil Consumption (2015-2025P)
How much oil is saved by adding electric vehicles into the mix? We look at data from 2015 to 2025P for different types of EVs.
-
 Energy3 months ago
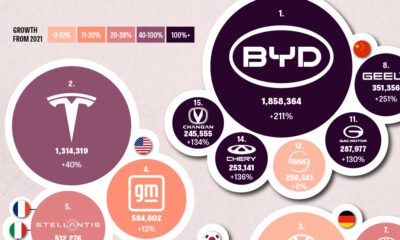
Global EV Production: BYD Surpasses Tesla
This graphic explores the latest EV production data for 2022, which shows BYD taking a massive step forward to surpass Tesla.
-

 Batteries6 months ago
Visualizing China’s Dominance in Battery Manufacturing (2022-2027P)
This infographic breaks down battery manufacturing capacity by country in 2022 and 2027.
-

 Energy7 months ago
Visualizing 25 Years of Lithium Production, by Country
Lithium production has grown exponentially over the last few decades. Which countries produce the most lithium, and how how has this mix evolved?
-
 Energy10 months ago
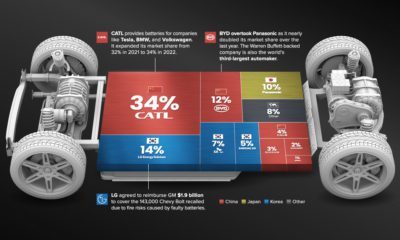
The Top 10 EV Battery Manufacturers in 2022
Despite efforts from the U.S. and Europe to increase the domestic production of batteries, the market is still dominated by Asian suppliers.

-

 Markets2 weeks ago
Ranked: The Most Profitable U.S. Companies, by Sector
-

 apps5 days ago
How Long it Took for Popular Apps to Reach 100 Million Users
-

 Markets4 weeks ago
The World’s Biggest Mutual Fund and ETF Providers
-

 Markets2 weeks ago
Brand Reputations: Ranking the Best and Worst in 2023
-

 Environment5 days ago
Hotter Than Ever: 2023 Sets New Global Temperature Records
-

 Datastream4 weeks ago
Can You Calculate Your Daily Carbon Footprint?
-

 Energy2 weeks ago
Who’s Still Buying Russian Fossil Fuels in 2023?
-

 VC+5 days ago
What’s New on VC+ in July