

Explore the age distribution of the 422 nuclear reactors operating globally in this infographic.
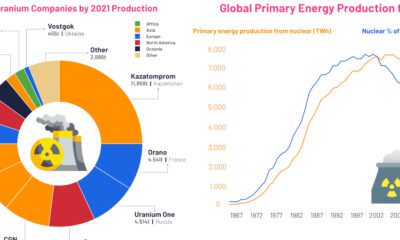

These visuals highlight the uranium mining industry and its output, as well as the trajectory of nuclear energy from 1960 to today.
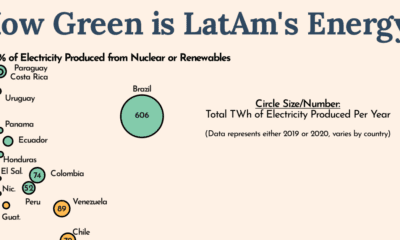

Countries around the world are looking to decarbonize, but Latin America is leading the charge in green energy usage.
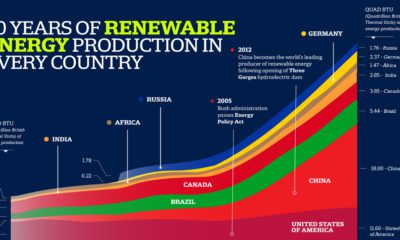

Here's a snapshot of global energy production, and which countries have produced the most fossil fuels, nuclear, and renewable energy since 1980.
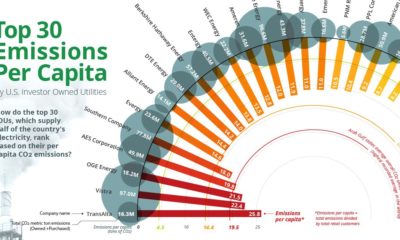

Roughly 25% of all GHG emissions come from electricity production. See how the top 30 IOUs rank by emissions per capita.
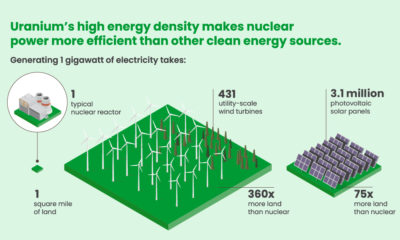

Nuclear power is among the world's cleanest sources of energy, but how did uranium and nuclear power come to be?
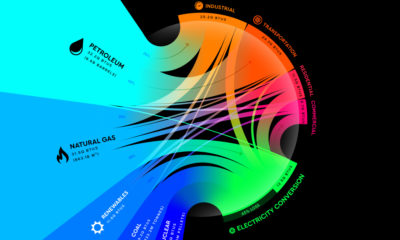

From renewables to fossil fuels, we've visualized the diverse mix of energy sources that powered U.S. energy consumption in 2020.
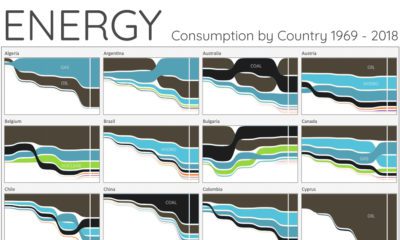

For the last 50 years, fossil fuels have dominated energy consumption. This chart looks at how the energy mix is changing in over 60+ countries.
Which countries are turning to nuclear energy, and which are turning away? Mapping and breaking down the world’s nuclear reactor landscape.
Visualizing the Changing Landscape in Nuclear Power There’s been talk about a coming potential uranium bull market for awhile now, but here is a different look...


 Creator Program