Energy
Ranked: Nuclear Power Production, by Country
![]() Subscribe to the Elements free mailing list for more like this
Subscribe to the Elements free mailing list for more like this
Nuclear Power Production by Country
This was originally posted on Elements. Sign up to the free mailing list to get beautiful visualizations on natural resource megatrends in your email every week.
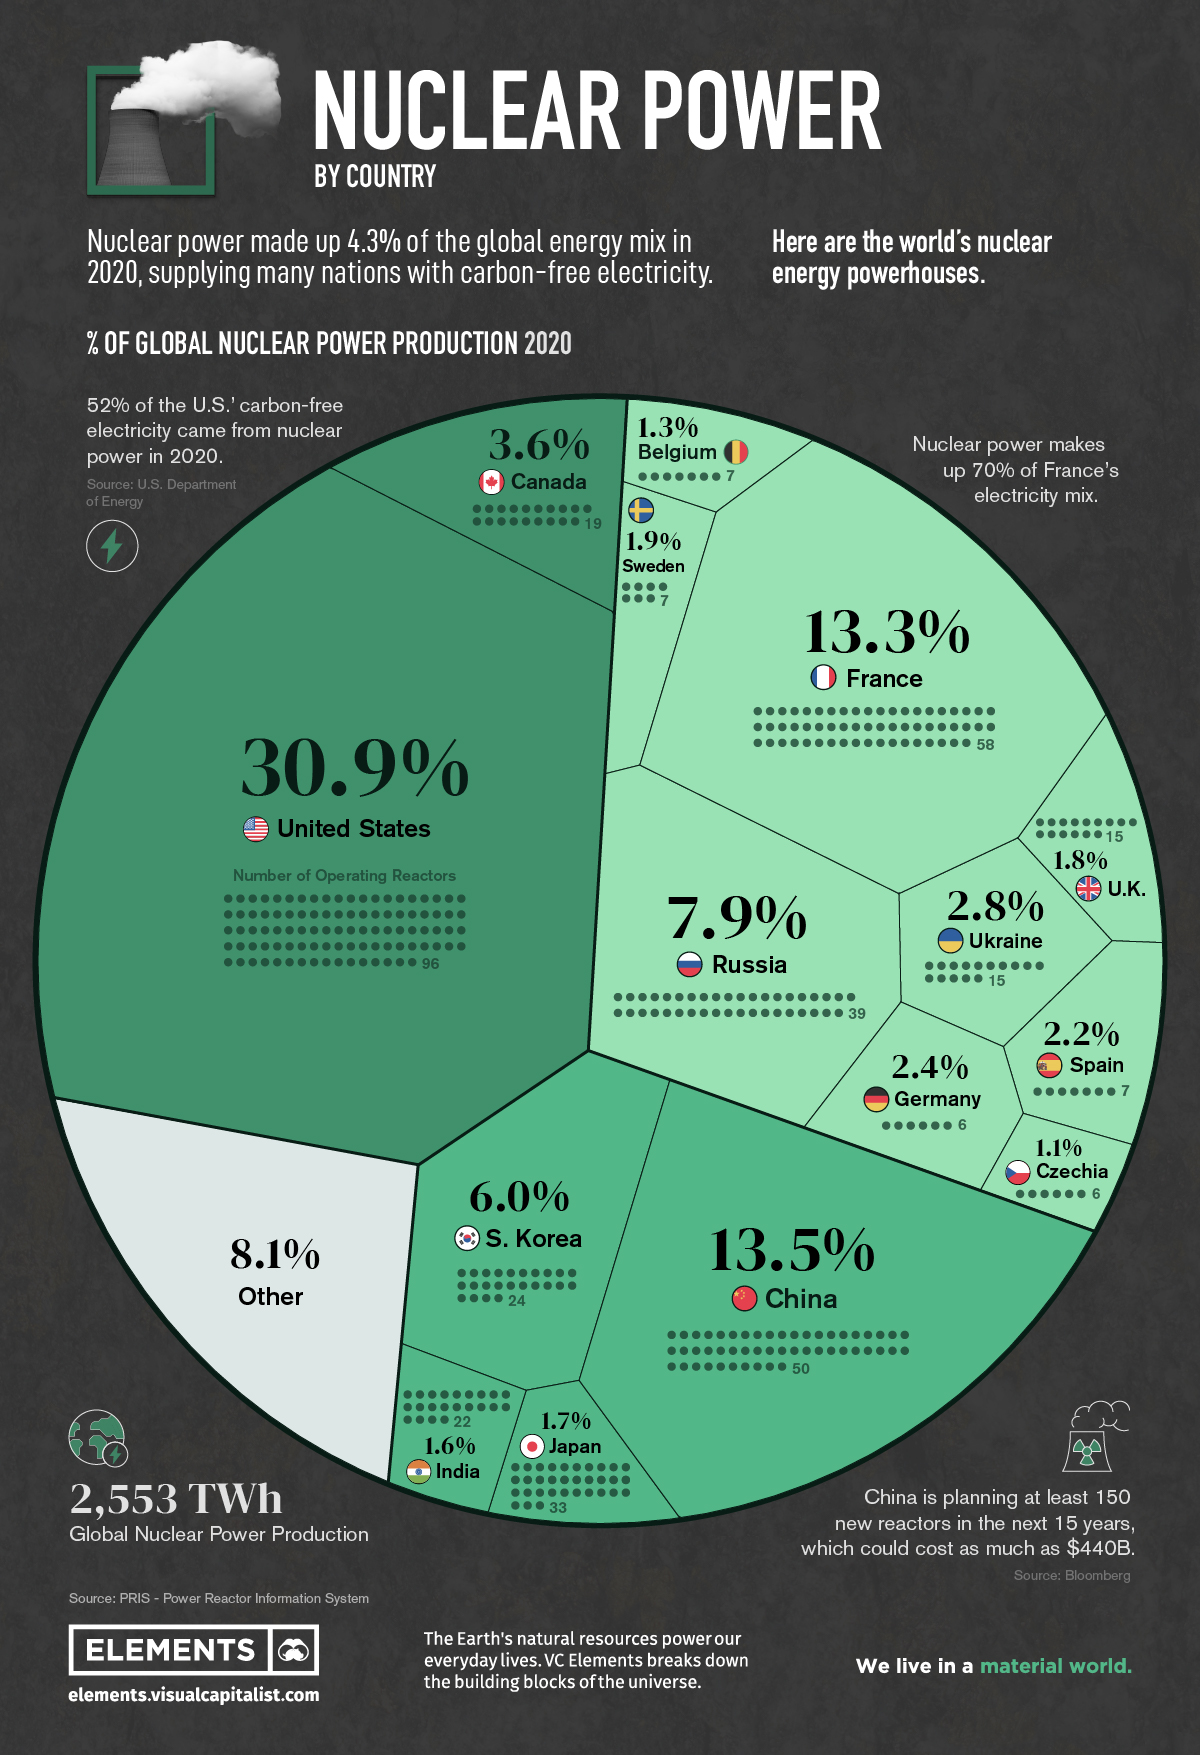
Nearly 450 reactors around the world supply various nations with nuclear power, combining for about 10% of the world’s electricity, or about 4% of the global energy mix.
But while some countries are turning to nuclear as a clean energy source, nuclear energy generation overall has seen a slowdown since its peak in the 1990s.
The above infographic breaks down nuclear electricity generation by country in 2020 using data from the Power Reactor Information System (PRIS).
Ranked: The Top 15 Countries for Nuclear Power
Just 15 countries account for more than 91% of global nuclear power production. Here’s how much energy these countries produced in 2020:
| Rank | Country | Number of Operating Reactors | Nuclear Electricity Supplied [GWh] | % share |
|---|---|---|---|---|
| #1 | U.S. 🇺🇸 | 96 | 789,919 | 30.9% |
| #2 | China 🇨🇳 | 50 | 344,748 | 13.5% |
| #3 | France 🇫🇷 | 58 | 338,671 | 13.3% |
| #4 | Russia 🇷🇺 | 39 | 201,821 | 7.9% |
| #5 | South Korea 🇰🇷 | 24 | 152,583 | 6.0% |
| #6 | Canada 🇨🇦 | 19 | 92,166 | 3.6% |
| #7 | Ukraine 🇺🇦 | 15 | 71,550 | 2.8% |
| #8 | Germany 🇩🇪 | 6 | 60,918 | 2.4% |
| #9 | Spain 🇪🇸 | 7 | 55,825 | 2.2% |
| #10 | Sweden 🇸🇪 | 7 | 47,362 | 1.9% |
| #11 | U.K. 🇬🇧 | 15 | 45,668 | 1.8% |
| #12 | Japan 🇯🇵 | 33 | 43,099 | 1.7% |
| #13 | India 🇮🇳 | 22 | 40,374 | 1.6% |
| #14 | Belgium 🇧🇪 | 7 | 32,793 | 1.3% |
| #15 | Czechia 🇨🇿 | 6 | 28,372 | 1.1% |
| Rest of the World 🌎 | 44 | 207,340 | 8.1% | |
| Total | 448 | 2,553,208 | 100.0% |
In the U.S., nuclear power produces over 50% of the country’s clean electricity. Additionally, 88 of the country’s 96 operating reactors in 2020 received approvals for a 20-year life extension.
China, the world’s second-largest nuclear power producer, is investing further in nuclear energy in a bid to achieve its climate goals. The plan, which includes building 150 new reactors by 2035, could cost as much as $440 billion.
On the other hand, European opinions on nuclear energy are mixed. Germany is the eighth-largest on the list but plans to shutter its last operating reactor in 2022 as part of its nuclear phase-out. France, meanwhile, plans to expand its nuclear capacity.
Which Countries Rely Most on Nuclear Energy?
Although total electricity generation is useful for a high-level global comparison, it’s important to remember that there are some smaller countries not featured above where nuclear is still an important part of the electricity mix.
Here’s a breakdown based on the share of nuclear energy in a country’s electricity mix:
| Rank | Country | Nuclear Share of Electricity Mix |
|---|---|---|
| #1 | France 🇫🇷 | 70.6% |
| #2 | Slovakia 🇸🇰 | 53.1% |
| #3 | Ukraine 🇺🇦 | 51.2% |
| #4 | Hungary 🇭🇺 | 48.0% |
| #5 | Bulgaria 🇧🇬 | 40.8% |
| #6 | Belgium 🇧🇪 | 39.1% |
| #7 | Slovenia 🇸🇮 | 37.8% |
| #8 | Czechia 🇨🇿 | 37.3% |
| #9 | Armenia 🇦🇲 | 34.5% |
| #10 | Finland 🇫🇮 | 33.9% |
| #11 | Switzerland 🇨🇭 | 32.9% |
| #12 | Sweden 🇸🇪 | 29.8% |
| #13 | South Korea 🇰🇷 | 29.6% |
| #14 | Spain 🇪🇸 | 22.2% |
| #15 | Russia 🇷🇺 | 20.6% |
| #16 | Romania 🇷🇴 | 19.9% |
| #17 | United States 🇺🇸 | 19.7% |
| #18 | Canada 🇨🇦 | 14.6% |
| #19 | United Kingdom 🇬🇧 | 14.5% |
| #20 | Germany 🇩🇪 | 11.3% |
European countries dominate the leaderboard with 14 of the top 15 spots, including France, where nuclear power is the country’s largest source of electricity.
It’s interesting to note that only a few of these countries are top producers of nuclear in absolute terms. For example, in Slovakia, nuclear makes up 53.6% of the electricity mix—however, the country’s four reactors make up less than 1% of total global operating capacity.
On the flipside, the U.S. ranks 17th by share of nuclear power in its mix, despite producing 31% of global nuclear electricity in 2020. This discrepancy is largely due to size and population. European countries are much smaller and produce less electricity overall than larger countries like the U.S. and China.
The Future of Nuclear Power
The nuclear power landscape is constantly changing.
There were over 50 additional nuclear reactors under construction in 2020, and hundreds more are planned primarily in Asia.
As countries turn away from fossil fuels and embrace carbon-free energy sources, nuclear energy might see a resurgence in the global energy mix despite the phase-outs planned in several countries around the globe.


Batteries
Visualized: The Rise of the LFP Battery
In 2022, the EV sector’s market share of the LFP battery rose from just 6% in 2020 to 30%, highlighting its growing popularity.


The Rise of the LFP Battery
Primarily a key component in fertilizers, phosphate is also essential to lithium iron phosphate (LFP) battery technology.
LFP is an emerging favorite in the expanding EV market, particularly in standard-range EVs. Factors driving this popularity include superior safety, longevity, cost-effectiveness, and environmental sustainability.
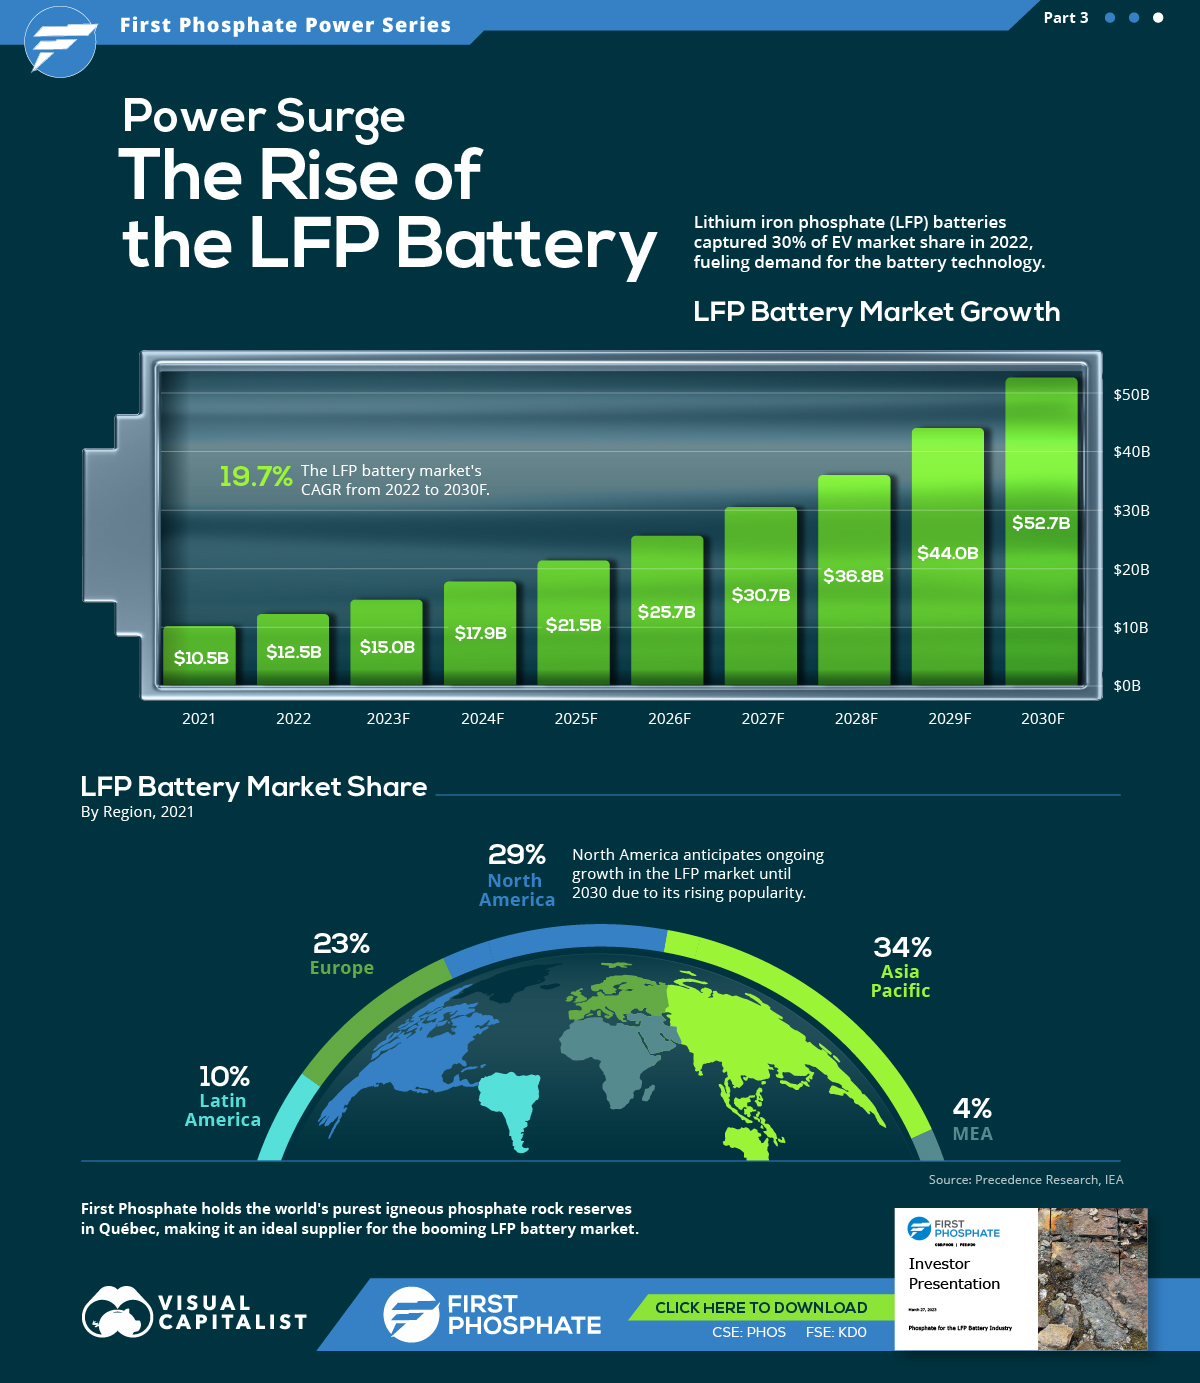
In this graphic, our sponsor First Phosphate looks at the growing LFP market, highlighting forecasted growth and current market share.
Market Growth
In 2022, the global LFP battery market stood at $12.5 billion. By 2030, this figure is expected to catapult to nearly $52.7 billion, signifying a CAGR of 19.7%.
| Year | USD (Billion) |
|---|---|
| 2021 | $10.5B |
| 2022 | $12.5B |
| 2023F | $15.0B |
| 2024F | $17.9B |
| 2025F | $21.5B |
| 2026F | $25.7B |
| 2027F | $30.7B |
| 2028F | $36.8B |
| 2029F | $44.0B |
| 2030F | $52.7B |
In 2022, LFP batteries cornered a sizable 30% of the EV market share from just 6% in 2020, demonstrating the growing appeal of this type of lithium-ion battery in the electric vehicle sector.
Market Share
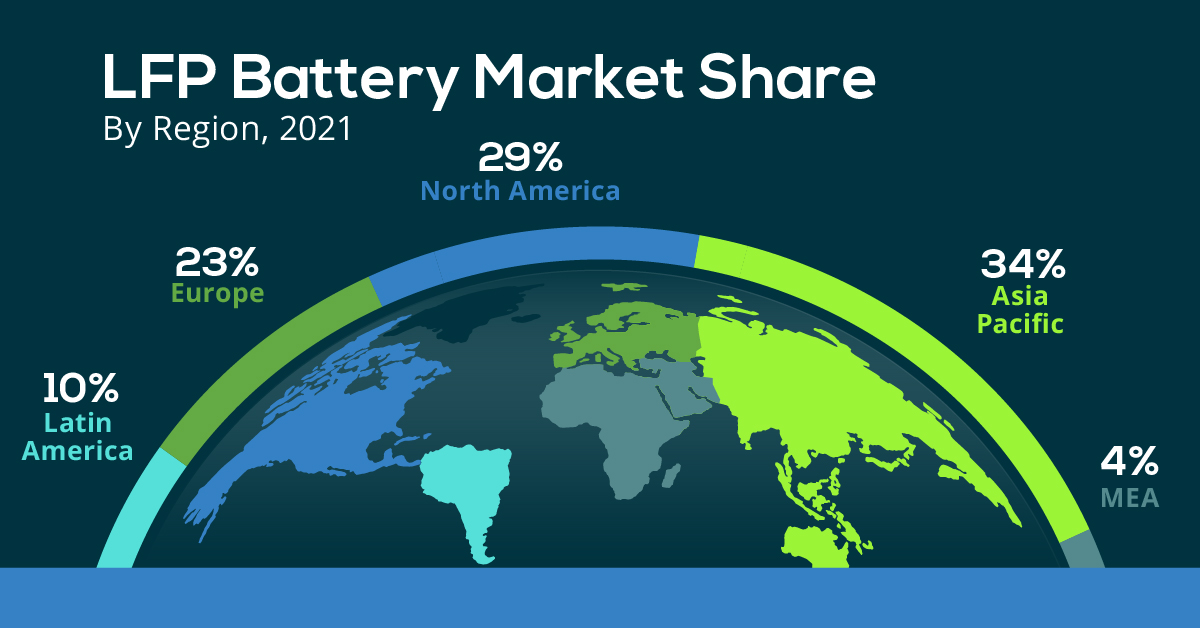
The Asia Pacific region dominated the LFP battery market in 2021, accounting for over 34% of the global share.
| Regions | Revenue Share (%) |
|---|---|
| Asia Pacific | 34% |
| North America | 29% |
| Europe | 23% |
| Latin America | 10% |
| MEA | 4% |
Meanwhile, North America, with the second largest share, is projected to witness ongoing growth through 2030.
First Phosphate holds access to 1% of the world’s purest igneous rock phosphate reserves in Québec, making it an ideal supplier for the growing LFP market.

-

 Maps2 months ago
Mapped: Renewable Energy and Battery Installations in the U.S. in 2023
This graphic describes new U.S. renewable energy installations by state along with nameplate capacity, planned to come online in 2023.
-

 Energy2 months ago
How EV Adoption Will Impact Oil Consumption (2015-2025P)
How much oil is saved by adding electric vehicles into the mix? We look at data from 2015 to 2025P for different types of EVs.
-
 Energy3 months ago
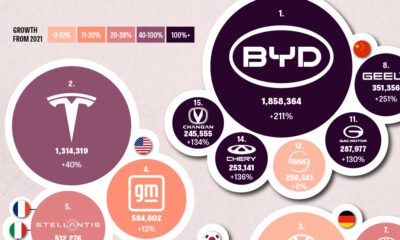
Global EV Production: BYD Surpasses Tesla
This graphic explores the latest EV production data for 2022, which shows BYD taking a massive step forward to surpass Tesla.
-

 Energy6 months ago
Visualizing China’s Dominance in Battery Manufacturing (2022-2027P)
This infographic breaks down battery manufacturing capacity by country in 2022 and 2027.
-

 Batteries7 months ago
Visualizing 25 Years of Lithium Production, by Country
Lithium production has grown exponentially over the last few decades. Which countries produce the most lithium, and how how has this mix evolved?
-
 Energy10 months ago
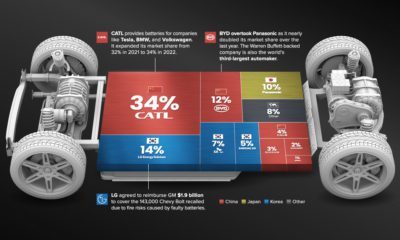
The Top 10 EV Battery Manufacturers in 2022
Despite efforts from the U.S. and Europe to increase the domestic production of batteries, the market is still dominated by Asian suppliers.

-

 Automation1 week ago
Charted: Changing Sentiments Towards AI in the Workplace
-

 VC+3 weeks ago
What are Top Investment Managers Holding in Their Portfolios?
-

 Markets1 week ago
The 50 Best One-Year Returns on the S&P 500 (1980-2022)
-

 United States3 weeks ago
Chart: U.S. Home Price Growth Over 50 Years
-

 United States1 week ago
Mapped: The Most Dangerous Cities in the U.S.
-

 Energy3 weeks ago
How Old Are the World’s Nuclear Reactors?
-

 Countries7 days ago
Mapped: World’s Top 40 Largest Military Budgets
-

 Energy3 weeks ago
How Big is the Market for Crude Oil?