Misc
Comparing Population Pyramids Around the World
Now Available, Exclusively to VC+ Members.
Dive deeper into what affects the demographics of global economies. Join VC+ to get our special dispatch!
Understanding and Comparing Population Pyramids
Demographic data can reveal all kinds of insights about a population, from the country’s fertility and mortality rates to how certain events and policies have shaped the makeup of a population.
Population pyramids are one of the best ways to visualize population data, and comparing the pyramids of various countries and regions side-by-side can reveal unexpected insights and differences between groups.
This graphic uses population data from the United Nations to compare the demographics of some select nations and regions of the world, showcasing how much age distributions can vary.
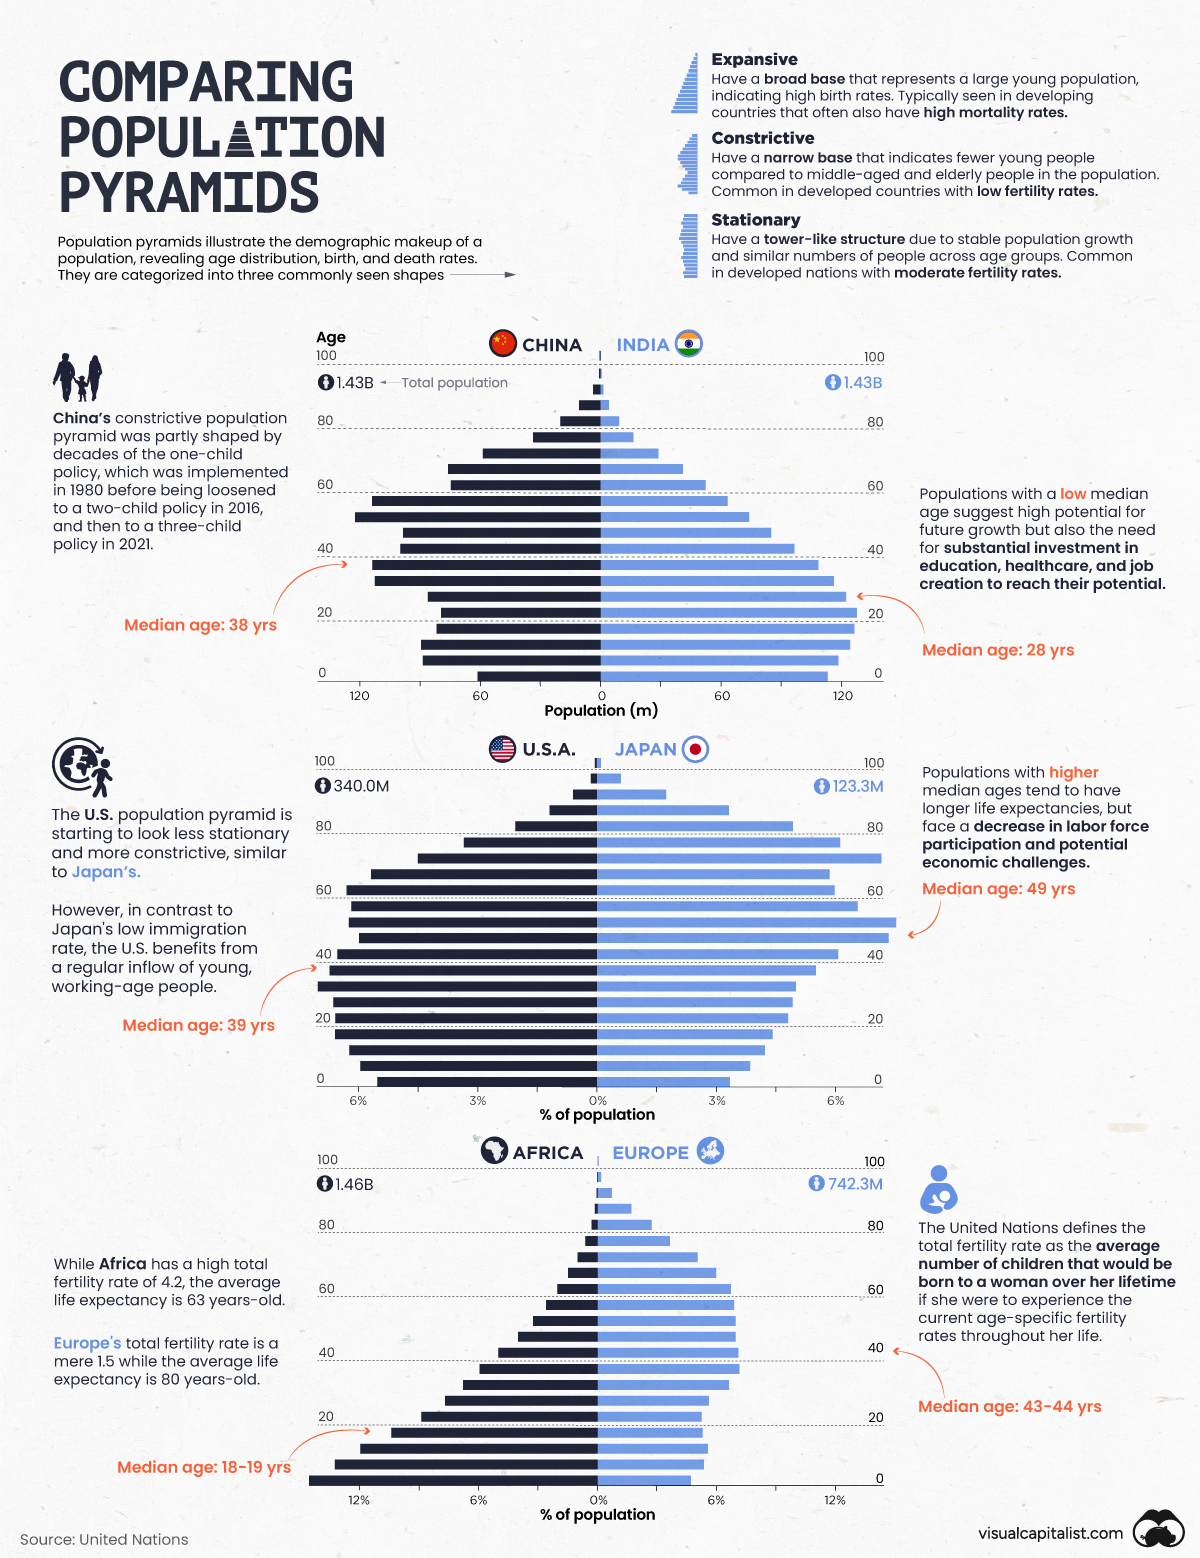
Three Types of Population Pyramids
Although population pyramids can come in all shapes and sizes, most generally fall into three distinct categories:
- Expansive Pyramids: Recognized by their traditional “pyramid-like” shape with a broad base and narrow top, expansive pyramids reflect a population with a high birth rate along with a high mortality rate which is most common in developing countries.
- Constrictive Pyramids: With a narrow base and thicker middle and top sections of the pyramid, constrictive pyramids often occur in developed economies whose populations have low birth rates and long life expectancies.
- Stationary Pyramids: These pyramids showcase an evenly distributed population across age groups, often found in newly-developed countries which have stable birth and mortality rates.
Each population pyramid is essentially a visual snapshot of a nation’s current demographic breakdown, shaped by fluctuating birth and mortality rates as well as changes to immigration and social policies.
Understanding the inherent risks associated with different pyramid types can help give insight into the challenges these populations face.
The Risks of Different Population Pyramid Types
Each type of population pyramid structure has unique challenges and advantages often characterized by the country or region’s current stage of economic development.
Populations with expansive pyramids, such as the one representing the continent of Africa, have the advantage of a larger youth and working-aged population, however this advantage can be rendered null if job growth, education, and health care aren’t prioritized.
Countries with constrictive pyramids like Japan face the challenge of supporting their outsized aging population with a diminishing working-aged population. While immigration and increasing birth rates can help in both the short and long term, due to the working population being outnumbered, countries with constrictive pyramids must find ways to increase their productivity to avoid potential declines in economic growth.
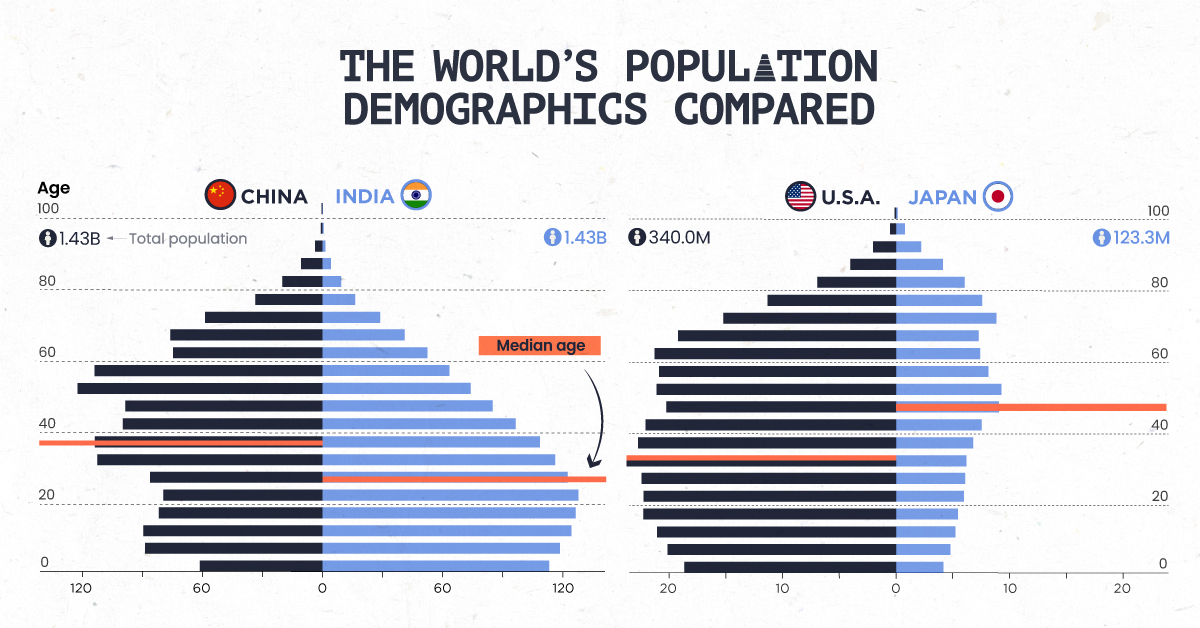
China and India’s Demographics Compared
After the world’s population reached eight billion people last year, 2023 brought a new population milestone as India overtook China as the world’s most populous country.
When you compare the two nations’ population pyramids, you can see how India’s population has a strong base of young and working-aged people compared to China’s more constrictive population pyramid that also features a higher median age.
This demographic difference is largely shaped by China’s one-child policy which since 2021 was loosened to be a three-child policy. As a result, China’s total fertility rate is around 1.2 today, in contrast to India’s total fertility rate of 2.0.
While India is set to ride the productivity boom of its large working-age population, the country will have to ensure it can keep its population pyramid stable as the majority of the population ages and total fertility rates continue to decline.
 |
Interested in learning more about the various factors that affect demographics?
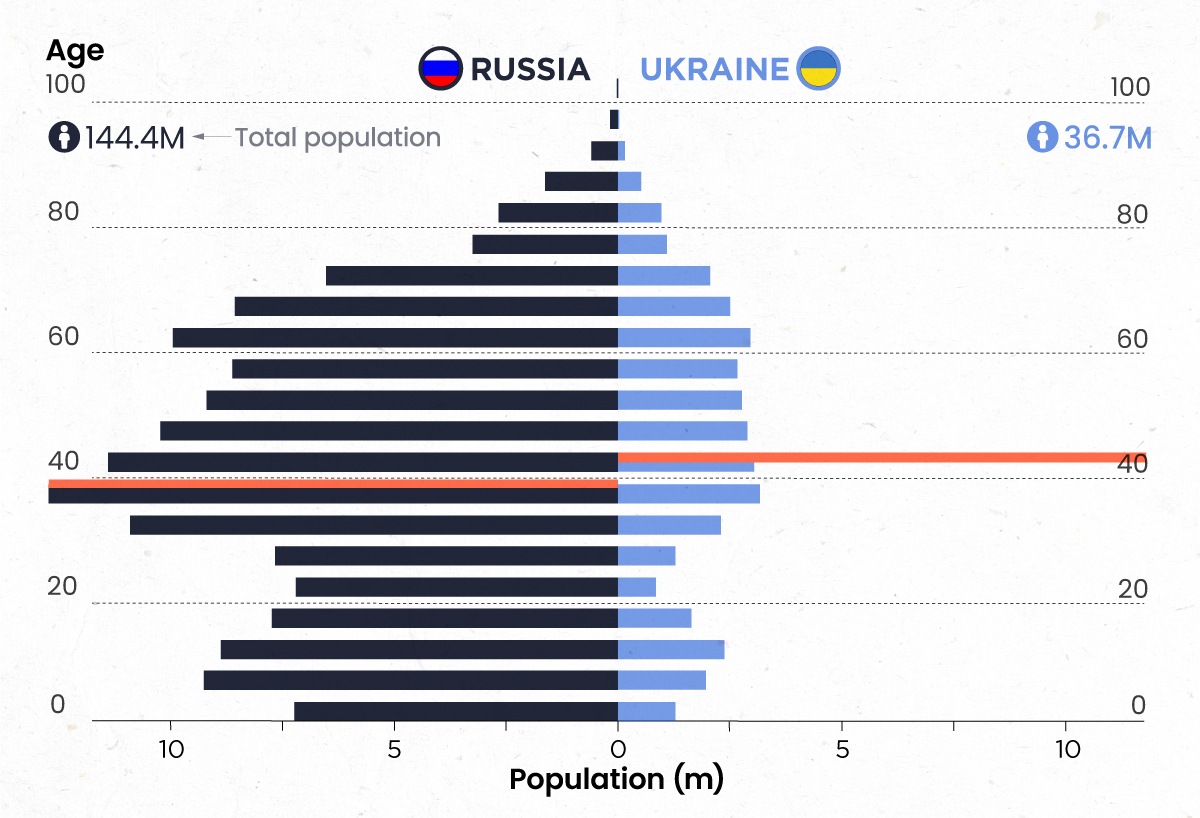
VC+ Members get an exclusive look comparing the G7 and BRICS nations, how war shapes population pyramids, and immigration’s role in demographics. Unlock this in-depth briefing and hundreds of other visual insights with our newly available VC+ Archive. |


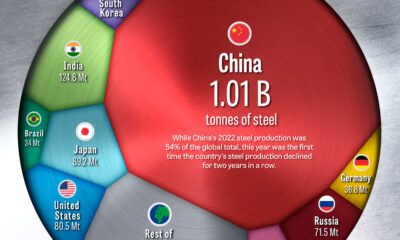


China
How Do Chinese Citizens Feel About Other Countries?
What is the Chinese public’s view of world powers? This visual breaks down Chinese sentiment towards other countries.
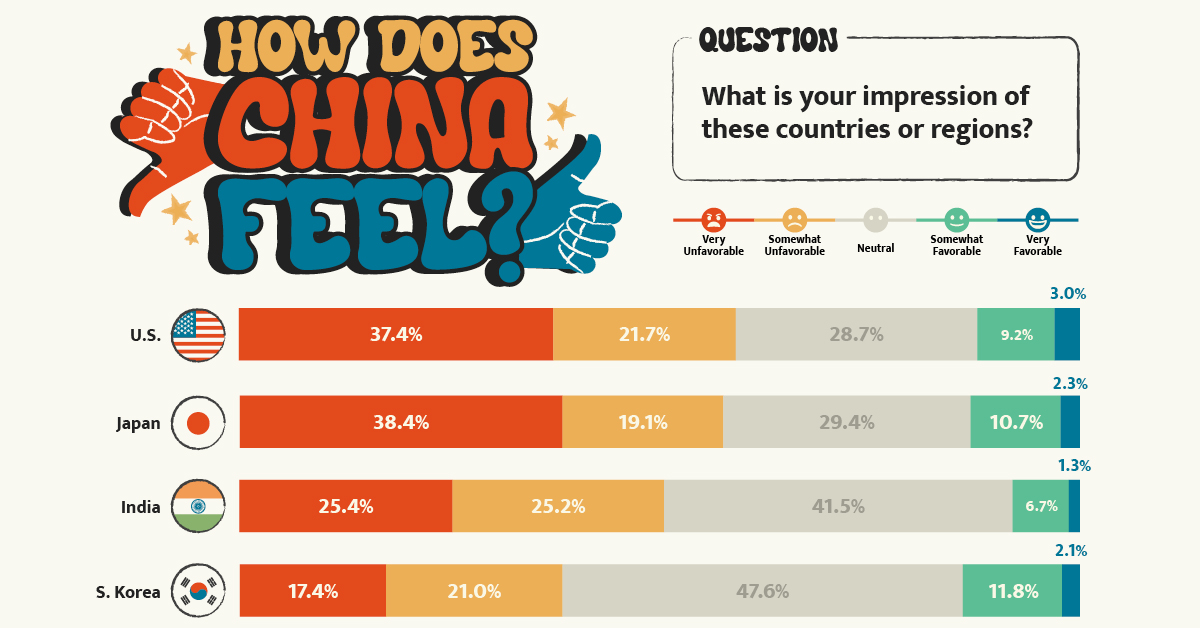
Public Opinion: How Chinese Citizens Feel About Other Countries
Tensions over Taiwan, the COVID-19 pandemic, trade, and the war in Ukraine have impacted Chinese sentiment towards other countries.
This visualization uses data from the Center for International Security and Strategy (CISS) at Tsinghua University to rank survey responses from the Chinese public on their attitudes towards countries and regions around the world.
Chinese Sentiment Towards Other Countries in 2023
In the Center’s opinion polls, which surveyed a random sample of more than 2,500 Chinese mainland adults in November 2022, Russia came out significantly ahead.
Just under 60% of respondents held Russia in a favorable view, with 19% seeing the country as “very favorable.” Contrast that to the mere 12% that viewed the U.S. in a positive light.
Here’s a closer look at the data. The percentages refer to the share of respondents that voted for said category.
| Country/Region | Very Unfavorable | Somewhat Unfavorable | Neutral | Somewhat Favorable | Very Favorable |
|---|---|---|---|---|---|
| 🇺🇸 United States | 37.4% | 21.7% | 28.7% | 9.2% | 3.0% |
| 🇯🇵 Japan | 38.4% | 19.1% | 29.4% | 10.7% | 2.3% |
| 🇮🇳 India | 25.4% | 25.2% | 41.5% | 6.7% | 1.3% |
| 🇰🇷 South Korea | 17.4% | 21.0% | 47.6% | 11.8% | 2.1% |
| 🇪🇺 European Union | 9.3% | 15.6% | 57.6% | 14.1% | 3.3% |
| Southeast Asia | 7.1% | 13.1% | 59.5% | 16.8% | 3.5% |
| 🇷🇺 Russia | 3.0% | 4.8% | 33.7% | 39.4% | 19.0% |
Japan ranked just below the U.S. in terms of overall unfavorability, though a slightly higher share of respondents saw Japan as “very unfavorable” compared to America. This is likely due to both modern tensions in the East China Sea over mutually claimed islands and historical tensions over the Sino-Japanese Wars.
Chinese sentiment towards India was also unfavorable at just over 50%, though notably the country also received the lowest favorability rating at just 8%.
Additional Survey Findings
The survey also found that 39% of Chinese people get their information on international security from Chinese state-run media (mainly through TV), with an additional 19% getting information from government websites and official social accounts. Conversely, only 1.7% get their news from foreign websites and foreign social media, partially due to the Great Firewall.
When asked about different international security issues, the biggest shares of Chinese citizens ranked the following as their top three:
- Pandemics (12.9%)
- Disputes over territory and territorial waters (12.9%)
- China-U.S. relations (12.0%)
The pandemic’s high score reflects the harsher impact COVID-19 had on China. Chinese borders were shut for years and the public faced intense measures to reduce spread.
In terms of other world events, the majority of Chinese people align with a more “Eastern” viewpoint. For example, in regards to the war in Ukraine, the report found that:
“About 80 percent of the respondents believe the U.S. and Western countries should be held most accountable [for the war], while less than ten percent of the respondents argue that Russia is mainly responsible.”– Center for International Security and Strategy, Tsinghua University
Overall, the views of the Chinese public reflect the opposite of those found in many Western countries. They provide an important insight that it is not just the Chinese government holding particular views about the world, but the Chinese public as well.

-

 Energy3 weeks ago
How Old Are the World’s Nuclear Reactors?
-

 Maps7 days ago
Mapped: World’s Top 40 Largest Military Budgets
-

 Energy3 weeks ago
How Big is the Market for Crude Oil?
-

 Cities6 days ago
Mapped: The Safest Cities in the U.S.
-

 Markets2 weeks ago
Ranked: The Most Profitable U.S. Companies, by Sector
-

 apps5 days ago
How Long it Took for Popular Apps to Reach 100 Million Users
-

 Markets4 weeks ago
The World’s Biggest Mutual Fund and ETF Providers
-

 Brands2 weeks ago
Brand Reputations: Ranking the Best and Worst in 2023