Healthcare
Visualizing the World’s Biggest Pharmaceutical Companies
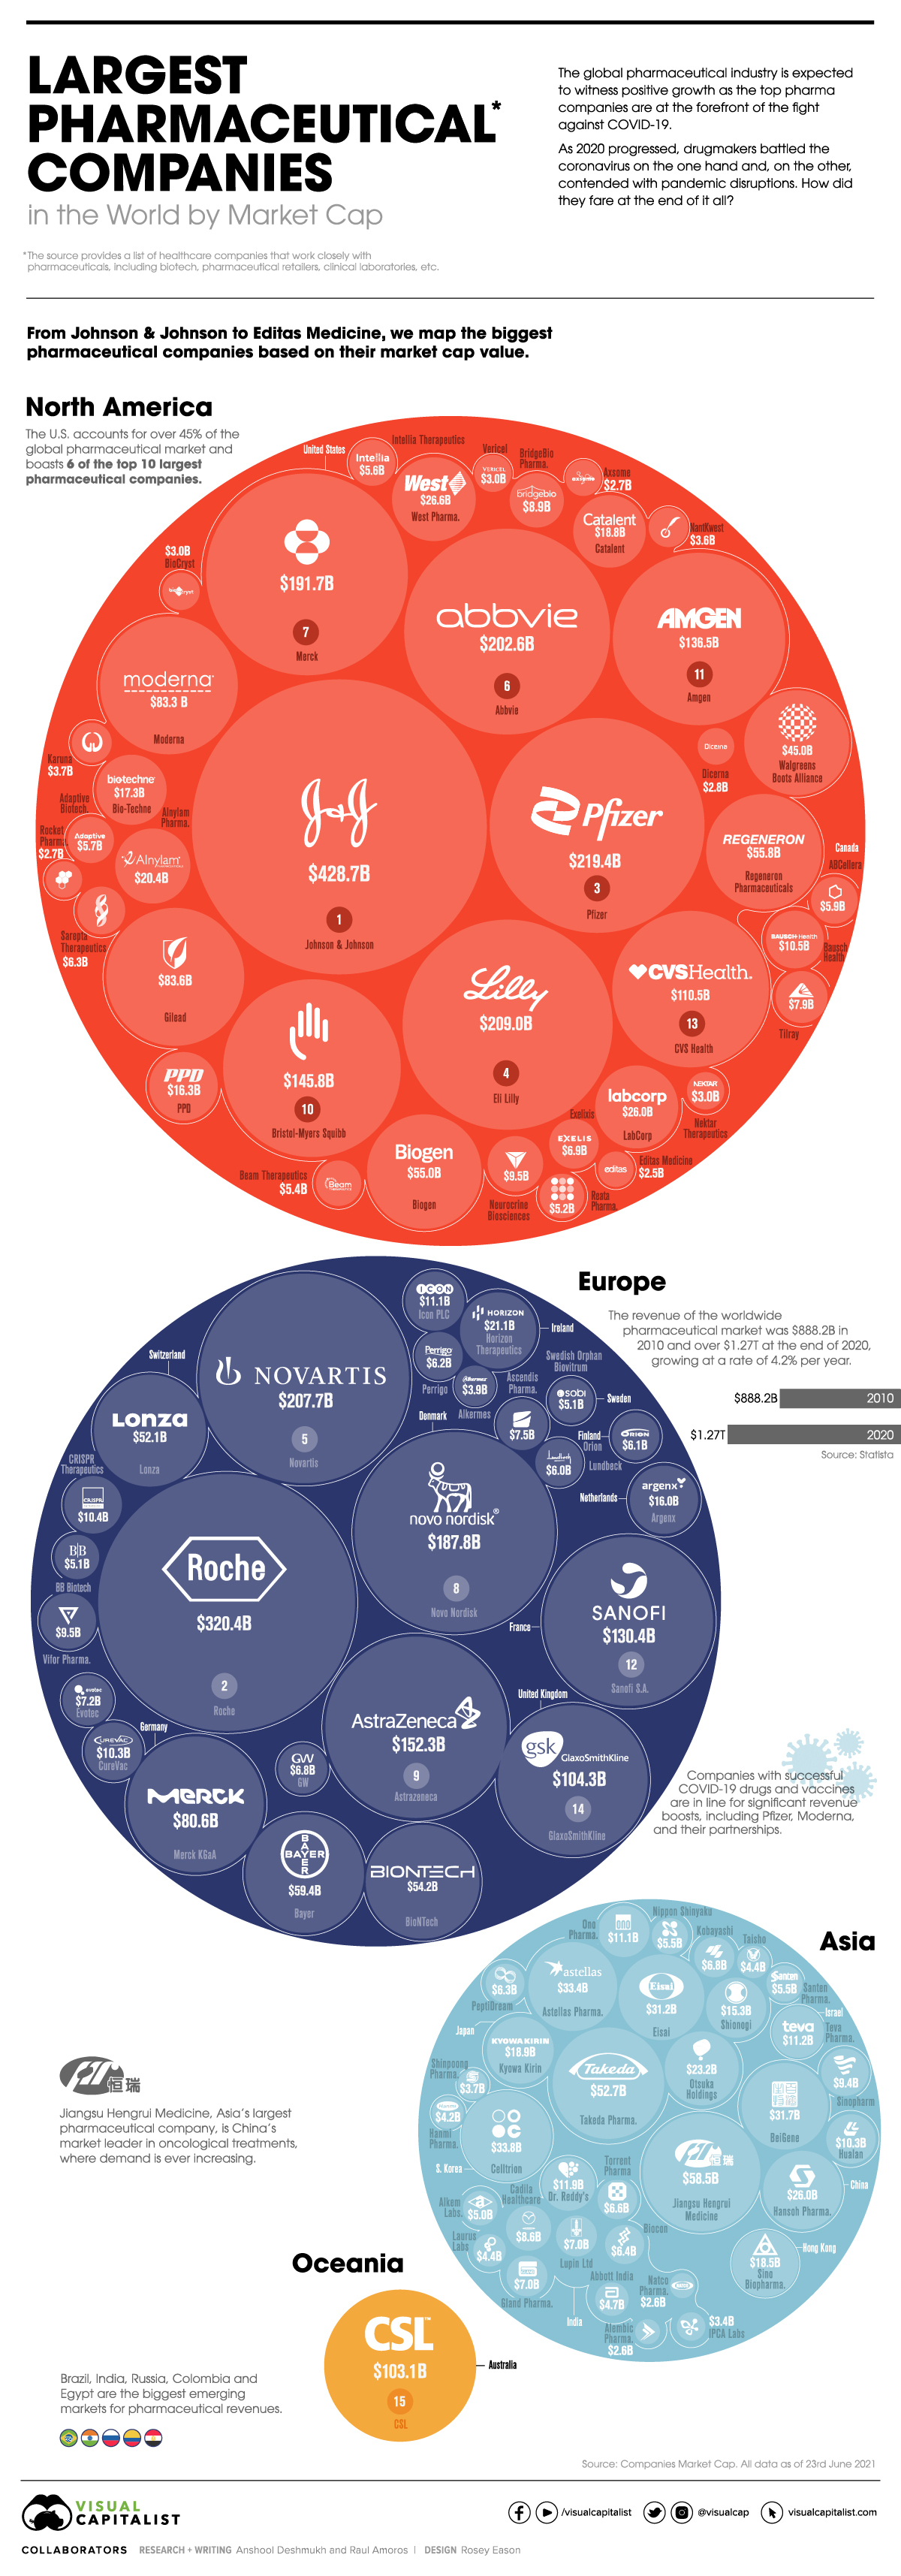


Who are the World’s Biggest Pharmaceutical Companies?
Some of the world’s biggest pharmaceutical companies have played a central role in the COVID-19 pandemic.
However, it’s likely no surprise that the pandemic has also been great for many healthcare businesses. In fact, in 2020 alone, the world’s 50 largest pharmaceutical companies still combined for a whopping $851 billion in revenues.
In this graphic, using data from Companies Market Cap, we list the largest pharmaceutical companies in the world by market capitalization. It’s worth noting this list also includes healthcare companies that work closely with pharmaceuticals, including biotech, pharmaceutical retailers, clinical laboratories, etc.
Editor’s Note: A previous version of this graphic was missing some key companies such as GSK and AbbVie. They were unfortunately not included in the original source and we are now working to make sure there were no other smaller omissions. Thanks to all that sent in corrections.
The Pharmaceutical Leaders
To start, here are the top five biggest pharmaceutical companies in the world at the moment by market capitalization:
1. Johnson & Johnson
The pharmaceutical and consumer goods giant is worth $428.7 billion in market cap. They developed the third vaccine authorized for use in the U.S. and were named among the TIME100 Most Influential Companies List in 2021.
2. Roche
The Swiss pharmaceutical giant is at the forefront of oncology, immunology, infectious diseases, ophthalmology, and neuroscience. In 2019, Roche’s pharma segment sales rose by a healthy 16% to $53 billion.
3. Pfizer
Despite being the leading COVID-19 vaccine manufacturer in North America, Pfizer slid in the rankings to third place. The company has recently gained momentum, especially in the past quarter, with Q2’2021 revenues of $19.0 billion, reflecting a 86% operational growth from 2020.
4. Eli Lilly
Eli Lilly has taken a significant step towards establishing itself as a pharmaceutical industry leader. Having a market cap value of $125 billion in 2019, Eli Lilly has jumped to a current value of $214.9 billion, a significant growth of 72%.
5. Novartis
The second-biggest pharmaceutical company out of Switzerland, Novartis has been the face of the pharma industry for about 25 years. The primary manufacturer for the most recognizable drugs on the market pulled in a revenue of over $48 billion in 2020, a 3% increase compared to 2019.
Here’s how all the biggest pharmaceutical companies in the world stack up against each other:
| Company Rank | Company Name | Market Cap Value | Country |
|---|---|---|---|
| 1 | Johnson & Johnson JNJ | $428.66 B | 🇺🇸 USA |
| 2 | Roche RHHBY | $320.41 B | 🇨🇭 Switzerland |
| 3 | Pfizer PFE | $219.39 B | 🇺🇸 USA |
| 4 | Eli Lilly LLY | $208.99 B | 🇺🇸 USA |
| 5 | Novartis NVS | $207.70 B | 🇨🇭 Switzerland |
| 6 | AbbVie ABBV | $202.60 B | 🇺🇸 USA |
| 7 | Merck MRK | $191.67 B | 🇺🇸 USA |
| 8 | Novo Nordisk NVO | $187.83 B | 🇩🇰 Denmark |
| 9 | Astrazeneca AZN | $152.28 B | 🇬🇧 UK |
| 10 | Bristol-Myers Squibb BMY | $145.80 B | 🇺🇸 USA |
| 11 | Amgen AMGN | $136.50 B | 🇺🇸 USA |
| 12 | Sanofi SNY | $130.37 B | 🇫🇷 France |
| 13 | CVS Health CVS | $110.49 B | 🇺🇸 USA |
| 14 | GlaxoSmithKline GSK | $104.30 B | 🇬🇧 UK |
| 15 | CSL CSL.AX | $103.10 B | 🇦🇺 Australia |
| 16 | Gilead Sciences GILD | $83.62 B | 🇺🇸 USA |
| 17 | Moderna MRNA | $83.25 B | 🇺🇸 USA |
| 18 | Merck KGaA MRK.DE | $80.61 B | 🇩🇪 Germany |
| 19 | Bayer BAYZF | $59.43 B | 🇩🇪 Germany |
| 20 | Jiangsu Hengrui Medicine 600276.SS | $58.51 B | 🇨🇳 China |
| 21 | Regeneron Pharmaceuticals REGN | $55.83 B | 🇺🇸 USA |
| 22 | Biogen BIIB | $55.00 B | 🇺🇸 USA |
| 23 | BioNTech BNTX | $54.23 B | 🇩🇪 Germany |
| 24 | Takeda Pharmaceutical TAK | $52.67 B | 🇯🇵 Japan |
| 25 | Lonza LONN.SW | $52.16 B | 🇨🇭 Switzerland |
| 26 | Walgreens Boots Alliance WBA | $45.05 B | 🇺🇸 USA |
| 27 | Celltrion 068270.KS | $33.80 B | 🇰🇷 S. Korea |
| 28 | Astellas Pharma ALPMF | $33.42 B | 🇯🇵 Japan |
| 29 | BeiGene BGNE | $31.65 B | 🇨🇳 China |
| 30 | Eisai 4523.T | $31.20 B | 🇯🇵 Japan |
| 31 | West Pharma WST | $26.59 B | 🇺🇸 USA |
| 32 | Hansoh Pharma 3692.HK | $26.00 B | 🇨🇳 China |
| 33 | LabCorp LH | $25.97 B | 🇺🇸 USA |
| 34 | Otsuka Holdings 4578.T | $23.15 B | 🇯🇵 Japan |
| 35 | Horizon Therapeutics HZNP | $21.13 B | 🇮🇪 Ireland |
| 36 | Alnylam Pharmaceuticals ALNY | $20.42 B | 🇺🇸 USA |
| 37 | kyowa Kirin 4151.T | $18.85 B | 🇯🇵 Japan |
| 38 | Catalent CTLT | $18.74 B | 🇺🇸 USA |
| 39 | Sino Biopharmaceutical 1177.HK | $18.48 B | 🇭🇰 Hong Kong |
| 40 | Bio-Techne TECH | $17.25 B | 🇺🇸 USA |
| 41 | PPD PPD | $16.26 B | 🇺🇸 USA |
| 42 | Argenx ARGX | $16.03 B | 🇳🇱 Netherlands |
| 43 | Shionogi 4507.T | $15.29 B | 🇯🇵 Japan |
| 44 | Dr. Reddy's RDY | $11.88 B | 🇮🇳 India |
| 45 | Teva Pharmaceutical Industries TEVA | $11.21 B | 🇮🇱 Israel |
| 46 | Ono Pharmaceutical 4528.T | $11.12 B | 🇯🇵 Japan |
| 47 | ICON plc ICLR | $11.09 B | 🇮🇪 Ireland |
| 48 | Bausch Health BHC | $10.47 B | 🇨🇦 Canada |
| 49 | CRISPR Therapeutics CRSP | $10.42 B | 🇨🇭 Switzerland |
| 50 | Curevac CVAC | $10.33 B | 🇩🇪 Germany |
| 51 | Hualan Biological Engineering 002007.SZ | $10.31 B | 🇨🇳 China |
| 52 | Vifor Pharma VIFN.SW | $9.49 B | 🇨🇭 Switzerland |
| 53 | Neurocrine Biosciences NBIX | $9.45 B | 🇺🇸 USA |
| 54 | Sinopharm 1099.HK | $9.42 B | 🇨🇳 China |
| 55 | BridgeBio Pharma BBIO | $8.89 B | 🇺🇸 USA |
| 56 | Cadila Healthcare CADILAHC.NS | $8.59 B | 🇮🇳 India |
| 57 | Sumitomo Dainippon Pharma 4506.T | $8.16 B | 🇯🇵 Japan |
| 58 | Tilray TLRY | $7.89 B | 🇨🇦 Canada |
| 59 | Ascendis Pharma ASND | $7.51 B | 🇩🇰 Denmark |
| 60 | Evotec EVT.F | $7.19 B | 🇩🇪 Germany |
| 61 | Lupin Limited LUPIN.NS | $7.04 B | 🇮🇳 India |
| 62 | Gland Pharma GLAND.NS | $7.01 B | 🇮🇳 India |
| 63 | Exelixis EXEL | $6.95 B | 🇺🇸 USA |
| 64 | GW Pharmaceuticals GWPH | $6.81 B | 🇬🇧 UK |
| 65 | KOBAYASHI Pharmaceutical 4967.T | $6.78 B | 🇯🇵 Japan |
| 66 | Torrent Pharmaceuticals TORNTPHARM.NS | $6.61 B | 🇮🇳 India |
| 67 | Biocon BIOCON.NS | $6.43 B | 🇮🇳 India |
| 68 | PeptiDream 4587.T | $6.32 B | 🇯🇵 Japan |
| 69 | Sarepta Therapeutics SRPT | $6.25 B | 🇺🇸 USA |
| 70 | Perrigo PRGO | $6.21 B | 🇮🇪 Ireland |
| 71 | Orion Corporation ORNAV.HE | $6.11 B | 🇫🇮 Finland |
| 72 | Lundbeck LDB.F | $6.04 B | 🇩🇰 Denmark |
| 73 | AbCellera ABCL | $5.87 B | 🇨🇦 Canada |
| 74 | Adaptive Biotechnologies ADPT | $5.69 B | 🇺🇸 USA |
| 75 | Intellia Therapeutics NTLA | $5.62 B | 🇺🇸 USA |
| 76 | Santen Pharmaceutical 4536.T | $5.49 B | 🇯🇵 Japan |
| 77 | Nippon Shinyaku 4516.T | $5.46 B | 🇯🇵 Japan |
| 78 | Beam Therapeutics BEAM | $5.43 B | 🇺🇸 USA |
| 79 | Reata Pharmaceuticals RETA | $5.15 B | 🇺🇸 USA |
| 80 | Swedish Orphan Biovitrum SOBI.ST | $5.13 B | 🇸🇪 Sweden |
| 81 | BB Biotech BION.SW | $5.08 B | 🇨🇭 Switzerland |
| 82 | Alkem Laboratories ALKEM.NS | $5.00 B | 🇮🇳 India |
| 83 | Abbott India ABBOTINDIA.NS | $4.69 B | 🇮🇳 India |
| 84 | Laurus Labs LAURUSLABS.NS | $4.44 B | 🇮🇳 India |
| 85 | Taisho Pharmaceutical 4581.T | $4.39 B | 🇯🇵 Japan |
| 86 | Hanmi Pharmaceutical 008930.KS | $4.22 B | 🇰🇷 S. Korea |
| 87 | Alkermes ALKS | $3.87 B | 🇮🇪 Ireland |
| 88 | Karuna Therapeutics KRTX | $3.71 B | 🇺🇸 USA |
| 89 | Shinpoong Pharm 019170.KS | $3.65 B | 🇰🇷 S. Korea |
| 90 | NantKwest NK | $3.55 B | 🇺🇸 USA |
| 91 | Ipca Laboratories IPCALAB.NS | $3.41 B | 🇮🇳 India |
| 92 | Nektar Therapeutics NKTR | $3.02 B | 🇺🇸 USA |
| 93 | BioCryst Pharmaceuticals BCRX | $3.01 B | 🇺🇸 USA |
| 94 | Vericel VCEL | $2.96 B | 🇺🇸 USA |
| 95 | Dicerna Pharmaceuticals DRNA | $2.84 B | 🇺🇸 USA |
| 96 | Rocket Pharmaceuticals RCKT | $2.74 B | 🇺🇸 USA |
| 97 | Axsome Therapeutics AXSM | $2.65 B | 🇺🇸 USA |
| 98 | Natco Pharma NATCOPHARM.NS | $2.63 B | 🇮🇳 India |
| 99 | Alembic Pharmaceuticals APLLTD.NS | $2.59 B | 🇮🇳 India |
| 100 | Editas Medicine EDIT | $2.54 B | 🇺🇸 USA |
World’s Largest Pharmaceutical Exporters and Importers
According to the World Trade Organization (WTO), these countries exported the most number of pharmaceuticals in the year 2019:
| Rank | Country | Export Value (US$B) |
|---|---|---|
| 1 | 🇩🇪 Germany | $91.4 |
| 2 | 🇨🇭 Switzerland | $84.8 |
| 3 | 🇺🇸 U.S. | $55.7 |
| 4 | 🇧🇪 Belgium | $55.7 |
| 5 | 🇮🇪 Ireland | $55.4 |
In contrast, here are the biggest importers over the same period.
| Rank | Country | Import Value (US$B) |
|---|---|---|
| 1 | 🇺🇸 U.S. | $132.4 |
| 2 | 🇩🇪 Germany | $59.4 |
| 3 | 🇧🇪 Belgium | $47.3 |
| 4 | 🇨🇳 China | $35.7 |
| 5 | 🇳🇱 Netherlands | $33.5 |
This position is hardly surprising for the U.S., where six of the world’s top 10 pharmaceutical companies are headquartered. The country also captures 45% of the global market.
The Future of Pharmaceutical Companies
If the response to the COVID-19 pandemic has taught us anything, it is that in building a patient-centered future, the pharmaceutical industry plays a key role. It has to constantly find new ways to customize medicines while researching and developing new tools and drugs.
By embracing disruptive technologies like 3D printed drugs, artificial intelligence guided therapies, and preventive medicine while working with regulatory agencies, the pharmaceutical companies will benefit from having a digital revolution.
Furthermore, emerging markets will have a more significant say in the global pharmaceutical market in the coming years. Even though ‘big pharma’ will keep raking in the massive profits they do every year, their reliance on countries like Brazil and India for research and drug production will significantly impact the years to come.


population
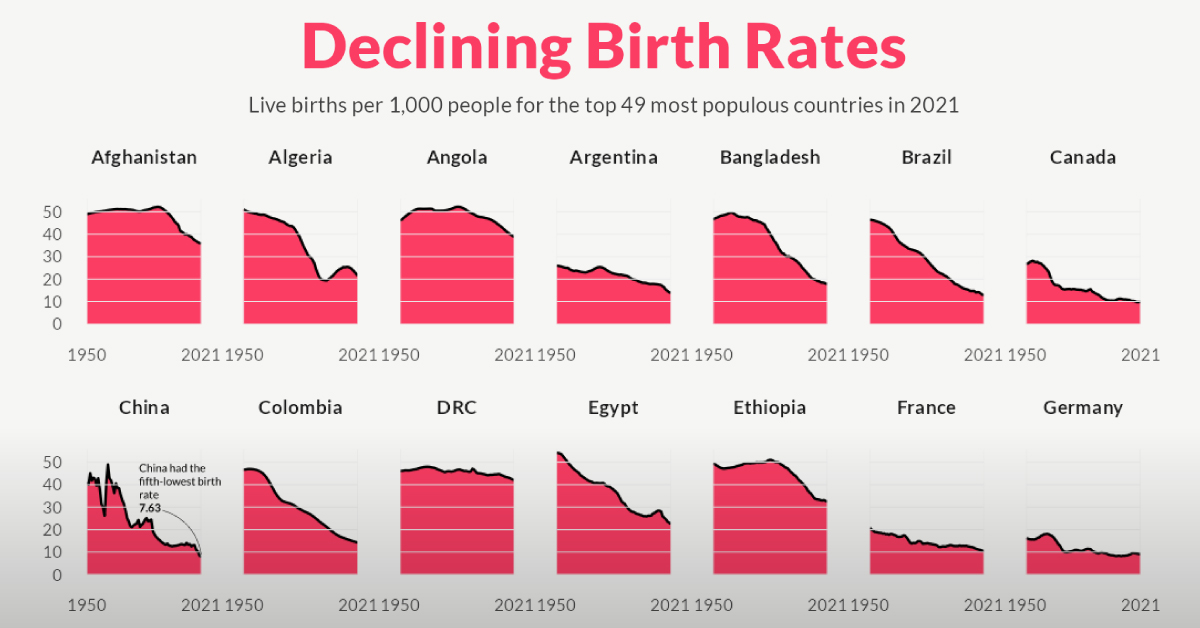
Charted: The Rapid Decline of Global Birth Rates
For the last 70 years, birth rates for the 49 most populous countries of the world have fallen sharply, heralding an uncertain future.
 Creator Program
Charted: The Rapid Decline in Global Birth Rates
In 1798, British economist Thomas Malthus proposed a groundbreaking theory now known as the “Malthusian Trap”—suggesting that human population growth is exponential and thus would outpace the linear growth of resources such as food supply.
He worried that this runaway population growth would become unsustainable, eventually relying on sudden shock events—wars, disasters, famines—to reset the population to more sustainable levels. And over the next 200 years, the world population skyrocketed from 1 billion to 8 billion people on the planet.
However, as it turns out, no such shock events were required to turn the tide of population growth. Instead, it’s been rapidly declining birth rates across the world that seem to be leading to an unthinkable outcome for Malthus: a gradually plateauing or even shrinking global population.
In the visualization above, Pablo Alvarez has visualized the crude birth rate for the 49 most populous countries of the world in 2021, using data from the UN’s World Population Prospects 2022 to examine changes since 1950.
Understanding Birth Rates vs Fertility Rates
Birth rates are commonly measured using a metric called the “crude birth rate” (CBR), which represents the number of live births per 1,000 individuals in a given population during a specific period—usually one year.
The measured decline in CBR is also a result of plummeting fertility rates across the globe. Not to be confused with birth rates, fertility rates measure how many children a woman will have over the course of her lifetime.
While a country’s birth rate is directly impacted by the fertility rate, it also takes into account other factors: population size, age structure of the population, access to contraception, cultural norms, government policies, and socioeconomic conditions.
Birth Rates of the Most Populated Countries
Here’s a snapshot of the CBR for the 49 most populous countries of the world at different years from 1950 to 2021.
| Country | 1950 | 1990 | 2021 | % Change (1950-2021) |
|---|---|---|---|---|
| 🇦🇫 Afghanistan | 48.87 | 51.42 | 35.84 | -27% |
| 🇩🇿 Algeria | 51.05 | 30.76 | 21.52 | -58% |
| 🇦🇴 Angola | 46.15 | 51.34 | 38.81 | -16% |
| 🇦🇷 Argentina | 26.00 | 21.99 | 13.90 | -47% |
| 🇧🇩 Bangladesh | 46.52 | 34.97 | 17.82 | -62% |
| 🇧🇷 Brazil | 46.43 | 24.84 | 12.88 | -72% |
| 🇨🇦 Canada | 26.80 | 15.46 | 9.82 | -63% |
| 🇨🇳 China | 41.05 | 24.44 | 7.63 | -81% |
| 🇨🇴 Colombia | 46.74 | 27.37 | 14.20 | -70% |
| 🇨🇩 DRC | 46.02 | 46.01 | 42.05 | -9% |
| 🇪🇬 Egypt | 54.20 | 33.21 | 22.56 | -58% |
| 🇪🇹 Ethiopia | 49.40 | 50.05 | 32.38 | -34% |
| 🇫🇷 France | 20.77 | 13.34 | 10.50 | -49% |
| 🇩🇪 Germany | 16.22 | 11.30 | 9.17 | -43% |
| 🇬🇭 Ghana | 46.76 | 40.37 | 27.55 | -41% |
| 🇮🇳 India | 43.84 | 31.82 | 16.42 | -63% |
| 🇮🇩 Indonesia | 40.64 | 25.52 | 16.42 | -60% |
| 🇮🇷 Iran | 50.14 | 32.46 | 13.70 | -73% |
| 🇮🇶 Iraq | 45.73 | 39.41 | 27.37 | -40% |
| 🇮🇹 Italy | 19.70 | 10.01 | 6.93 | -65% |
| 🇯🇵 Japan | 28.34 | 9.91 | 6.57 | -77% |
| 🇰🇪 Kenya | 49.47 | 43.52 | 27.68 | -44% |
| 🇲🇾 Malaysia | 44.31 | 27.89 | 15.24 | -66% |
| 🇲🇽 Mexico | 49.31 | 29.30 | 14.86 | -70% |
| 🇲🇦 Morocco | 51.08 | 29.23 | 17.55 | -66% |
| 🇲🇿 Mozambique | 46.66 | 46.38 | 36.60 | -22% |
| 🇲🇲 Myanmar | 45.58 | 27.48 | 17.10 | -62% |
| 🇳🇵 Nepal | 47.06 | 38.11 | 20.40 | -57% |
| 🇳🇬 Nigeria | 45.61 | 43.79 | 37.12 | -19% |
| 🇵🇰 Pakistan | 43.72 | 43.15 | 27.52 | -37% |
| 🇵🇪 Peru | 48.16 | 30.90 | 17.62 | -63% |
| 🇵🇭 Philippines | 49.84 | 33.26 | 21.81 | -56% |
| 🇵🇱 Poland | 30.85 | 14.28 | 9.49 | -69% |
| 🇷🇺 Russia | 28.80 | 13.52 | 9.64 | -67% |
| 🇸🇦 Saudi Arabia | 53.34 | 34.41 | 17.47 | -67% |
| 🇿🇦 South Africa | 41.65 | 31.15 | 19.82 | -52% |
| 🇰🇷 South Korea | 40.03 | 15.69 | 5.58 | -86% |
| 🇪🇸 Spain | 20.01 | 10.30 | 7.55 | -62% |
| 🇸🇩 Sudan | 47.75 | 43.09 | 33.60 | -30% |
| 🇹🇿 Tanzania | 47.75 | 43.78 | 36.21 | -24% |
| 🇹🇭 Thailand | 43.84 | 19.73 | 9.00 | -79% |
| 🇹🇷 Türkiye | 46.39 | 25.87 | 14.68 | -68% |
| 🇺🇸 U.S. | 22.81 | 16.73 | 11.06 | -52% |
| 🇺🇬 Uganda | 52.42 | 51.37 | 36.80 | -30% |
| 🇬🇧 UK | 16.44 | 13.88 | 10.08 | -39% |
| 🇺🇦 Ukraine | 22.95 | 12.76 | 7.72 | -66% |
| 🇺🇿 Uzbekistan | 39.85 | 33.98 | 23.55 | -41% |
| 🇻🇳 Vietnam | 38.82 | 28.51 | 15.01 | -61% |
| 🇾🇪 Yemen | 52.59 | 50.64 | 30.54 | -42% |
Every country on the list has seen a decline in birth rates in the last 70 years, with some declines more staggering than others. For example, China recorded 41 births per 1,000 people in 1950. By 2021, that number had fallen to just 7.6, a 81% decrease.
South Korea, the 29th most populous country in the world in 2021, saw an even larger 86% drop in its birth rate since 1950. In fact, almost every single country in this dataset has seen a double-digit fall in their birth rates over the past 70 years. Only the Democratic Republic of Congo has seen a single-digit percentage decline between 1950 and 2021.
Why are Global Birth Rates Falling?
For the 49 most populated countries in 2021, birth rates have halved on average in the last 70 years:
| 49 Most Populated Countries | 1950 | 1990 | 2021 |
|---|---|---|---|
| Average Birth Rate | 40.99 | 30.18 | 19.50 |
| Median Birth Rate | 45.73 | 30.76 | 17.10 |
But while the thought of a shrinking world population may seem worrisome, declining birth rates are generally thought of as a triumph of rapid socio-economic development.
As countries progress and living standards improve, there is a shift in societal norms and aspirations. For example, expanded education and career opportunities for women allow the pursuit of professional growth and personal goals, with some women choosing to delay starting a family or having smaller families.
Growing urbanization is another key driver of declining birth rates, characterized by smaller living spaces, increased focus on careers, and limited support networks. Another is the growing access to family planning services and contraceptives, particularly since the 1970s.
What are the Future Consequences?
The biggest consequence of declining birth rates—and one that is already being seen in many parts of the world—is a rapidly aging population.
With fewer children being born, the proportion of elderly individuals increases relative to the working-age population. This demographic imbalance poses challenges for social welfare systems, healthcare, and pension schemes.
Declining birth rates can also impact the labor market and economic productivity. A smaller workforce may lead to labor shortages, skill gaps, and reduced innovation. And shrinking populations reduce consumer demand, a cornerstone of the global economy, which may trigger a restructure of the current growth model of development.
-

 AI1 week ago
Charted: Changing Sentiments Towards AI in the Workplace
-

 VC+3 weeks ago
What are Top Investment Managers Holding in Their Portfolios?
-

 Markets1 week ago
The 50 Best One-Year Returns on the S&P 500 (1980-2022)
-

 United States3 weeks ago
Chart: U.S. Home Price Growth Over 50 Years
-

 United States1 week ago
Mapped: The Most Dangerous Cities in the U.S.
-

 Energy3 weeks ago
How Old Are the World’s Nuclear Reactors?
-

 Countries7 days ago
Mapped: World’s Top 40 Largest Military Budgets
-

 Markets3 weeks ago
How Big is the Market for Crude Oil?