History
The Top 10 Largest Nuclear Explosions, Visualized


The Top 10 Largest Nuclear Explosions, Visualized
Just how powerful are nuclear explosions?
The U.S.’ Trinity test in 1945, the first-ever nuclear detonation, released around 19 kilotons of explosive energy. The explosion instantly vaporized the tower it stood on and turned the surrounding sand into green glass, before sending a powerful heatwave across the desert.
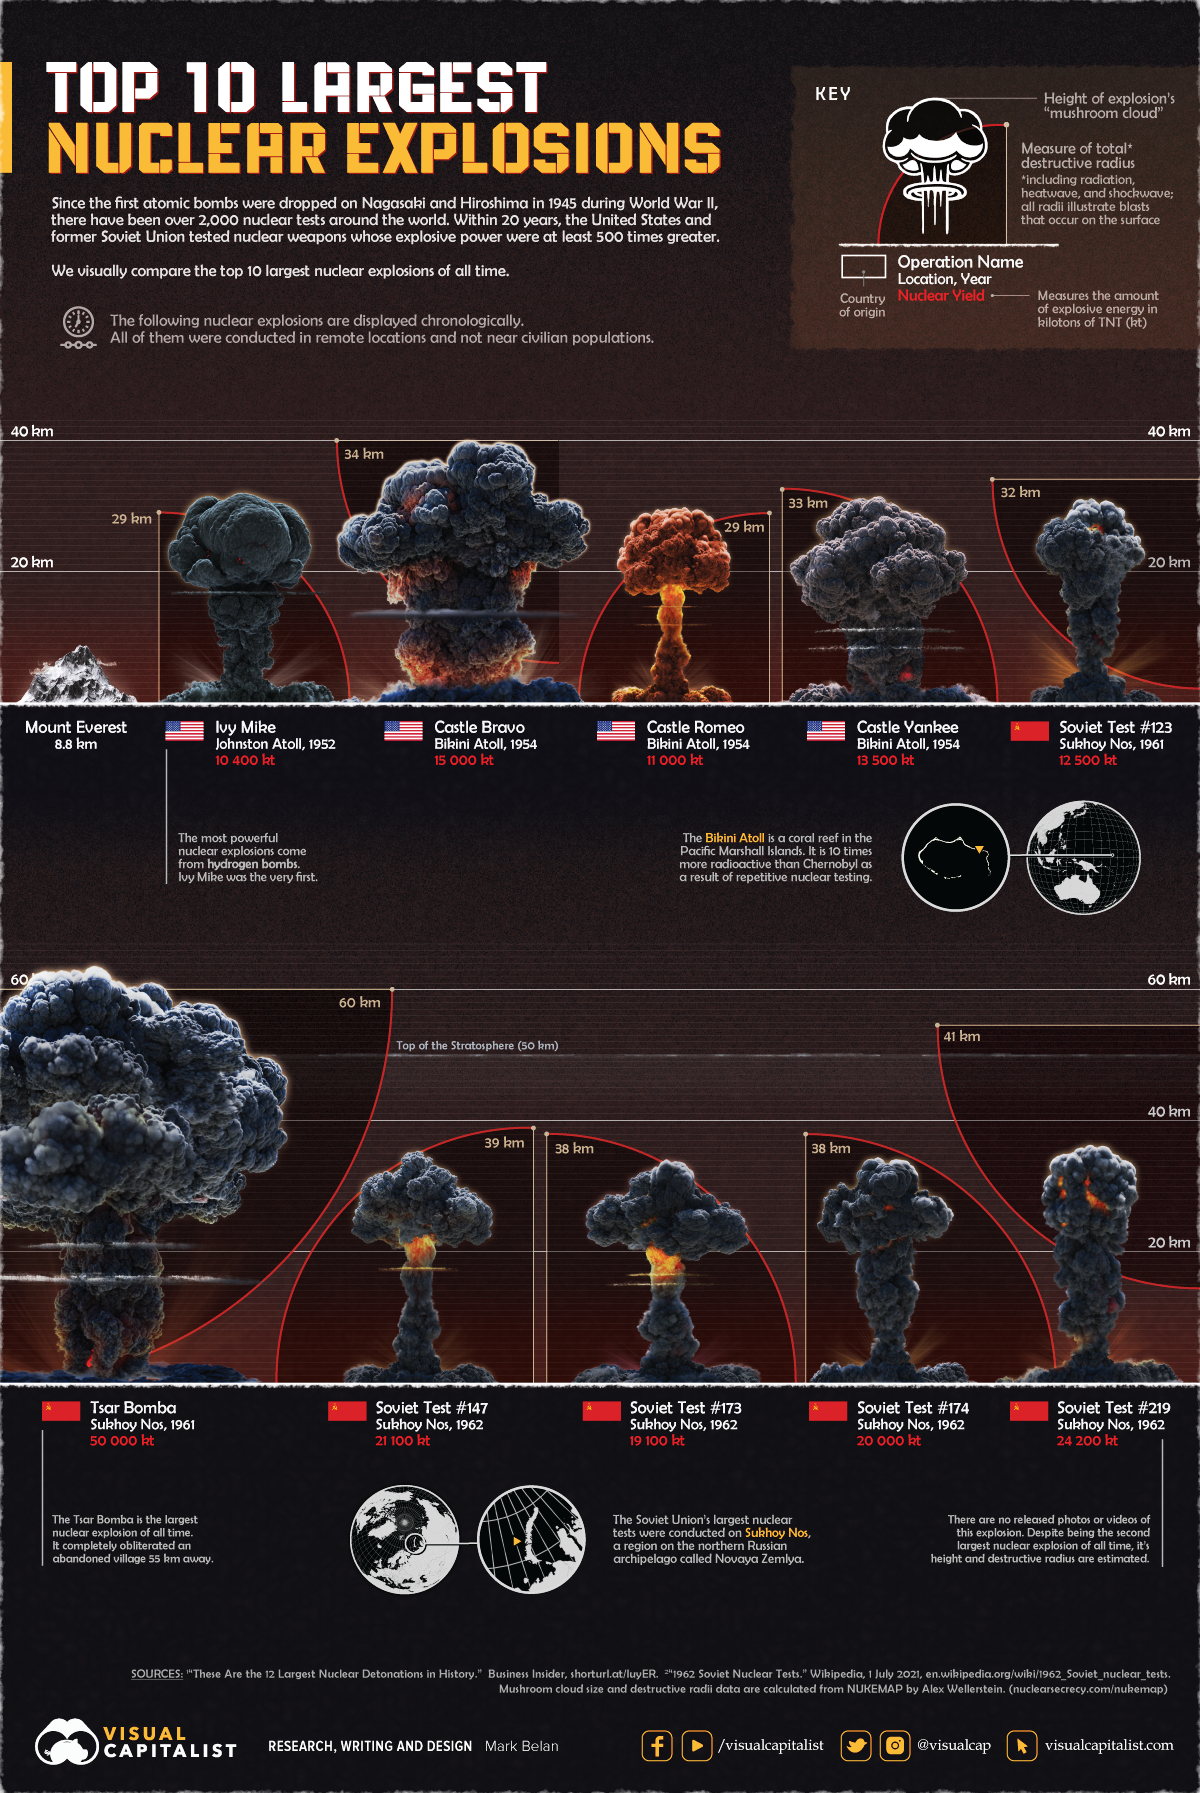
As the Cold War escalated in the years after WWII, the U.S. and the Soviet Union tested bombs that were at least 500 times greater in explosive power. This infographic visually compares the 10 largest nuclear explosions in history.
The Anatomy of a Nuclear Explosion
After exploding, nuclear bombs create giant fireballs that generate a blinding flash and a searing heatwave. The fireball engulfs the surrounding air, getting larger as it rises like a hot air balloon.
As the fireball and heated air rise, they are flattened by cooler, denser air high up in the atmosphere, creating the mushroom “cap” structure. At the base of the cloud, the fireball causes physical destruction by sending a shockwave moving outwards at thousands of miles an hour.
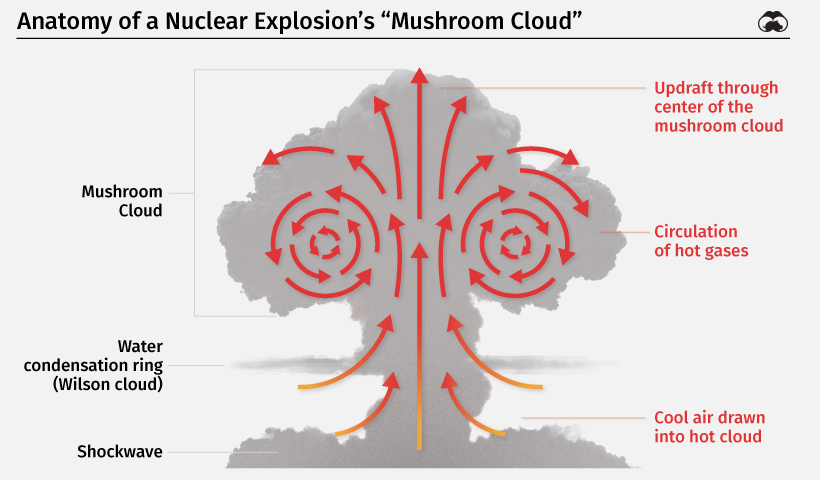
A strong updraft of air and dirt particles through the center of the cloud forms the “stem” of the mushroom cloud. In most atomic explosions, changing atmospheric pressure and water condensation create rings that surround the cloud, also known as Wilson clouds.
Over time, the mushroom cloud dissipates. However, it leaves behind radioactive fallout in the form of nuclear particles, debris, dust, and ash, causing lasting damage to the local environment. Because the particles are lightweight, global wind patterns often distribute them far beyond the place of detonation.
With this context in mind, here’s a look at the 10 largest nuclear explosions.
#10: Ivy Mike (1952)
In 1952, the U.S. detonated the Mike device—the first-ever hydrogen bomb—as part of Operation Ivy. Hydrogen bombs rely on nuclear fusion to amplify their explosions, producing much more explosive energy than atomic bombs that use nuclear fission.
Weighing 140,000 pounds (63,500kg), the Ivy Mike test generated a yield of 10,400 kilotons, equivalent to the explosive power of 10.4 million tons of TNT. The explosion was 700 times more powerful than Little Boy, the bomb dropped on Hiroshima in 1945.
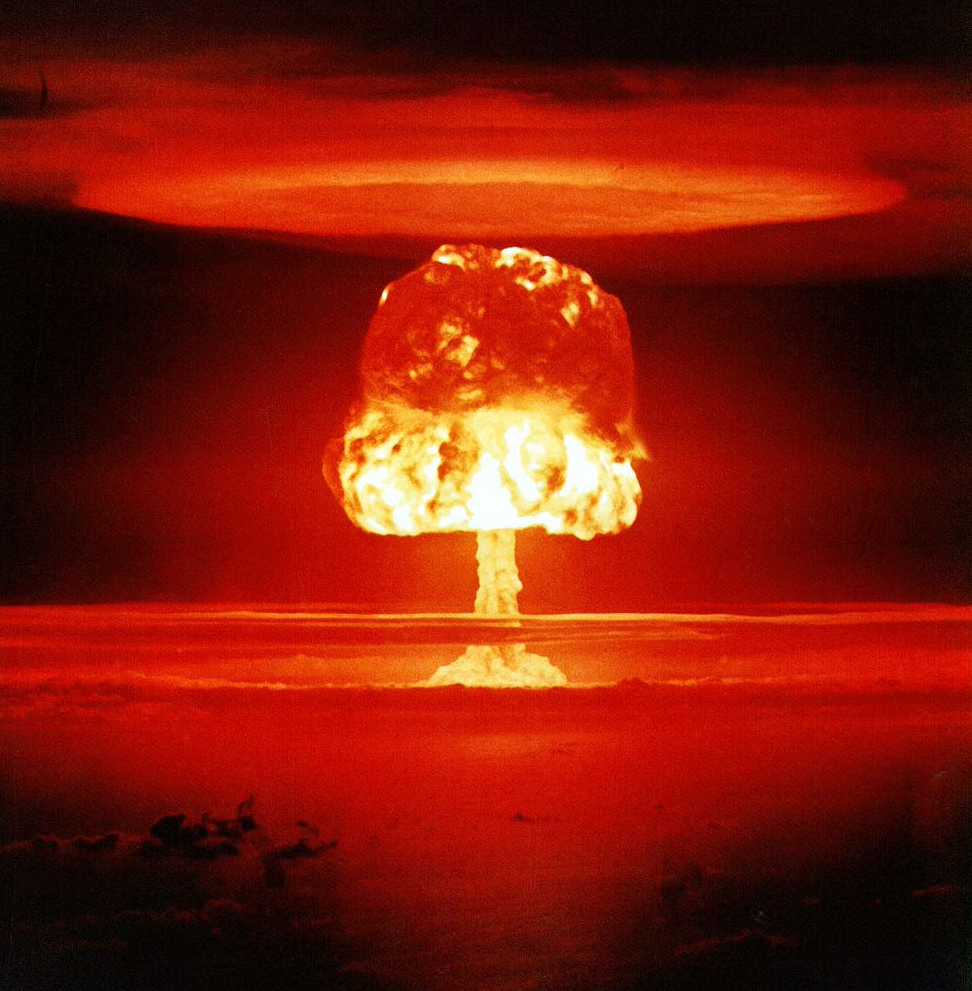
#9: Castle Romeo (1954)
Castle Romeo was part of the Operation Castle series of U.S. nuclear tests taking place on the Marshall Islands. Shockingly, the U.S. was running out of islands to conduct tests, making Romeo the first-ever test conducted on a barge in the ocean.
At 11,000 kilotons, the test produced more than double its predicted explosive energy of 4,000 kilotons. Its fireball, as seen below, is one of the most iconic images ever captured of a nuclear explosion.
#8: Soviet Test #123 (1961)
Test #123 was one of the 57 tests conducted by the Soviet Union in 1961. Most of these tests were conducted on the Novaya Zemlya archipelago in Northwestern Russia. The bomb yielded 12,500 kilotons of explosive energy, enough to vaporize everything within a 2.1 mile (3.5km) radius.
#7: Castle Yankee (1954)
Castle Yankee was the fifth test in Operation Castle. The explosion marked the second-most powerful nuclear test by the U.S.
It yielded 13,500 kilotons, much higher than the predicted yield of up to 10,000 kilotons. Within four days of the blast, its fallout reached Mexico City, roughly 7,100 miles (11,400km) away.
#6: Castle Bravo (1954)
Castle Bravo, the first of the Castle Operation series, accidentally became the most powerful nuclear bomb tested by the U.S.
Due to a design error, the explosive energy from the bomb reached 15,000 kilotons, two and a half times what was expected. The mushroom cloud climbed up to roughly 25 miles (40km).
As a result of the test, an area of 7,000 square miles was contaminated, and inhabitants of nearby atolls were exposed to high levels of radioactive fallout. Traces of the blast were found in Australia, India, Japan, and Europe.
#5, #4, #3: Soviet Tests #173, #174, #147 (1962)
In 1962, the Soviet Union conducted 78 nuclear tests, three of which produced the fifth, fourth, and third-most powerful explosions in history. Tests #173, #174, and #147 each yielded around 20,000 kilotons. Due to the absolute secrecy of these tests, no photos or videos have been released.
#2: Soviet Test #219 (1962)
Test #219 was an atmospheric nuclear test carried out using an intercontinental ballistic missile (ICBM), with the bomb exploding at a height of 2.3 miles (3.8km) above sea level. It was the second-most powerful nuclear explosion, with a yield of 24,200 kilotons and a destructive radius of ~25 miles (41km).
#1: Tsar Bomba (1961)
Tsar Bomba, also called Big Ivan, needed a specially designed plane because it was too heavy to carry on conventional aircraft. The bomb was attached to a giant parachute to give the plane time to fly away.
The explosion, yielding 50,000 kilotons, obliterated an abandoned village 34 miles (55km) away and generated a 5.0-5.25 magnitude earthquake in the surrounding region. Initially, it was designed as a 100,000 kiloton bomb, but its yield was cut to half its potential by the Soviet Union. Tsar Bomba’s mushroom cloud breached through the stratosphere to reach a height of over 37 miles (60km), roughly six times the flying height of commercial aircraft.
The two bombs dropped on Hiroshima and Nagasaki had devastating consequences, and their explosive yields were only a fraction of the 10 largest explosions. The power of modern nuclear weapons makes their scale of destruction truly unfathomable, and as history suggests, the outcomes can be unpredictable.


Maps
Vintage Viz: The World’s Rivers and Lakes, Organized Neatly
Rivers and lakes have played important roles throughout history. This Vintage Viz looks at these bodies of water from the viewpoint of 1850.
Vintage Viz: The World’s Rivers and Lakes, Organized Neatly
Rivers and lakes have borne witness to many of humanity’s greatest moments.
In the first century BCE, the Rubicon not only marked the border between the Roman provinces of Gaul and Italia, but also the threshold for civil war. From the shores of Lake Van in 1071, you could witness the Battle of Manzikert and the beginning of the end for the Byzantine Empire.
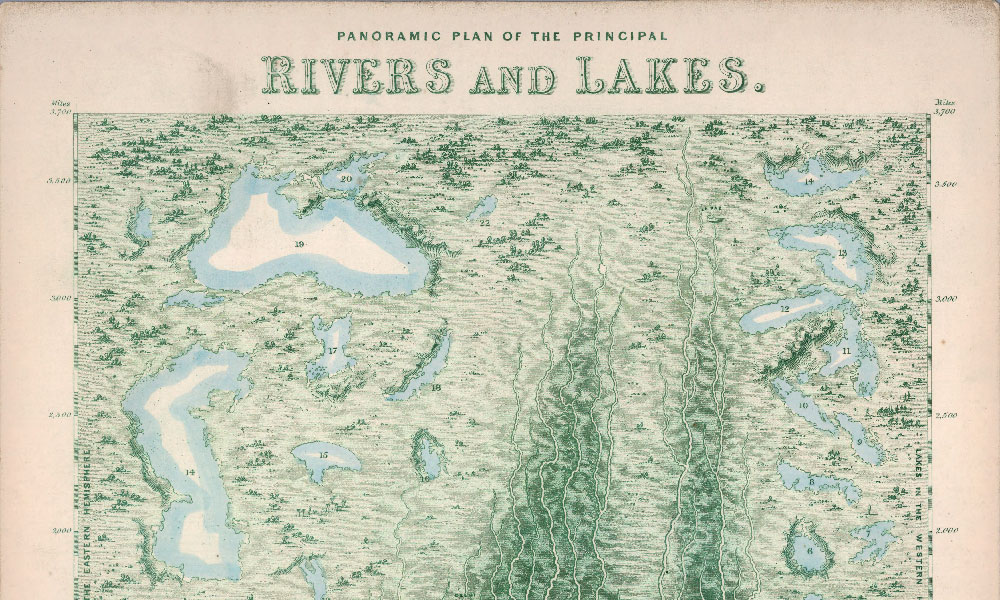
Rivers carry our trade, our dead, and even our prayers, so when London mapmaker James Reynolds partnered with engraver John Emslie to publish the Panoramic Plan of the Principal Rivers and Lakes in 1850, he could be sure of a warm reception.
The visualization, the latest in our Vintage Viz series, beautifully illustrates 42 principal rivers in Europe, Asia, Africa, and the Americas, along with 36 lakes across the Eastern and Western hemispheres. Each river has been unraveled and straightened onto an imaginary landscape-–no meandering here—and arranged by size. Major cities are marked by a deep orangy-red.
Top 3 Longest Principal Rivers (in 1850)
According to this visualization, the Mighty Mississippi is among the world’s longest, coming in at 3,650 miles, followed by the Amazon, the Nile, and the Yangtze river in China. The bottom three are the Tay in Scotland (125 miles), the Shannon in Ireland (200 miles), and the Potomac in the U.S. (275 miles).
Surveying methods have come a long way since 1850, and we now have satellites, GPS, and lasers, so we can update these rankings. According to the CIA World Factbook, the Nile (6,650 km / 4,132 miles), the Amazon (6,436 km / 3,998 miles), and the Yangtze (6,300 km / 3,915 miles) are the world’s top three longest rivers.
The table below shows the rivers in the graphic above compared with today’s measurements, as well as the general location of rivers using 1850 location names (including modern day locations in brackets).
| River | Territory | Viz length (miles) | Modern length (miles) |
|---|---|---|---|
| Mississippi | United States | 3,650 | 2,340 |
| Amazon | Brazil | 3,350 | 3,998 |
| Nile | Egypt and Abyssinia (Ethiopia) | 3,325 | 4,132 |
| Yangtse | China | 3,300 | 3,915 |
| Hoang-ho | China | 3,025 | 3,395 |
| Obi | Siberia | 2,800 | 2,268 |
| La Plata | La Plata (Argentina/Uruguay) | 2,450 | 3,030 |
| Volga | Russia | 2,200 | 2,193 |
| Burrampoota | Tibet | 2,200 | 1,800 |
| Ganges | Hindostan (India) | 1,975 | 1,569 |
| Euphrates | A(siatic) Turkey | 1,850 | 1,740 |
| Danube | Germany | 1,800 | 1,770 |
| Niger | Nigeria | 1,750 | 2,600 |
| Indus | Caubul etc (Afghanistan etc) | 1,700 | 1,988 |
| McKenzie | Indian Territory (Canada) | 1,600 | 1,080 |
| Senegal | Senegambia (Senegal) | 1,450 | 1,020 |
| Dnieper | Russia | 1,375 | 1,367 |
| Oronoco | Gran Colombia (Venezuela) | 1,325 | 1,700 |
| Gambia | Senegambia (The Gambia) | 1,300 | 740 |
| Bravo del Norta (Rio Grande) | Mexico | 1,150 | 1,900 |
| St. Lawrence | Canada | 1,125 | 1,900 |
| Orange | Namaqualand (Namibia/South Africa) | 1,100 | 1,367 |
| Dwina | Russia | 1,000 | 1,020 |
| Don | Russia | 975 | 1,198 |
| Rhine | Germany | 850 | 766 |
| Elbe | Germany | 750 | 724 |
| Vistula | Poland | 650 | 651 |
| Oder | Prussia (Germany) | 625 | 529 |
| Colorando | La Plato (United States) | 600 | 1,450 |
| Tague | Spain and Portugal | 575 | 626 |
| Susquehana | United States | 575 | 464 |
| Rhone | France | 550 | 505 |
| Seine | France | 475 | 485 |
| Po | North Italy | 450 | 405 |
| Hudson | United States | 425 | 315 |
| Ebro | Spain | 400 | 565 |
| Severn | England | 350 | 220 |
| Delaware | United States | 325 | 301 |
| Potomac | United States | 275 | 405 |
| Thames | England | 275 | 215 |
| Shannon | Ireland | 200 | 224 |
| Tay | Scotland | 125 | 117 |
These figures are a unique look into a time period where humanity’s efforts to quantify the world were still very much a work in progress.
Editor’s note: Some of the rivers and lakes are spelled slightly differently in 1850 than they are today. For example, the map notes today’s Mackenzie River (Canada) as the McKenzie River, and the Yangtze River (China) as the Yangtse.
O Say, Can You Sea?
The largest ‘lake’ in this visualization is the Caspian Sea (118,000 sq. miles), followed by the Black Sea (113,000 sq. miles), and the greatest of the Great Lakes, Lake Superior (22,400 sq. miles). While the Caspian Sea is considered a saltwater lake and could reasonably have a place here, the Black Sea—possibly bearing that name because of the color black’s association with “north”—is not a lake by any stretch of the imagination.
And while many of the surface areas reported could also be updated with modern estimates, the story behind Lake Chad (called Ichad in the visualization), the Aral Sea, and the Dead Sea are altogether different. Human development, unsustainable water use, and climate change have led to dramatic drops in water levels.
The Dead Sea in particular had a surface area of 405 sq. miles (1,050 km2) in 1930, but has since dropped to 234 sq. miles (606.1 km2) in 2016.
| Lake | Territory | Viz surface area (sq. miles) | Modern surface area (sq. miles) |
|---|---|---|---|
| Caspian Sea | Russia | 118,000 | 143,000 |
| Black Sea | Turkey | 113,000 | 168,500 |
| Superior | North America | 22,400 | 31,700 |
| Huron | North America | 15,800 | 23,007 |
| Michigan | North America | 12,600 | 22,404 |
| Great Slave | North America | 12,000 | 10,500 |
| Aral Sea | Tartary (Central Eurasia) | 11,650 | 6,900 |
| Ichad | Africa | 11,600 | 590 |
| Azov | Russia | 8,800 | 14,500 |
| Baikal Sea | Siberia | 8,000 | 12,248 |
| Winnepeg | North America | 7,200 | 9,416 |
| Maracaibo | South America | 6,000 | 5,130 |
| Titicaca | South America | 5,400 | 3,030 |
| Ladoga | Russia | 5,200 | 6,700 |
| Balkash | Mongolia | 5,200 | 7,000 |
| Erie | North America | 4,800 | 9,910 |
| Ontario | North America | 4,450 | 7,340 |
| Great Bear | North America | 4,000 | 12,028 |
| Orega | Russia | 3,300 | 3,700 |
| Athabasca | North America | 3,200 | 3,030 |
| Nicaragua | North America | 2,905 | 3,149 |
| Otehenantekane | North America | 2,500 | 2,500 |
| Wener | Sweden | 2,100 | 2,181 |
| Winnepagos | North America | 2,000 | 2,070 |
| Zaizan | Mongolia | 1,600 | 700 |
| Dembia | Abyssinia (Ethiopia) | 1,300 | 1,418 |
| Tonting | China | 1,200 | 1,090 |
| Wetter | Sweden | 945 | 738 |
| Orebo | Sweden | 900 | 186 |
| Ouroomia | Persia | 900 | 1,126 |
| Enare | Lapland (Finland) | 870 | 1,040 |
| Constance | Scotland | 456 | 209 |
| Geneva | Swtizerland | 400 | 224 |
| Dead Sea | Syria | 370 | 605 |
| Lough Neagh | Ireland | 80 | 153 |
| Loch Lomond | Scotland | 27 | 27 |
You Can’t Step in the Same River Twice
Over time, natural and anthropogenic forces cause rivers to change their course, and lakes to shift their banks. If Reynolds and Emslie were alive today to update this visualization, it would likely look quite different, as would one made 100 years from now. But so goes the river of time.

-

 Markets2 weeks ago
Ranked: The Most Profitable U.S. Companies, by Sector
-

 apps5 days ago
How Long it Took for Popular Apps to Reach 100 Million Users
-

 Markets4 weeks ago
The World’s Biggest Mutual Fund and ETF Providers
-

 Brands2 weeks ago
Brand Reputations: Ranking the Best and Worst in 2023
-

 Environment5 days ago
Hotter Than Ever: 2023 Sets New Global Temperature Records
-

 Datastream4 weeks ago
Can You Calculate Your Daily Carbon Footprint?
-

 Energy2 weeks ago
Who’s Still Buying Russian Fossil Fuels in 2023?
-

 VC+4 days ago
What’s New on VC+ in July