Demographics
The Problem of an Aging Global Population, Shown by Country
The Implications of an Aging Population
The world is experiencing a seismic demographic shift—and no country is immune to the consequences.
While increasing life expectancy and declining birth rates are considered major achievements in modern science and healthcare, they will have a significant impact on future generations.
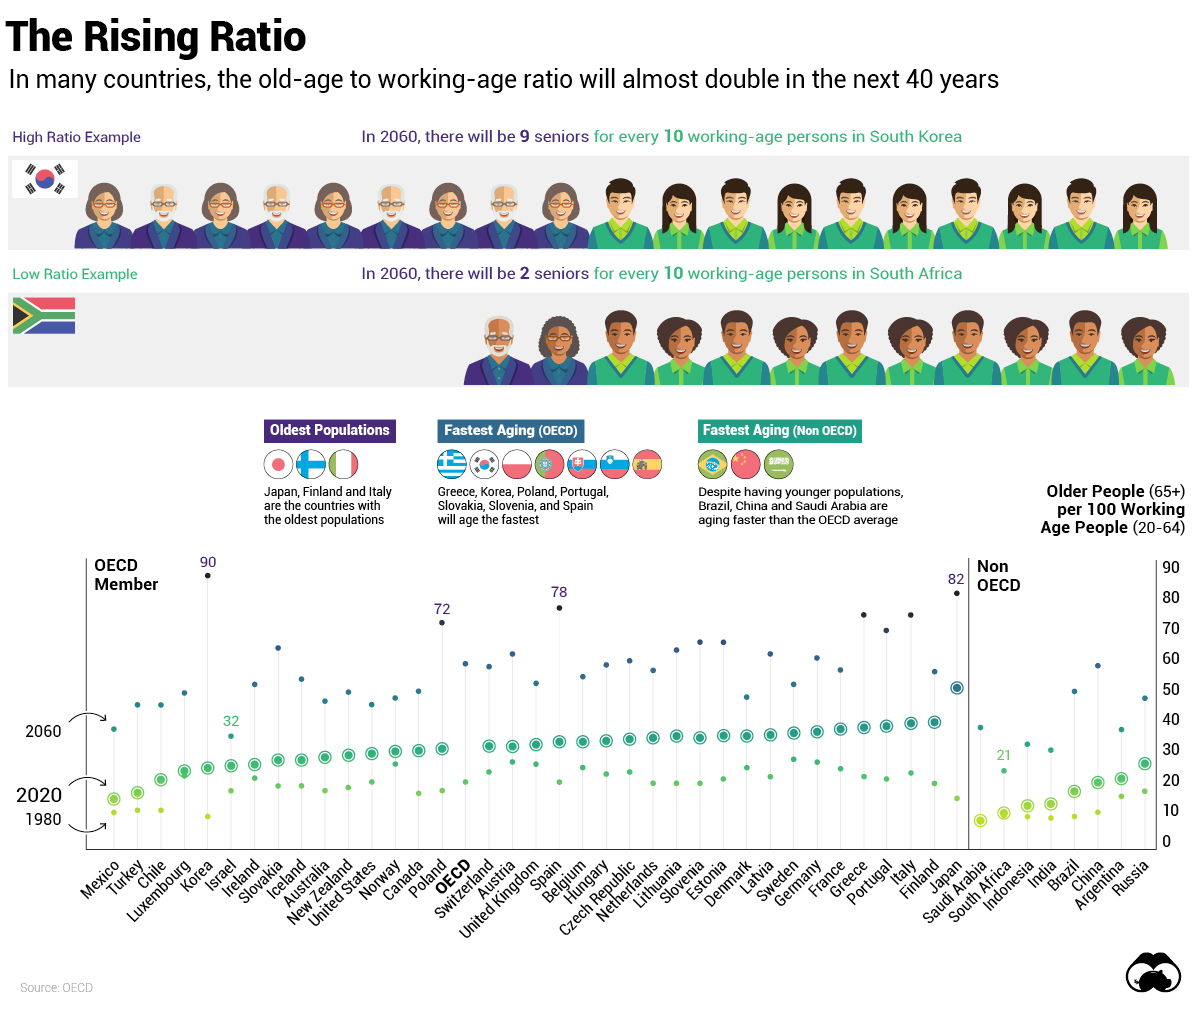
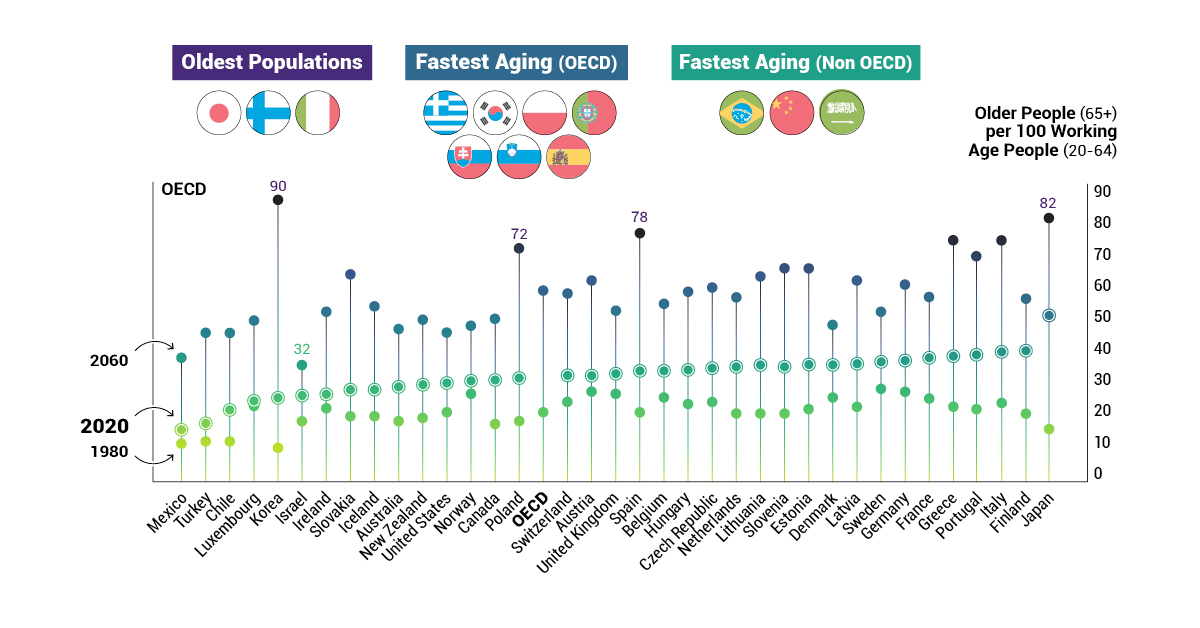
Today’s graphic relies on OECD data to demonstrate how the old-age to working-age ratio will change by 2060, highlighting some of the world’s fastest aging countries.
The Demographic Debacle
By 2050, there will be 10 billion people on earth, compared to 7.7 billion today—and many of them will be living longer. As a result, the number of elderly people per 100 working-age people will nearly triple—from 20 in 1980, to 58 in 2060.
Populations are getting older in all OECD countries, yet there are clear differences in the pace of aging. For instance, Japan holds the title for having the oldest population, with ⅓ of its citizens already over the age of 65. By 2030, the country’s workforce is expected to fall by 8 million—leading to a major potential labor shortage.
In another example, while South Korea currently boasts a younger than average population, it will age rapidly and end up with the highest old-to-young ratio among developed countries.
A Declining Workforce
Globally, the working-age population will see a 10% decrease by 2060. It will fall the most drastically by 35% or more in Greece, Japan, Korea, Latvia, Lithuania, and Poland. On the other end of the scale, it will increase by more than 20% in Australia, Mexico, and Israel.
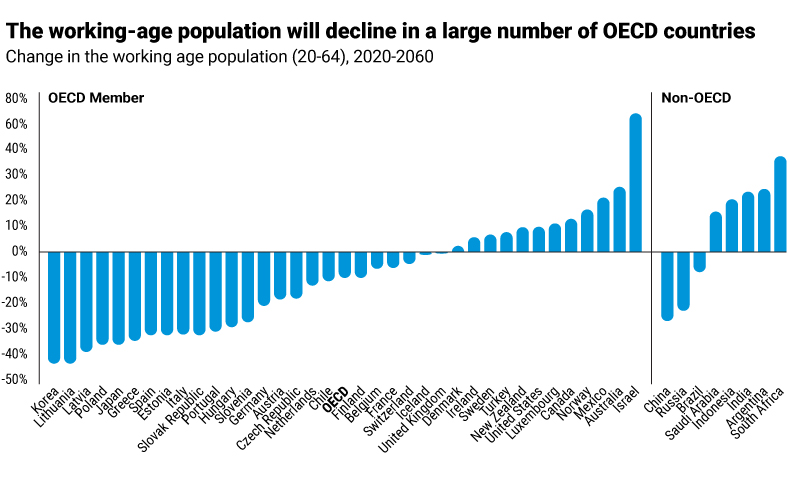
Israel’s notably higher increase of 67% is due to the country’s high fertility rate, which is comparable to “baby boom” numbers seen in the U.S. following the second World War.
As countries prepare for the coming decades, workforce shortages are just one of the impacts of aging populations already being felt.
Managing the Risks
There are many other social and economic risks that we can come to expect as the global population continues to age:
- The Squeezed Middle: With more people claiming pension benefits but less people paying income taxes, the shrinking workforce may be forced to pay higher taxes.
- Rising Healthcare Costs: Longer lives do not necessarily mean healthier lives, with those over 65 more likely to have at least one chronic disease and require expensive, long-term care.
- Economic Slowdown: Changing workforces may lead capital to flow away from rapidly aging countries to younger countries, shifting the global distribution of economic power.
The strain on pension systems is perhaps the most evident sign of a drastically aging population. Although the average retirement age is gradually increasing in many countries, people are saving insufficiently for their increased life span—resulting in an estimated $400 trillion deficit by 2050.
Pensions Under Pressure
A pension is promised, but not necessarily guaranteed. Any changes made to existing government programs can alter the lives of future retirees entirely—but effective pension reforms that lessen the growing deficit are required urgently.
Towards a Better System
Certain countries are making great strides towards more sustainable pension systems, and the Global Pension Index suggests initiatives that governments can take into consideration, such as:
- Continuing to increase the age of retirement
- Increasing the level of savings—both inside and outside pension funds
- Increasing the coverage of private pensions across the labor force, including self-employed and contract employees, to provide improved integration between various pillars
- Preserving retirement funds by limiting the access to benefits before the retirement age
- Increasing the trust and confidence of all stakeholders by improving transparency of pension plans
Although 59% of employees are expecting to continue earning well into their retirement years, providing people with better incentives and options to make working at an older age easier could be crucial for ensuring continued economic growth.
Live Long and Prosper
As 2020 marks the beginning of the Decade of Healthy Ageing, the world is undoubtedly entering a pivotal period.
Countries all over the world face tremendous pressure to effectively manage their aging populations, but preparing for this demographic shift early will contribute to the economic advancement of countries, and allow populations—both young and old—to live long and prosper.


Politics
Mapped: World’s Top 40 Largest Military Budgets
War in Europe has caused Ukraine’s military spend to jump up by 640%. How do the world’s largest military budgets compare?
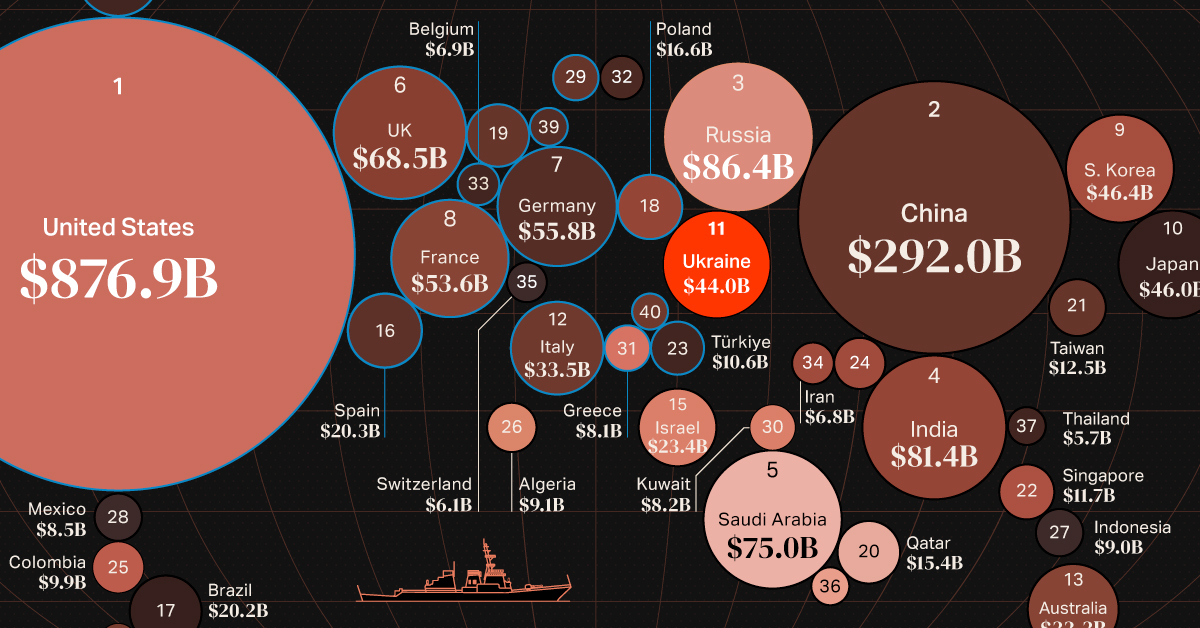
Mapped: World’s Top 40 Largest Military Budgets
In the final year of World War II, the U.S. spent about 38% of its GDP on its military. When adjusted for inflation, the military budget over those four years of war came to a staggering $4.1 trillion in 2020 dollars.
Almost 80 years later, modern day military spending isn’t much of a far cry from World War II budgets. The top spenders have continued to increase their military capabilities, while war in Ukraine has caused countries in the region to re-evaluate their budgets as well.
In 2022, global military budgets hit an all-time high of $2.2 trillion, according to data released by Stockholm International Peace Research Institute (SIPRI), the eighth consecutive year of increase. This post looks at the top 40 largest military budgets in the world.
The Largest Military Budgets in 2022
The United States accounts for almost 40% of global military expenditures, with its 2022 spend coming to $877 billion.
Here are the top 40 largest military budgets in the world for 2022 in U.S. dollars:
| Rank | Country | Military Budget (Billions) | % of World Military Spend |
|---|---|---|---|
| 1 | 🇺🇸 U.S. | $876.9 | 39.0% |
| 2 | 🇨🇳 China | $292.0 | 13.0% |
| 3 | 🇷🇺 Russia | $86.4 | 3.9% |
| 4 | 🇮🇳 India | $81.4 | 3.6% |
| 5 | 🇸🇦 Saudi Arabia | $75.0 | 3.3% |
| 6 | 🇬🇧 UK | $68.5 | 3.1% |
| 7 | 🇩🇪 Germany | $55.8 | 2.5% |
| 8 | 🇫🇷 France | $53.6 | 2.4% |
| 9 | 🇰🇷 South Korea | $46.4 | 2.1% |
| 10 | 🇯🇵 Japan | $46.0 | 2.1% |
| 11 | 🇺🇦 Ukraine | $44.0 | 2.0% |
| 12 | 🇮🇹 Italy | $33.5 | 1.5% |
| 13 | 🇦🇺 Australia | $32.3 | 1.4% |
| 14 | 🇨🇦 Canada | $26.9 | 1.2% |
| 15 | 🇮🇱 Israel | $23.4 | 1.0% |
| 16 | 🇪🇸 Spain | $20.3 | 0.9% |
| 17 | 🇧🇷 Brazil | $20.2 | 0.9% |
| 18 | 🇵🇱 Poland | $16.6 | 0.7% |
| 19 | 🇳🇱 Netherlands | $15.6 | 0.7% |
| 20 | 🇶🇦 Qatar | $15.4 | 0.7% |
| 21 | 🇹🇼 Taiwan | $12.5 | 0.6% |
| 22 | 🇸🇬 Singapore | $11.7 | 0.5% |
| 23 | 🇹🇷 Türkiye | $10.6 | 0.5% |
| 24 | 🇵🇰 Pakistan | $10.3 | 0.5% |
| 25 | 🇨🇴 Colombia | $9.9 | 0.4% |
| 26 | 🇩🇿 Algeria | $9.1 | 0.4% |
| 27 | 🇮🇩 Indonesia | $9.0 | 0.4% |
| 28 | 🇲🇽 Mexico | $8.5 | 0.4% |
| 29 | 🇳🇴 Norway | $8.4 | 0.4% |
| 30 | 🇰🇼 Kuwait | $8.2 | 0.4% |
| 31 | 🇬🇷 Greece | $8.1 | 0.4% |
| 32 | 🇸🇪 Sweden | $7.7 | 0.3% |
| 33 | 🇧🇪 Belgium | $6.9 | 0.3% |
| 34 | 🇮🇷 Iran | $6.8 | 0.3% |
| 35 | 🇨🇭 Switzerland | $6.1 | 0.3% |
| 36 | 🇴🇲 Oman | $5.8 | 0.3% |
| 37 | 🇹🇭 Thailand | $5.7 | 0.3% |
| 38 | 🇨🇱 Chile | $5.6 | 0.2% |
| 39 | 🇩🇰 Denmark | $5.5 | 0.2% |
| 40 | 🇷🇴 Romania | $5.2 | 0.2% |
China, ranked second in absolute terms, accounts for another 13% of world military expenditure at $292 billion.
Russia, India and Saudi Arabia round out the top five biggest military budgets in 2022. Add in the UK to the mix (#6 rank), and these countries all had military expenditures that made up at least 3% of global spend.
Comparatively, the lowest budgets on the top 40 ranged include Romania at $5.2 billion, Denmark at $5.5 billion, and Chile at $5.6 billion. They each account for just 0.2% of the world’s military budgets in 2022, and of course there are many countries with even smaller spends.
Largest Military Budget Increases in 2022
Russia’s position as the third-largest military spender is a recent development, as the country’s military spend had a 9% increase between 2021 and 2022, according to SIPRI estimates.
On the other side of Russia’s invasion, Ukraine was the top 40 military budget with the largest annual increase in 2022, surging nearly six and a half times above its 2021 expenditures.
| Country | % Change (2021-2022) | Rank Change (2021-2022) |
|---|---|---|
| 🇺🇦 Ukraine | 640% | +25 |
| 🇶🇦 Qatar | 27% | +2 |
| 🇸🇦 Saudi Arabia | 16% | +3 |
| 🇧🇪 Belgium | 13% | 0 |
| 🇳🇱 Netherlands | 12% | 0 |
| 🇸🇪 Sweden | 12% | -1 |
| 🇵🇱 Poland | 11% | 0 |
| 🇷🇺 Russia | 9.2% | +2 |
| 🇩🇰 Denmark | 8.8% | +3 |
| 🇪🇸 Spain | 7.3% | -1 |
| 🇳🇴 Norway | 6.2% | 0 |
| 🇮🇳 India | 6.0% | -1 |
| 🇯🇵 Japan | 5.9% | -1 |
| 🇮🇷 Iran | 4.6% | +5 |
| 🇨🇳 China | 4.2% | 0 |
| 🇬🇧 UK | 3.7% | -2 |
| 🇨🇦 Canada | 3.0% | -1 |
| 🇸🇬 Singapore | 2.8% | +1 |
| 🇩🇪 Germany | 2.3% | 0 |
| 🇮🇩 Indonesia | 1.3% | 0 |
| 🇨🇴 Colombia | 1.1% | -1 |
| 🇺🇸 U.S. | 0.7% | 0 |
| 🇫🇷 France | 0.6% | -2 |
| 🇬🇷 Greece | 0.6% | -1 |
| 🇨🇭 Switzerland | 0.4% | -1 |
| 🇹🇼 Taiwan | 0.4% | -1 |
| 🇦🇺 Australia | 0.3% | -1 |
| 🇵🇰 Pakistan | -2.0% | -3 |
| 🇰🇷 South Korea | -2.5% | +1 |
| 🇷🇴 Romania | -2.6% | +1 |
| 🇴🇲 Oman | -3.0% | +1 |
| 🇩🇿 Algeria | -3.7% | -1 |
| 🇮🇱 Israel | -4.2% | -1 |
| 🇮🇹 Italy | -4.5% | -1 |
| 🇨🇱 Chile | -6.2% | -3 |
| 🇧🇷 Brazil | -7.9% | -1 |
| 🇲🇽 Mexico | -9.7% | 0 |
| 🇰🇼 Kuwait | -11% | -4 |
| 🇹🇭 Thailand | -11% | -5 |
| 🇹🇷 Türkiye | -26% | -6 |
Ukraine’s dramatic increase represents the highest single-year jump ever recorded by SIPRI, painting a vivid before-and-after picture of a nation engaged in conflict.
Although no other country comes close in matching Ukraine’s surge in defense spending, Qatar saw a substantial increase of 27% over the last year, marking a continuing trend over the last decade of significantly bolstering its military.
Additionally, Saudi Arabia, along with four European nations (Belgium, the Netherlands, Sweden, and Poland), have registered year-over-year changes of over 10%.
On the flipside, 13 of the nations with the largest military budgets decreased spend from 2021, including top 15 spenders such as South Korea, Italy, and Israel.
The largest drop was seen by Türkiye, with an estimated 26% reduction in military budget. This drop may be linked to Türkiye’s inflation problem, which saw prices rise 72.3% in 2022—effectively decreasing the purchasing power of their currency in relative terms to other nations.
The Specter of War in Europe
With an ongoing conflict in the region and large financial powerhouses, its no surprise that eight of the top 10 countries with the most significant increases in military spending are located in Europe.
Consequently, European military budgets have reached levels not witnessed since the end of the Cold War.
And amid escalating geopolitical concerns, countries in Asia such as India, Japan, and China have also ramped up their defense spending. This is an indication of simmering global flashpoints such as India and China’s border skirmishes, the longstanding South China Sea territorial conflict, and concerns surrounding Taiwan’s sovereignty.
Source: Stockholm International Peace Research Institute (SIPRI).
Data note: SIPRI’s military expenditure data collection began in 1949, thus its records do not account for all expenditure that occurred during both World Wars.
Please see SIPRI’s methodologies page for more details on how they collect their data and create estimates.
-

 Energy3 weeks ago
How Big is the Market for Crude Oil?
-

 Maps7 days ago
Mapped: The Safest Cities in the U.S.
-

 Markets2 weeks ago
Ranked: The Most Profitable U.S. Companies, by Sector
-

 apps5 days ago
How Long it Took for Popular Apps to Reach 100 Million Users
-

 Markets4 weeks ago
The World’s Biggest Mutual Fund and ETF Providers
-

 Markets2 weeks ago
Brand Reputations: Ranking the Best and Worst in 2023
-

 Environment5 days ago
Hotter Than Ever: 2023 Sets New Global Temperature Records
-

 Datastream4 weeks ago
Can You Calculate Your Daily Carbon Footprint?