Science
Visualizing The Most Widespread Blood Types in Every Country
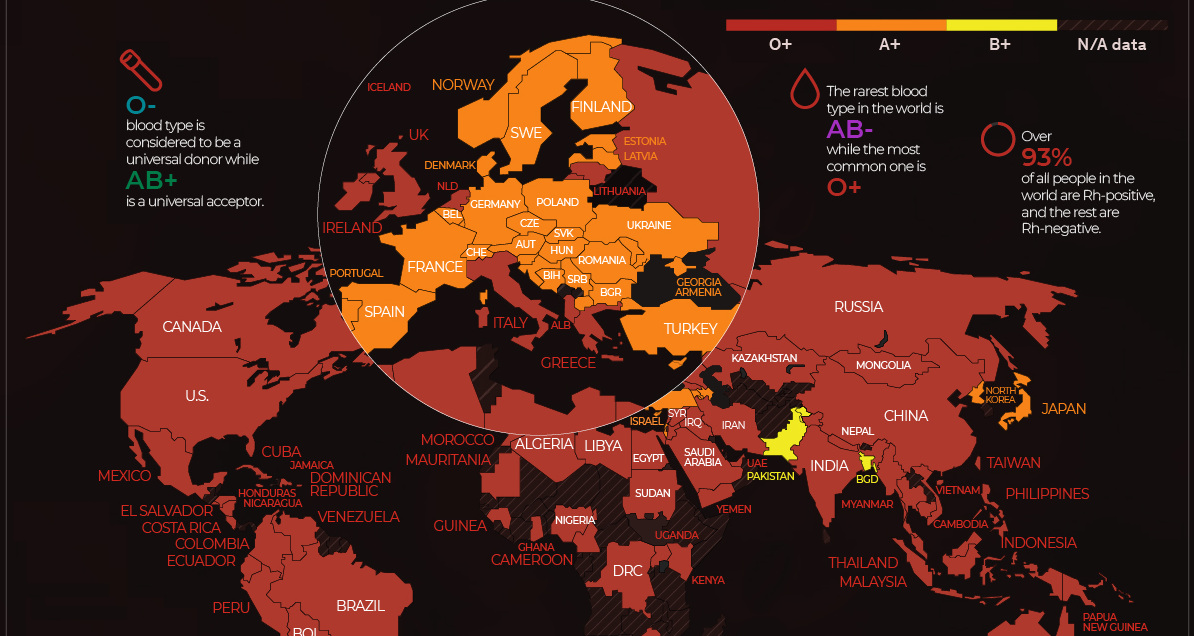
View the full-size infographic map
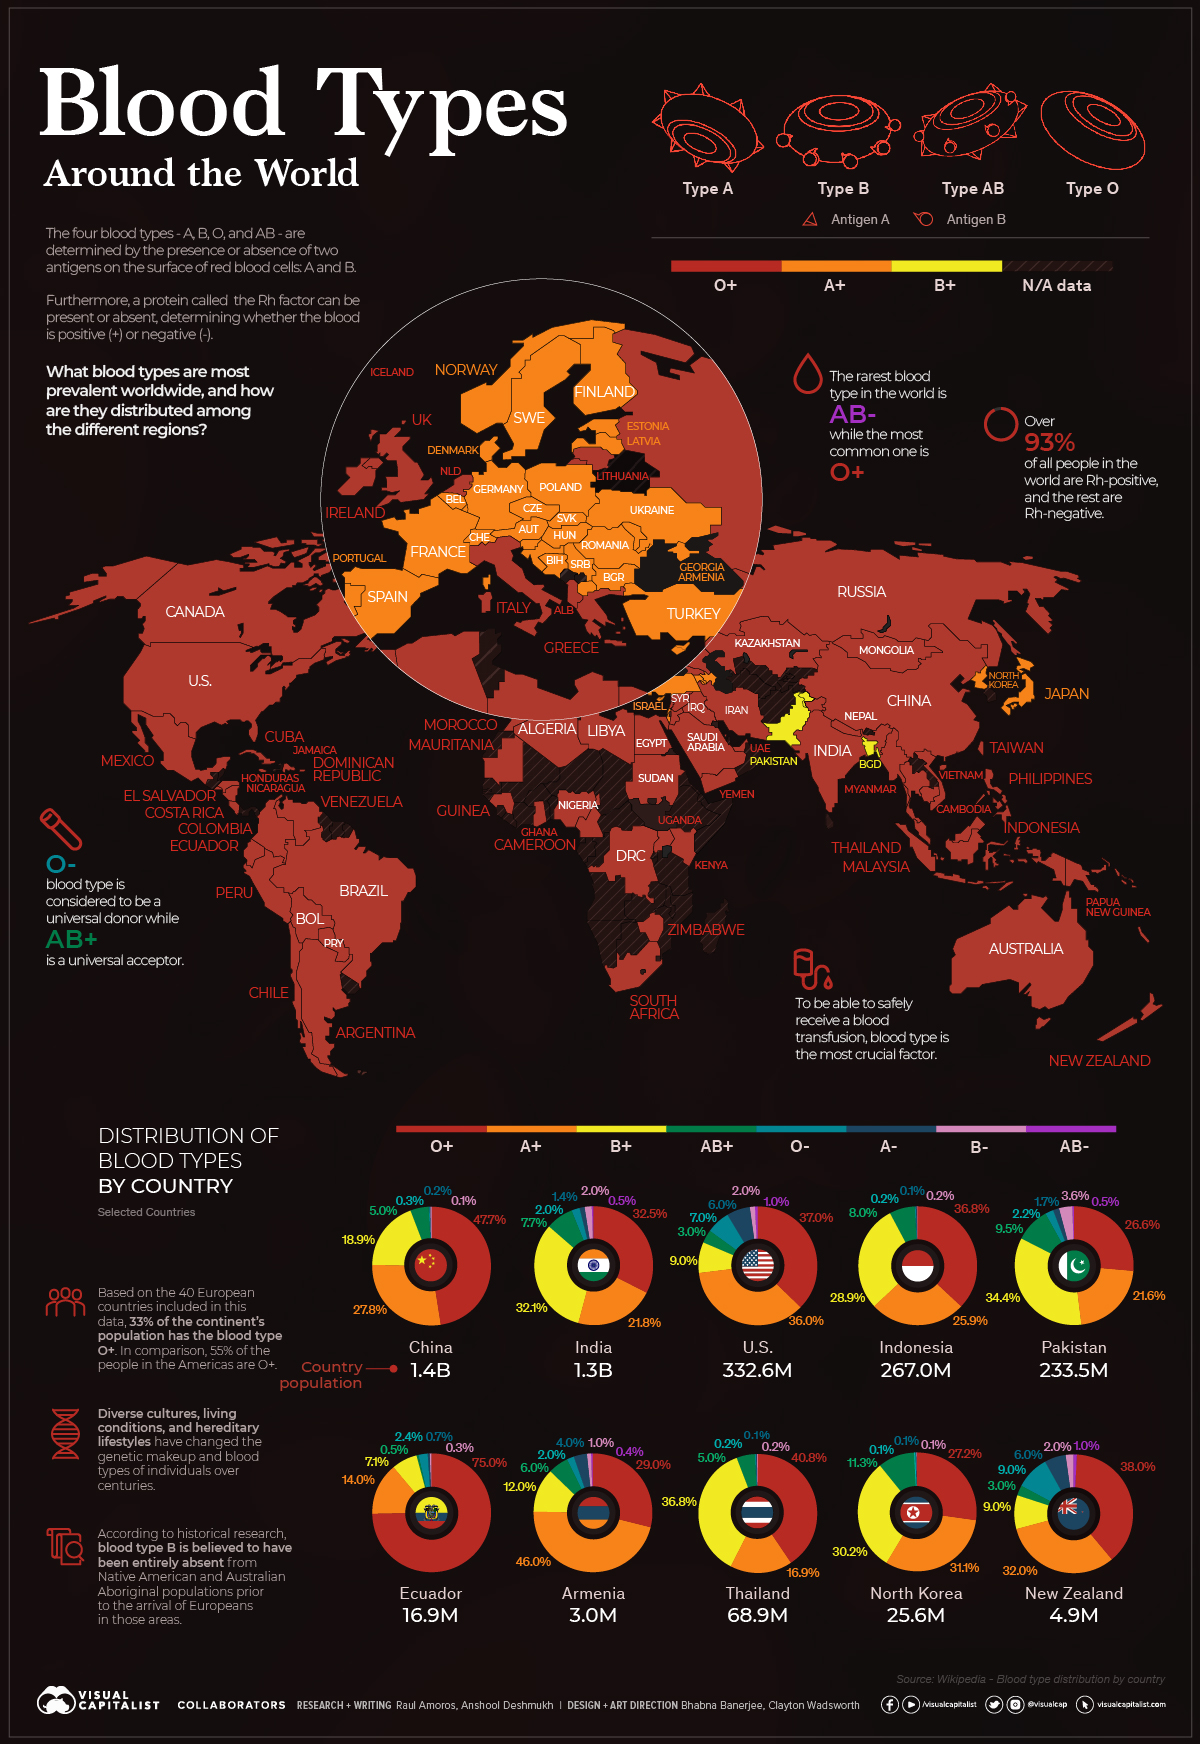


The Most Widespread Blood Types, by Country
Blood is essential to the human body’s functioning. It dispenses crucial nutrients throughout the body, exchanges oxygen and carbon dioxide, and carries our immune system’s “militia” of white blood cells and antibodies to stave off infections.
But not all blood is the same. The antigens in one’s blood determine their blood type classification: There are eight common blood type groups, and with different combinations of antigens and classifications, 36 human blood type groups in total.
Using data sourced from Wikipedia, we can map the most widespread blood types across the globe.
Overall Distribution of Blood Types
Of the 7.9 billion people living in the world, spread across 195 countries and 7 continents, the most common blood type is O+, with over 39% of the world’s population falling under this classification. The rarest, meanwhile, is AB-, with only 0.40% of the population having this particular blood type.
Breaking it down to the national level, these statistics begin to change. Since different genetic factors play a part in determining an individual’s blood type, every country and region tells a different story about its people.
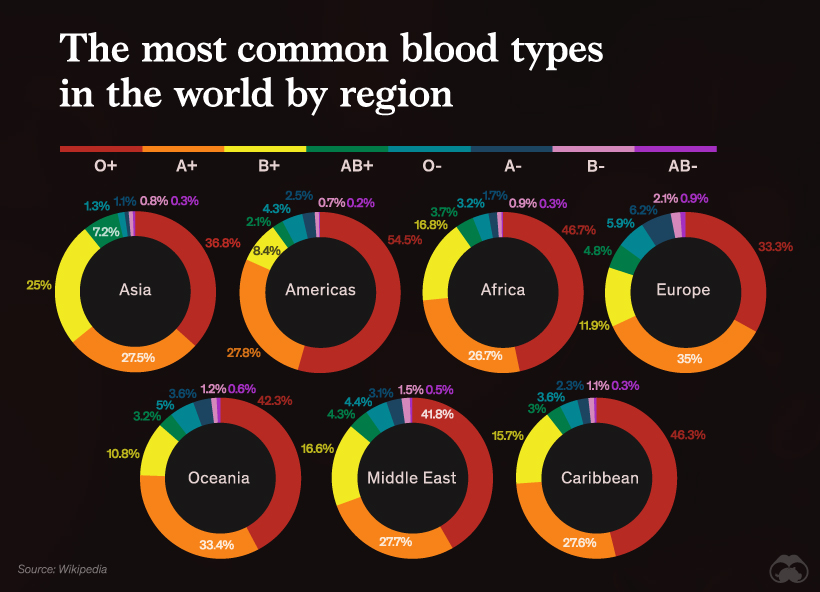
Regional Distribution of Blood Types
Asia
Even though O+ remains the most common blood type here, blood type B is relatively common too. Nearly 20% of China’s population has this blood type, and it is also fairly common in India and other Central Asian countries.
Comparatively, in some West Asian countries like Armenia and Azerbaijan, the population with blood type A+ outweighs any others.
Americas
The O blood type is the most common globally and is carried by nearly 70% of South Americans. It is also the most common blood type in Canada and the United States.
Here is a breakdown of the most common blood types in the U.S. by race:
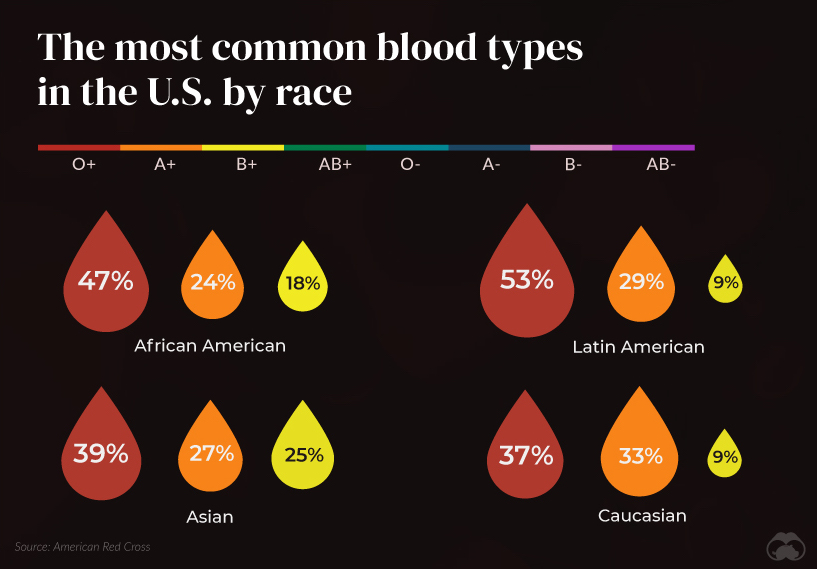
Africa
O+ is a strong blood group classification among African countries. Countries like Ghana, Libya, Congo and Egypt, have more individuals with O- blood types than AB+.
Europe
The A blood group is common in Europe. Nearly 40% of Denmark, Norway, Austria, and Ukraine have this blood type.
Oceania
O+ and A+ are dominant blood types in the Oceanic countries, with only Fiji having a substantial B+ blood type population.
Middle East
More than 41% of the population displays the O+ blood group type, with Lebanon being the only country with a strong O- and A- blood type population.
The Caribbean
Nearly half of people in Caribbean countries have the blood type O+, though Jamaica has B+ as the most common blood type group.
Here is the classification of the blood types by every region in the world:
Unity in Diversity
Even though ethnicity and genetics play a vital role in determining a person’s blood type, we can see many different blood types distributed worldwide.
Blood provides an ideal opportunity for the study of human variation without cultural prejudice. It can be easily classified for many different genetically inherited blood typing systems.
Our individuality is a factor that helps determine our life, choices, and personalities. But at the end of the day, commonalities like blood are what bring us together.


Misc
Infographic: Investment Opportunities in Biotech
Capture the investment opportunities in biotech with the MSCI Life Sciences Indexes, which target areas like virology and oncology.

Infographic: Investment Opportunities in Biotech
With the world evolving at an unprecedented pace, nearly every sector is being disrupted in some way or another.
In transportation, EVs were spearheaded by Tesla, which emerged as the first new American automaker in decades, and is now one of the world’s most valuable companies. Similarly, in the realm of AI, OpenAI has taken a leading position in large language models, demonstrating the immense potential of the technology.
Now, we turn our attention to biotech, an industry that is developing innovative treatments at an accelerated pace. In this graphic from sponsor MSCI, we explain the growing pipeline of biotech treatments, and why this could benefit investors.
Growth in Clinical Drug Trials
A clinical drug trial is a study performed on people to evaluate the effectiveness of a medical intervention. Since 2000, the number of trials initiated annually has grown by over 1,300%.
| Drug Trial Type | 2000 | 2010 | 2020 | 2022 |
|---|---|---|---|---|
| Monoclonal antibody | 60 | 623 | 1,833 | 1,685 |
| Protein & peptide therapeutics | 172 | 1,058 | 1,771 | 1,567 |
| Vaccine | 80 | 594 | 1,259 | 915 |
| Recombinant antibody | 50 | 513 | 984 | 860 |
| Cell therapy | 56 | 277 | 548 | 502 |
| Gene-Modified Cell Therapy | 16 | 148 | 355 | 423 |
| DNA & RNA therapeutics | 7 | 56 | 475 | 346 |
| Other biotechnology product | 28 | 236 | 362 | 347 |
| Total | 469 | 3,505 | 7,587 | 6,645 |
Behind every new treatment is an innovative company working to develop it. Thus, as the number of clinical trials grows, so too does the size of the investment universe.
Unfortunately, identifying suitable companies for investment is rather difficult. While a disease may have thousands of potential medicines, only one may ultimately receive FDA approval. This approval process can also take over a decade because treatments must pass several phases of testing.
Introducing the MSCI Life Sciences Indexes
To capture investment opportunities in biotech, MSCI has released a suite of thematic indexes that focus on key growth categories such as oncology and virology.
Developed in collaboration with Royalty Pharma, the world’s largest buyer of pharmaceutical royalties, the MSCI Life Sciences Indexes are designed to gauge the performance of pioneering companies within the biotech space.
These unique indexes can be used to benchmark growth, facilitate portfolio construction, and enhance investment research.
Explore the MSCI Life Sciences Indexes now

-

 Politics17 hours ago
How Do Chinese Citizens Feel About Other Countries?
What is the Chinese public’s view of world powers? This visual breaks down Chinese sentiment towards other countries.
-

 Crime7 days ago
Mapped: The Safest Cities in the U.S.
How safe is small town America? This map reveals the safest cities in the U.S. in terms of the total crime rate per every 1,000 residents.
-

 War7 days ago
Mapped: World’s Top 40 Largest Military Budgets
War in Europe has caused Ukraine’s military spend to jump up by 640%. How do the world’s largest military budgets compare?
-

 Cities1 week ago
Mapped: The Most Dangerous Cities in the U.S.
This map shows the most dangerous cities in the U.S. in terms of the violent crime rate per 1,000 residents.
-

 Maps2 weeks ago
Vintage Viz: The World’s Rivers and Lakes, Organized Neatly
Rivers and lakes have played important roles throughout history. This Vintage Viz looks at these bodies of water from the viewpoint of 1850.
-
 Jobs1 month ago
Visualizing Annual Working Hours in OECD Countries
Where do people work the most? Explore our analysis of the average annual working hours across OECD countries.

-

 Technology5 days ago
How Long it Took for Popular Apps to Reach 100 Million Users
-

 Datastream4 weeks ago
Can You Calculate Your Daily Carbon Footprint?
-

 Brands2 weeks ago
Brand Reputations: Ranking the Best and Worst in 2023
-

 Environment5 days ago
Hotter Than Ever: 2023 Sets New Global Temperature Records
-

 Investor Education4 weeks ago
Visualizing BlackRock’s Top Equity Holdings
-

 Energy2 weeks ago
Who’s Still Buying Russian Fossil Fuels in 2023?
-

 VC+5 days ago
What’s New on VC+ in July
-

 Datastream4 weeks ago
Charting the Rise of Cross-Border Money Transfers (2015-2023)