Debt
Where People Borrow Money From, by Country Income Level
Article/Editing:
When making the decision to borrow money, do you turn to friends and family for financial help, or do you go to a financial institution like a bank or credit card company?
On a country-to-country basis, this choice often depends on a mix of various factors, including the availability of financial services, financial literacy, and the cultural approach to the very concept of lending itself.
In these graphics, Richie Lionell sheds some light on where people borrow money from, using the 2021 Global Findex Database published by the World Bank.
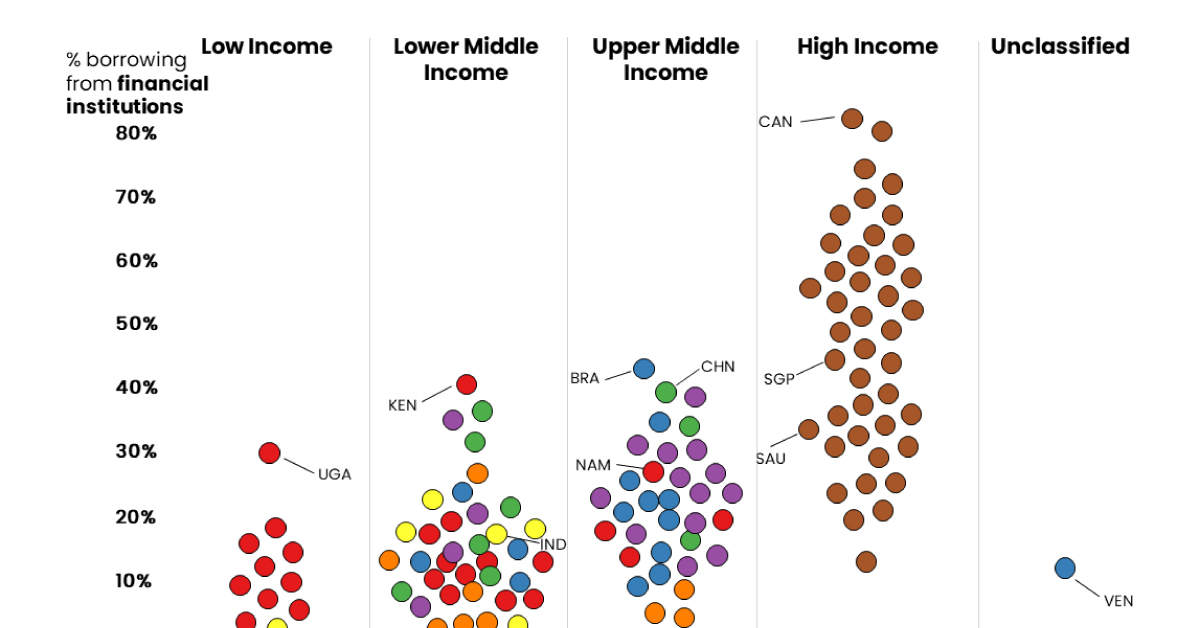
Borrowing From Financial Institutions
To compare borrowing practices across both location and income level, the dataset features survey results from respondents aged 15+ and groups countries by region except for high-income countries, which are grouped together.
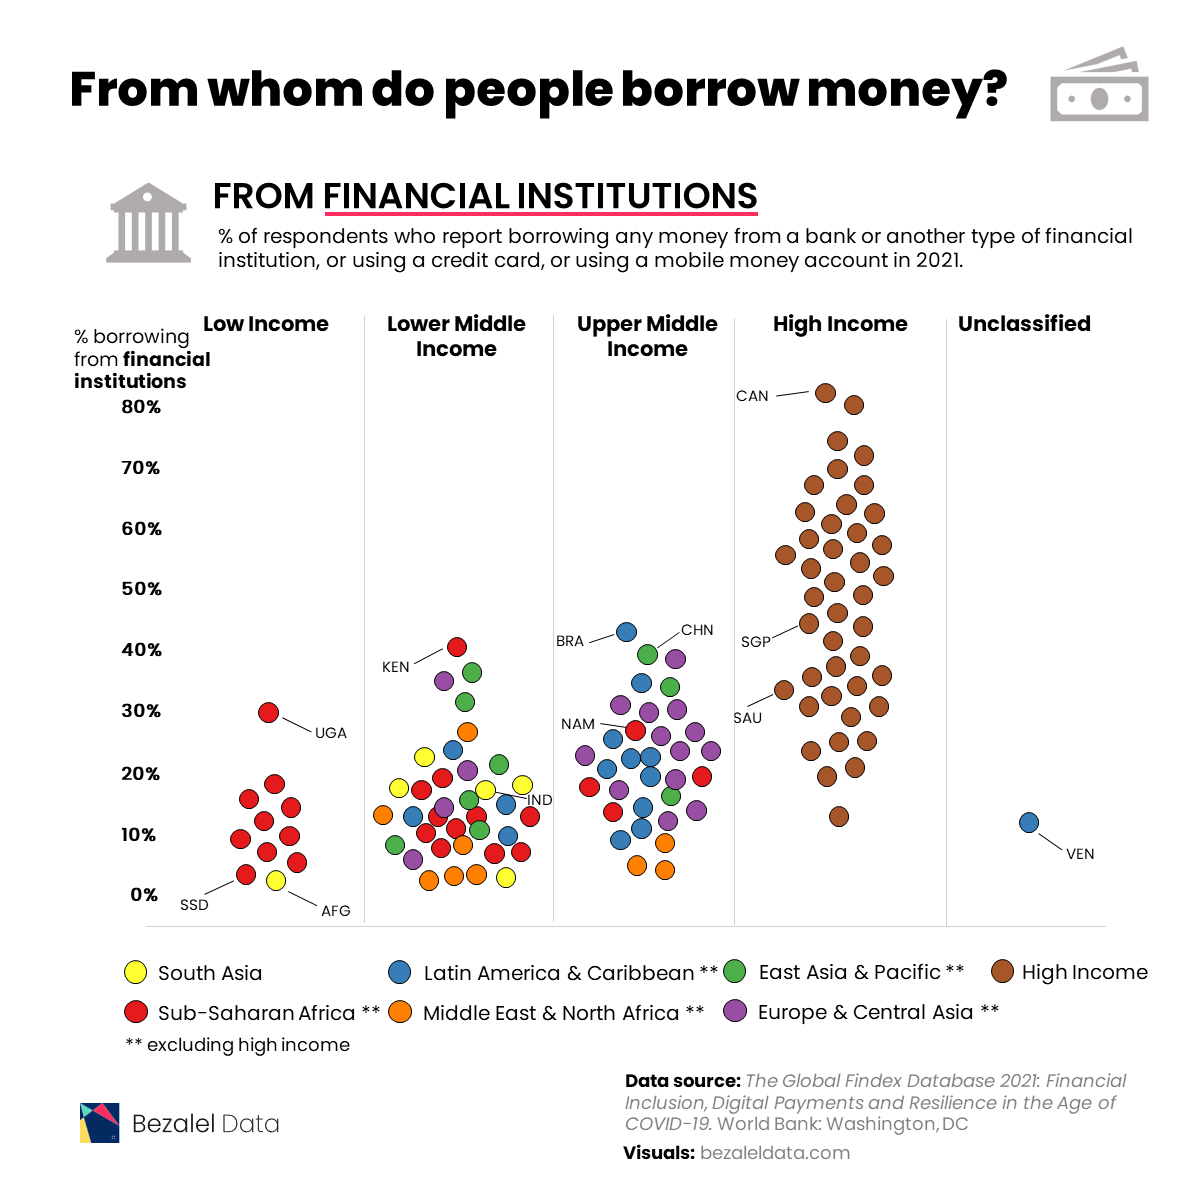
In 2021, most individuals in high income economies borrowed money from formal financial institutions.
| Country | Region | Borrowed from a financial institution |
|---|---|---|
| Canada | High income | 81.01% |
| Israel | High income | 79.52% |
| Iceland | High income | 73.36% |
| Hong Kong SAR, China | High income | 70.01% |
| Korea, Rep. | High income | 68.64% |
| Norway | High income | 66.82% |
| United States | High income | 66.21% |
| Taiwan, China | High income | 61.95% |
| Switzerland | High income | 61.40% |
| Japan | High income | 61.19% |
| New Zealand | High income | 60.38% |
| Australia | High income | 57.29% |
| Austria | High income | 56.52% |
| Italy | High income | 55.01% |
| United Kingdom | High income | 54.98% |
| Germany | High income | 54.68% |
| Ireland | High income | 54.11% |
| Denmark | High income | 53.16% |
| Finland | High income | 52.98% |
| Spain | High income | 51.92% |
| Sweden | High income | 48.69% |
| Belgium | High income | 47.98% |
| France | High income | 44.37% |
| Singapore | High income | 42.82% |
| Slovenia | High income | 42.36% |
| Uruguay | High income | 42.01% |
| Brazil | Latin America & Caribbean (excluding high income) | 40.75% |
| China | East Asia & Pacific (excluding high income) | 39.19% |
| Malta | High income | 38.95% |
| Türkiye | Europe & Central Asia (excluding high income) | 37.84% |
| Netherlands | High income | 34.45% |
| Slovak Republic | High income | 34.41% |
| Mongolia | East Asia & Pacific (excluding high income) | 34.39% |
| Ukraine | Europe & Central Asia (excluding high income) | 34.13% |
| Estonia | High income | 33.64% |
| Croatia | High income | 33.03% |
| Saudi Arabia | High income | 32.38% |
| Poland | High income | 31.92% |
| Czech Republic | High income | 31.33% |
| Cyprus | High income | 31.25% |
| Cambodia | East Asia & Pacific (excluding high income) | 30.89% |
| Argentina | Latin America & Caribbean (excluding high income) | 30.81% |
| Portugal | High income | 30.44% |
| Kazakhstan | Europe & Central Asia (excluding high income) | 29.76% |
| Russian Federation | Europe & Central Asia (excluding high income) | 29.75% |
| Thailand | East Asia & Pacific (excluding high income) | 28.26% |
| Bulgaria | Europe & Central Asia (excluding high income) | 26.36% |
| Armenia | Europe & Central Asia (excluding high income) | 26.17% |
| Iran, Islamic Rep. | Middle East & North Africa (excluding high income) | 25.11% |
| Chile | High income | 24.20% |
| Georgia | Europe & Central Asia (excluding high income) | 23.89% |
| Ecuador | Latin America & Caribbean (excluding high income) | 23.23% |
| Latvia | High income | 22.74% |
| United Arab Emirates | High income | 22.46% |
| Kenya | Sub-Saharan Africa (excluding high income) | 22.18% |
| North Macedonia | Europe & Central Asia (excluding high income) | 22.10% |
| Peru | Latin America & Caribbean (excluding high income) | 21.95% |
| Dominican Republic | Latin America & Caribbean (excluding high income) | 21.65% |
| Bosnia and Herzegovina | Europe & Central Asia (excluding high income) | 21.30% |
| Sri Lanka | South Asia | 21.29% |
| Namibia | Sub-Saharan Africa (excluding high income) | 20.97% |
| Serbia | Europe & Central Asia (excluding high income) | 20.65% |
| Greece | High income | 20.11% |
| Mauritius | Sub-Saharan Africa (excluding high income) | 20.09% |
| Bolivia | Latin America & Caribbean (excluding high income) | 19.30% |
| Romania | Europe & Central Asia (excluding high income) | 19.14% |
| Hungary | High income | 18.93% |
| Uganda | Sub-Saharan Africa (excluding high income) | 18.62% |
| South Africa | Sub-Saharan Africa (excluding high income) | 18.22% |
| Colombia | Latin America & Caribbean (excluding high income) | 18.10% |
| Kyrgyz Republic | Europe & Central Asia (excluding high income) | 17.73% |
| Kosovo | Europe & Central Asia (excluding high income) | 17.61% |
| Costa Rica | Latin America & Caribbean (excluding high income) | 17.46% |
| Philippines | East Asia & Pacific (excluding high income) | 17.45% |
| Liberia | Sub-Saharan Africa (excluding high income) | 15.42% |
| Bangladesh | South Asia | 14.22% |
| Nepal | South Asia | 14.11% |
| Malaysia | East Asia & Pacific (excluding high income) | 13.48% |
| Albania | Europe & Central Asia (excluding high income) | 13.39% |
| Moldova | Europe & Central Asia (excluding high income) | 13.18% |
| Indonesia | East Asia & Pacific (excluding high income) | 12.86% |
| Tajikistan | Europe & Central Asia (excluding high income) | 12.43% |
| Paraguay | Latin America & Caribbean (excluding high income) | 12.39% |
| Nicaragua | Latin America & Caribbean (excluding high income) | 12.19% |
| Jamaica | Latin America & Caribbean (excluding high income) | 12.04% |
| Lithuania | High income | 11.95% |
| India | South Asia | 11.79% |
| Mali | Sub-Saharan Africa (excluding high income) | 10.99% |
| El Salvador | Latin America & Caribbean (excluding high income) | 10.56% |
| Panama | Latin America & Caribbean (excluding high income) | 10.39% |
| Honduras | Latin America & Caribbean (excluding high income) | 10.32% |
| Mozambique | Sub-Saharan Africa (excluding high income) | 10.27% |
| Senegal | Sub-Saharan Africa (excluding high income) | 9.98% |
| Tunisia | Middle East & North Africa (excluding high income) | 9.89% |
| Jordan | Middle East & North Africa (excluding high income) | 9.86% |
| Lao PDR | East Asia & Pacific (excluding high income) | 9.15% |
| Venezuela, RB | Latin America & Caribbean (excluding high income) | 8.83% |
| Benin | Sub-Saharan Africa (excluding high income) | 8.21% |
| Malawi | Sub-Saharan Africa (excluding high income) | 7.99% |
| Uzbekistan | Europe & Central Asia (excluding high income) | 7.50% |
| Togo | Sub-Saharan Africa (excluding high income) | 7.42% |
| Ghana | Sub-Saharan Africa (excluding high income) | 7.40% |
| Egypt, Arab Rep. | Middle East & North Africa (excluding high income) | 7.30% |
| Myanmar | East Asia & Pacific (excluding high income) | 7.06% |
| Cameroon | Sub-Saharan Africa (excluding high income) | 6.99% |
| Zambia | Sub-Saharan Africa (excluding high income) | 6.76% |
| Burkina Faso | Sub-Saharan Africa (excluding high income) | 6.66% |
| Nigeria | Sub-Saharan Africa (excluding high income) | 6.40% |
| Congo, Rep. | Sub-Saharan Africa (excluding high income) | 6.19% |
| Guinea | Sub-Saharan Africa (excluding high income) | 6.11% |
| Gabon | Sub-Saharan Africa (excluding high income) | 5.48% |
| Morocco | Middle East & North Africa (excluding high income) | 4.99% |
| West Bank and Gaza | Middle East & North Africa (excluding high income) | 4.94% |
| Tanzania | Sub-Saharan Africa (excluding high income) | 4.45% |
| Sierra Leone | Sub-Saharan Africa (excluding high income) | 4.29% |
| Cote d'Ivoire | Sub-Saharan Africa (excluding high income) | 4.10% |
| Algeria | Middle East & North Africa (excluding high income) | 3.80% |
| Iraq | Middle East & North Africa (excluding high income) | 3.64% |
| Pakistan | South Asia | 3.51% |
| Lebanon | Middle East & North Africa (excluding high income) | 3.31% |
| Zimbabwe | Sub-Saharan Africa (excluding high income) | 2.89% |
| South Sudan | Sub-Saharan Africa (excluding high income) | 2.48% |
| Afghanistan | South Asia | 2.05% |
With 81% of respondents borrowing from financial institutions, Canada tops this list. Meanwhile, Israel (80%), Iceland (73%), Hong Kong (70%), and South Korea (69%) are not far behind.
This is not surprising for richer nations, as financial services in these countries are more available and accessible. This, coupled with higher financial literacy, including a general understanding of interest rates and credit-building opportunities, contribute to the popularity of financial institutions.
Also, it’s worth noting that some countries have cultural practices that factor in. For example, 61% of respondents in Japan used formal financial institutions, which are a more socially acceptable option than asking to borrow money from friends and family (just 6% of people in Japan).
Borrowing from Friends and Family
In contrast, more individuals in lower income economies approached family and friends in order to borrow money.
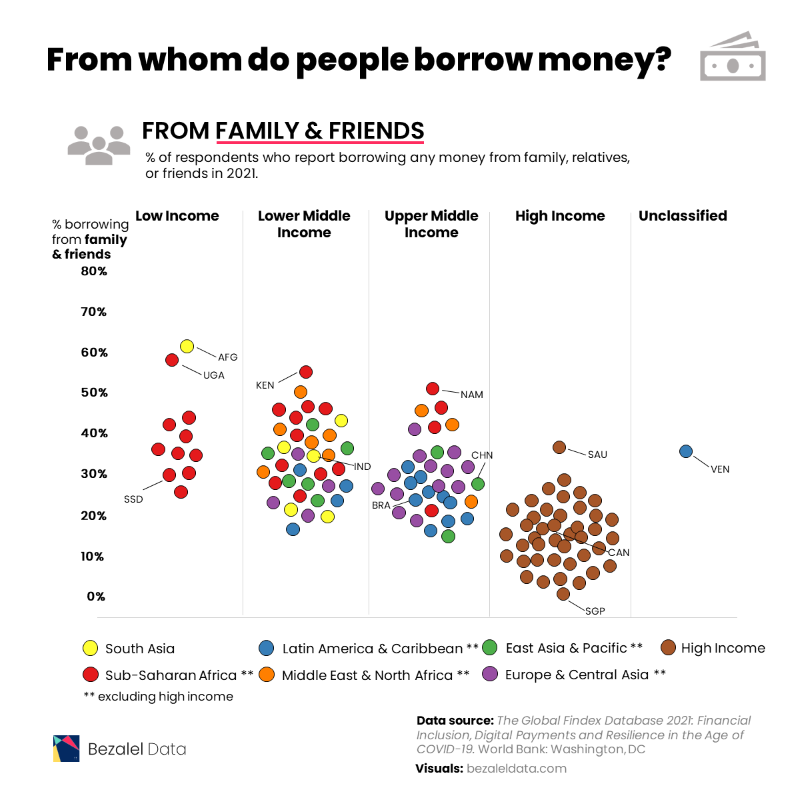
Afghanistan tops this list with 60% of respondents relying on friends and family, compared to only 2% borrowing money from formal financial institutions.
| Country | Region | Borrowed from family or friends |
|---|---|---|
| Afghanistan | South Asia | 60.18% |
| Uganda | Sub-Saharan Africa (excluding high income) | 57.45% |
| Kenya | Sub-Saharan Africa (excluding high income) | 54.40% |
| Namibia | Sub-Saharan Africa (excluding high income) | 50.25% |
| Morocco | Middle East & North Africa (excluding high income) | 48.73% |
| Nigeria | Sub-Saharan Africa (excluding high income) | 44.71% |
| South Africa | Sub-Saharan Africa (excluding high income) | 44.54% |
| Iraq | Middle East & North Africa (excluding high income) | 44.10% |
| Cameroon | Sub-Saharan Africa (excluding high income) | 43.49% |
| Zambia | Sub-Saharan Africa (excluding high income) | 43.08% |
| Zimbabwe | Sub-Saharan Africa (excluding high income) | 42.34% |
| Guinea | Sub-Saharan Africa (excluding high income) | 42.04% |
| Nepal | South Asia | 41.79% |
| Jordan | Middle East & North Africa (excluding high income) | 41.76% |
| Gabon | Sub-Saharan Africa (excluding high income) | 41.41% |
| Liberia | Sub-Saharan Africa (excluding high income) | 41.37% |
| Tunisia | Middle East & North Africa (excluding high income) | 41.05% |
| Philippines | East Asia & Pacific (excluding high income) | 40.82% |
| Türkiye | Europe & Central Asia (excluding high income) | 40.80% |
| Iran, Islamic Rep. | Middle East & North Africa (excluding high income) | 39.80% |
| Sierra Leone | Sub-Saharan Africa (excluding high income) | 39.02% |
| Ghana | Sub-Saharan Africa (excluding high income) | 38.58% |
| Egypt, Arab Rep. | Middle East & North Africa (excluding high income) | 37.75% |
| Saudi Arabia | High income | 35.76% |
| Bangladesh | South Asia | 35.49% |
| Mali | Sub-Saharan Africa (excluding high income) | 35.15% |
| Burkina Faso | Sub-Saharan Africa (excluding high income) | 35.14% |
| Cambodia | East Asia & Pacific (excluding high income) | 34.85% |
| Venezuela, RB | Latin America & Caribbean (excluding high income) | 34.81% |
| Togo | Sub-Saharan Africa (excluding high income) | 33.99% |
| West Bank and Gaza | Middle East & North Africa (excluding high income) | 33.93% |
| Thailand | East Asia & Pacific (excluding high income) | 32.83% |
| Lao PDR | East Asia & Pacific (excluding high income) | 32.36% |
| Moldova | Europe & Central Asia (excluding high income) | 32.18% |
| Ukraine | Europe & Central Asia (excluding high income) | 32.17% |
| Senegal | Sub-Saharan Africa (excluding high income) | 31.30% |
| Armenia | Europe & Central Asia (excluding high income) | 31.29% |
| India | South Asia | 31.02% |
| Bolivia | Latin America & Caribbean (excluding high income) | 30.69% |
| Algeria | Middle East & North Africa (excluding high income) | 30.52% |
| Cote d'Ivoire | Sub-Saharan Africa (excluding high income) | 30.20% |
| Albania | Europe & Central Asia (excluding high income) | 30.00% |
| Bulgaria | Europe & Central Asia (excluding high income) | 29.99% |
| Benin | Sub-Saharan Africa (excluding high income) | 29.33% |
| Mozambique | Sub-Saharan Africa (excluding high income) | 29.33% |
| Tanzania | Sub-Saharan Africa (excluding high income) | 29.24% |
| Colombia | Latin America & Caribbean (excluding high income) | 29.08% |
| Indonesia | East Asia & Pacific (excluding high income) | 28.85% |
| South Sudan | Sub-Saharan Africa (excluding high income) | 28.84% |
| Ecuador | Latin America & Caribbean (excluding high income) | 28.79% |
| Serbia | Europe & Central Asia (excluding high income) | 28.49% |
| Russian Federation | Europe & Central Asia (excluding high income) | 28.40% |
| Mongolia | East Asia & Pacific (excluding high income) | 27.01% |
| Kyrgyz Republic | Europe & Central Asia (excluding high income) | 27.01% |
| China | East Asia & Pacific (excluding high income) | 26.43% |
| Honduras | Latin America & Caribbean (excluding high income) | 26.07% |
| Greece | High income | 25.94% |
| Kosovo | Europe & Central Asia (excluding high income) | 25.86% |
| Argentina | Latin America & Caribbean (excluding high income) | 25.72% |
| Kazakhstan | Europe & Central Asia (excluding high income) | 25.64% |
| Romania | Europe & Central Asia (excluding high income) | 25.58% |
| Malawi | Sub-Saharan Africa (excluding high income) | 25.24% |
| North Macedonia | Europe & Central Asia (excluding high income) | 25.14% |
| Dominican Republic | Latin America & Caribbean (excluding high income) | 24.70% |
| Brazil | Latin America & Caribbean (excluding high income) | 24.66% |
| Congo, Rep. | Sub-Saharan Africa (excluding high income) | 24.40% |
| Lebanon | Middle East & North Africa (excluding high income) | 24.26% |
| Nicaragua | Latin America & Caribbean (excluding high income) | 23.75% |
| Iceland | High income | 23.63% |
| Peru | Latin America & Caribbean (excluding high income) | 23.34% |
| United Arab Emirates | High income | 23.04% |
| Myanmar | East Asia & Pacific (excluding high income) | 23.03% |
| Sri Lanka | South Asia | 22.53% |
| Paraguay | Latin America & Caribbean (excluding high income) | 22.20% |
| Pakistan | South Asia | 21.87% |
| Uzbekistan | Europe & Central Asia (excluding high income) | 21.53% |
| Cyprus | High income | 20.95% |
| Bosnia and Herzegovina | Europe & Central Asia (excluding high income) | 20.94% |
| Chile | High income | 20.72% |
| Georgia | Europe & Central Asia (excluding high income) | 20.61% |
| Mauritius | Sub-Saharan Africa (excluding high income) | 20.48% |
| Costa Rica | Latin America & Caribbean (excluding high income) | 20.29% |
| Jamaica | Latin America & Caribbean (excluding high income) | 20.02% |
| Tajikistan | Europe & Central Asia (excluding high income) | 19.86% |
| Poland | High income | 19.34% |
| Norway | High income | 19.29% |
| United States | High income | 18.09% |
| Uruguay | High income | 17.60% |
| Panama | Latin America & Caribbean (excluding high income) | 17.54% |
| Denmark | High income | 17.51% |
| Croatia | High income | 17.09% |
| El Salvador | Latin America & Caribbean (excluding high income) | 16.78% |
| Slovenia | High income | 16.77% |
| Latvia | High income | 16.57% |
| Australia | High income | 16.44% |
| Estonia | High income | 15.74% |
| Malaysia | East Asia & Pacific (excluding high income) | 15.44% |
| Israel | High income | 15.43% |
| New Zealand | High income | 15.19% |
| Slovak Republic | High income | 15.02% |
| Germany | High income | 15.01% |
| Austria | High income | 14.41% |
| Canada | High income | 14.00% |
| Finland | High income | 13.43% |
| Czech Republic | High income | 13.41% |
| Korea, Rep. | High income | 13.16% |
| Malta | High income | 12.99% |
| Belgium | High income | 12.13% |
| Sweden | High income | 11.79% |
| Hungary | High income | 11.15% |
| Lithuania | High income | 10.65% |
| Spain | High income | 10.44% |
| France | High income | 10.42% |
| Netherlands | High income | 10.24% |
| Ireland | High income | 9.84% |
| Taiwan, China | High income | 9.70% |
| Portugal | High income | 8.22% |
| Hong Kong SAR, China | High income | 7.59% |
| Japan | High income | 6.43% |
| Switzerland | High income | 6.10% |
| United Kingdom | High income | 5.24% |
| Italy | High income | 5.06% |
| Singapore | High income | 1.89% |
Many individuals in African countries including Uganda (57%), Kenya (54%), Namibia (50%), and Morocco (49%) also are choosing to borrow money from friends and family over financial institutions.
These preferences can be attributed to various factors including a lack of trust in banking and financial institutions, lacking access to such services, or the lack of information about such services if they are available.
And in some societies, borrowing from friends and family can be seen as a cultural norm, especially in places where mutual support and solidarity play a strong role.
What’s Next?
As viewed by the World Bank, financial inclusion is an important foundation of any nation’s development, and it’s also one of the UN’s Sustainable Development Goals. Increasing levels of financial inclusion helps give people access to services like savings plans, credit avenues, and online payments and transactions.
And thanks to commitments from countries and financial systems, global ownership of banking accounts has increased significantly (and been further spurred by the COVID-19 pandemic). According to the Global Findex Database, bank account ownership has risen to 76% in 2021, up from just 51% a decade prior.
However, access to these services is still rife with gaps when it comes to low income nations, low income individuals, and unequal access based on gender. The future of borrowing now relies on how nations deal with these challenges.

This article was published as a part of Visual Capitalist's Creator Program, which features data-driven visuals from some of our favorite Creators around the world.


United States
Charting the Rise of America’s Debt Ceiling
By June 1, a debt ceiling agreement must be finalized. The U.S. could default if politicians fail to act—causing many stark consequences.
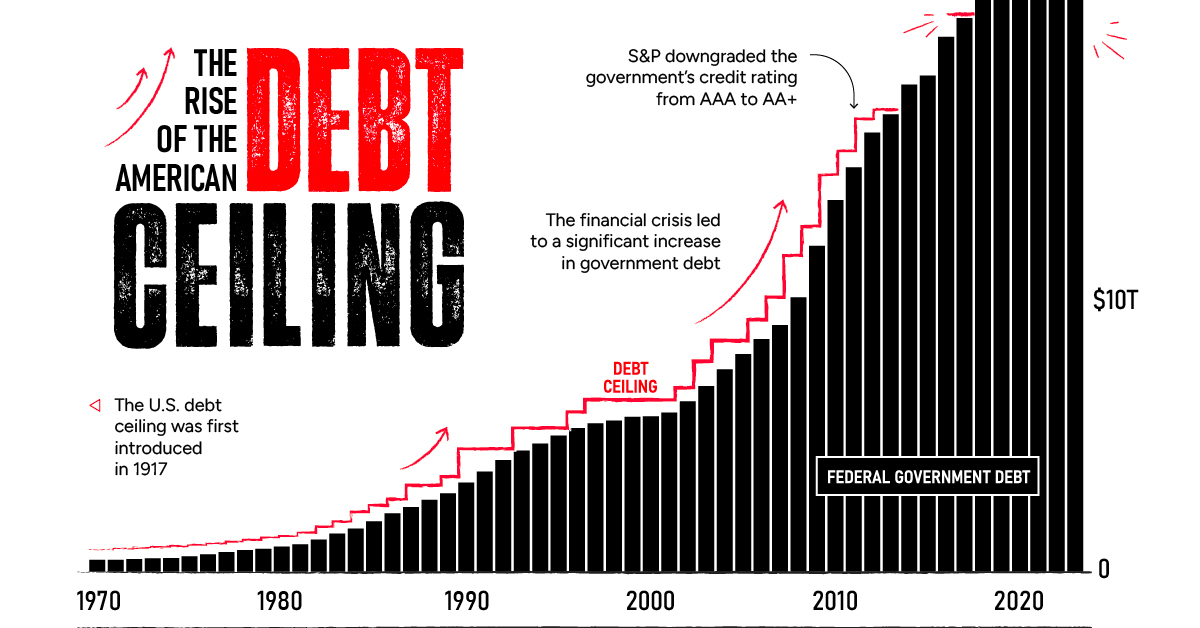
Charting the Rise of America’s Debt Ceiling
Every few years the debt ceiling standoff puts the credit of the U.S. at risk.
In January, the $31.4 trillion debt limit—the amount of debt the U.S. government can hold—was reached. That means U.S. cash reserves could be exhausted by June 1 according to Treasury Secretary Janet Yellen. Should Republicans and Democrats fail to act, the U.S. could default on its debt, causing harmful effects across the financial system.
The above graphic shows the sharp rise in the debt ceiling in recent years, pulling data from various sources including the World Bank, U.S. Department of Treasury, and Congressional Research Service.
Familiar Territory
Raising the debt ceiling is nothing new. Since 1960, it’s been raised 78 times.
In the 2023 version of the debate, Republican House Majority Leader Kevin McCarthy is asking for cuts in government spending. However, President Joe Biden argues that the debt ceiling should be increased without any strings attached. Adding to this, the sharp uptick in interest rates have been a clear reminder that rising debt levels can be precarious.
Consider that historically, interest payments on the U.S. debt have been equal to about half the cost of defense. More recently, however, the cost of servicing the debt has risen, and is now almost on par with the defense budget as a whole.
Key Moments In Recent History
Over history, raising the debt ceiling has often been a typical process for Congress.
Unlike today, agreements to raise the debt ceiling were often negotiated faster. Increased political polarization over recent years has contributed to standoffs with damaging consequences.
For instance, in 2011, an agreement was made just days before the deadline. As a result, S&P downgraded the U.S. credit rating from AAA to AA+ for the first time ever. This delay cost an estimated $1.3 billion in extra costs to the government that year.
Before then, the government shut down twice between 1995 and 1996 as President Bill Clinton and Republican House Speaker Newt Gingrich went head-to-head. Over a million government workers were furloughed for a week in late November 1995 before the debt limit was raised.
What Happens Now?
Today, Republicans and Democrats have less than two weeks to reach an agreement.
If Congress doesn’t make a deal the result would be that the government can’t pay its bills by taking on new debt. Payment for federal workers would be suspended, certain pension payments would get stalled, and interest payments on Treasuries would be delayed. The U.S. would default under these conditions.
Three Potential Consequences
Here are some of the potential knock-on effects if the debt ceiling isn’t raised by June 1, 2023:
1. Higher Interest Rates
Typically investors require higher interest payments as the risk of their debt holdings increase.
If the U.S. fails to pay interest payments on its debt and gets a credit downgrade, these interest payments would likely rise higher. This would impact the U.S. government’s interest payments and the cost of borrowing for businesses and households.
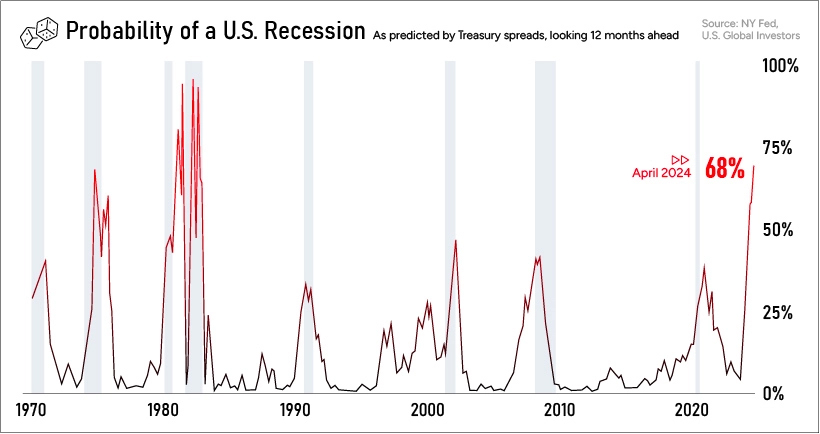
High interest rates can slow economic growth since it disincentivizes spending and taking on new debt. We can see in the chart below that a gloomier economic picture has already been anticipated, showing its highest probability since 1983.
Historically, recessions have increased U.S. deficit spending as tax receipts fall and there is less income to help fund government activities. Additional fiscal stimulus spending can also exacerbate any budget imbalance.
Finally, higher interest rates could spell more trouble for the banking sector, which is already on edge after the collapse of Silicon Valley Bank and Signature Bank.
A rise in interest rates would push down the value of outstanding bonds, which banks hold as capital reserves. This makes it even more challenging to cover deposits, which could further increase uncertainty in the banking industry.
2. Eroding International Credibility
As the world’s reserve currency, any default on U.S. Treasuries would rattle global markets.
If its role as an ultra safe asset is undermined, a chain reaction of negative consequences could spread throughout the global financial system. Often Treasuries are held as collateral. If these debt payments fail to get paid to investors, prices would plummet, demand could crater, and global investors may shift investment elsewhere.
Investors are factoring in the risk of the U.S. not paying its bondholders.
As we can see this in the chart below, U.S. one-year credit default swap (CDS) spreads are much higher than other nations. These CDS instruments, quoted in spreads, offer insurance in the event that the U.S. defaults. The wider the spread, the greater the expected risk that the bondholder won’t be paid.
The US now has higher credit risk than Mexico, Greece, and Brazil pic.twitter.com/je4klBvHZ6
— Genevieve Roch-Decter, CFA (@GRDecter) May 11, 2023
Additionally, a default could add fuel to the perception of global de-dollarization. Since 2001, the USD has slipped from 73% to 58% of global reserves.
Since Russia’s invasion of Ukraine led to steep financial sanctions, China and India are increasingly using their currencies for trade settlement. President of Russia Vladimir Putin says that two-thirds of trade is settled in yuan or roubles. Recently, China has also entered non-dollar agreements with Brazil and Kazakhstan.
3. Financial Sector Turmoil
Back at home, a debt default would hurt investor confidence in the U.S. economy. Coupled with already higher interest rates impacting costs, financial markets could see added strain. Lower investor demand could depress stock prices.
Is the Debt Ceiling Concept Flawed?
Today, U.S. government debt stands at 129% of GDP.
The annualized cost of servicing this debt has jumped an estimated 90% compared to 2011, driven by increasing debt and higher interest rates.
Some economists argue that the debt ceiling helps keep the government more fiscally responsible. Others suggest that it’s structured poorly, and that if the government approves a level of spending in its budget, that debt ceiling increases should come more automatically.
In fact, it’s worth noting that the U.S. is one of the few countries worldwide with a debt ceiling.
-

 Maps7 days ago
Mapped: The Safest Cities in the U.S.
-

 Markets2 weeks ago
Ranked: The Most Profitable U.S. Companies, by Sector
-

 apps5 days ago
How Long it Took for Popular Apps to Reach 100 Million Users
-

 Markets4 weeks ago
The World’s Biggest Mutual Fund and ETF Providers
-

 Brands2 weeks ago
Brand Reputations: Ranking the Best and Worst in 2023
-

 Environment5 days ago
Hotter Than Ever: 2023 Sets New Global Temperature Records
-

 Datastream4 weeks ago
Can You Calculate Your Daily Carbon Footprint?
-

 Energy2 weeks ago
Who’s Still Buying Russian Fossil Fuels in 2023?