Markets
The 7 Major Flaws of the Global Financial System

The 7 Major Flaws of the Global Financial System
Since the invention of banking, the global financial system has become increasingly centralized.
In the modern system, central banks now control everything from interest rates to the issuance of currency, while government regulators, corporations, and intergovernmental organizations wield unparalleled influence at the top of this crucial food chain.
There is no doubt that this centralization has led to the creation of massive amounts of wealth, especially to those properly connected to the financial system. However, the same centralization has also arguably contributed to many global challenges and risks we face today.
Flaws of the Global Financial System
Today’s infographic comes to us from investment app Abra, and it highlights the seven major flaws of the global financial system, ranging from the lack of basic access to financial services to growing inequality.
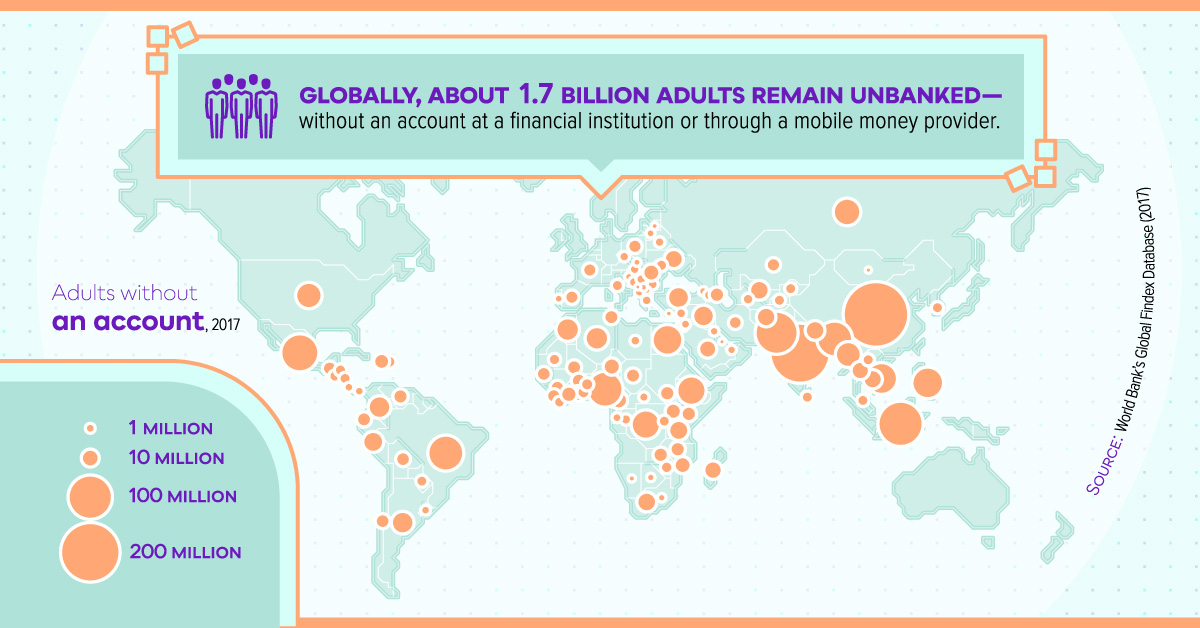
1. Billions of people globally remain unbanked
To participate in the global financial sector, whether it is to make a digital payment or manage one’s wealth, one must have access to a bank account. However, 1.7 billion adults worldwide remain unbanked, having zero access to an account with a financial institution or a mobile money provider.
2. Global financial literacy remains low
For people to successfully use financial services and markets, they must have some degree of financial literacy. According to a recent global survey, just 1-in-3 people show an understanding of basic financial concepts, with most of these people living in high income economies.
Without an understanding of key concepts in finance, it makes it difficult for the majority of the population to make the right decisions – and to build wealth.
3. High intermediary costs and slow transactions
Once a person has access to financial services, sending and storing money should be inexpensive and fast.
However, just the opposite is true. Around the globe, the average cost of a remittance is 7.01% in fees per transaction – and when using banks, that rises to 10.53%. Even worse, these transactions can take days at a time, which seems quite unnecessary in today’s digital era.
4. Low trust in financial institutions and governments
The financial sector is the least trusted business sector globally, with only a 57% level of trust according to Edelman. Meanwhile, trust in governments is even lower, with only 40% trusting the U.S. government, and the global country average sitting at 47%.
5. Rising global inequality
In a centralized system, financial markets tend to be dominated by those who are best connected to them.
These are people who have:
- Access to many financial opportunities and asset classes
- Capital to deploy
- Informational advantages
- Access to financial expertise
In fact, according to recent data on global wealth concentration, the top 1% own 47% of all household wealth, while the top 10% hold roughly 85%.
On the other end of the spectrum, the vast majority of people have little to no financial assets to even start building wealth. Not only are many people living paycheck to paycheck – but they also don’t have access to assets that can create wealth, like stocks, bonds, mutual funds, or ETFs.
6. Currency manipulation and censorship
In a centralized system, countries have the power to manipulate and devalue fiat currencies, and this can have a devastating effect on markets and the lives of citizens.
In Venezuela, for example, the government has continually devalued its currency, creating runaway hyperinflation as a result. The last major currency manipulation in 2018 increased the price of a cup of coffee by over 772,400% in six months.
Further, centralized power also gives governments and financial institutions the ability to financially censor citizens, by taking actions such as freezing accounts, denying access to payment systems, removing funds from accounts, and denying the retrieval of funds during bank runs.
7. The build-up of systemic risk
Finally, centralization creates one final and important drawback.
With financial power concentrated with just a select few institutions, such as central banks and “too big too fail” companies, it means that one abject failure can decimate an entire system.
This happened in 2008 as U.S. subprime mortgages turned out to be an Achilles Heel for bank balance sheets, creating a ripple effect throughout the globe. Centralization means all eggs in one basket – and if that basket breaks it can possibly lead to the destruction of wealth on a large scale.
The Future of the Global Financial System?
The risks and drawbacks of centralization to the global financial system are well known, however there has never been much of a real alternative – until now.
With the proliferation of mobile phones and internet access, as well as the development of decentralization technologies like the blockchain, it may be possible to build an entirely new financial system.
But is the world ready?


Markets
The 50 Best One-Year Returns on the S&P 500 (1980-2022)
The highest one-year return among the top S&P 500 stocks from 1980 to 2022 was a staggering 2,620%. Which stocks top the ranks?

The Top S&P 500 Stocks by Annual Returns
The average annual return of the S&P 500 was 10% from 1980-2022, excluding dividends. Of course, there are some companies that deliver much higher returns in any given year.
In this graphic using data from S&P Dow Jones Indices, we explore the top S&P 500 stocks with the best single year returns over the last four decades.
Ranking the Top S&P 500 Stocks
In order to find the top gainers, S&P took the top 10 best-performing stocks each year and then narrowed that list down to the top 50 overall. They ranked the top S&P 500 stocks by price returns, meaning that no dividends or stock distributions were included.
The best gains were clustered in a few select years, including the 1999 dot-com boom, the 2003 stock market rally, and the 2009 recovery from the Global Financial Crisis. None of the biggest gains happened in 2021 or 2022.
| Rank | Company | Sector | Return | Year |
|---|---|---|---|---|
| 1 | Qualcomm | Information Technology | 2620% | 1999 |
| 2 | Tesla | Consumer Discretionary | 743% | 2020 |
| 3 | DSC Communications | Communication Services | 468% | 1992 |
| 4 | Coleco Industries | Consumer Discretionary | 435% | 1982 |
| 5 | Avaya | Information Technology | 428% | 2003 |
| 6 | Chrysler | Consumer Discretionary | 426% | 1982 |
| 7 | XL Capital (Axa XL) | Financials | 395% | 2009 |
| 8 | Tenet Healthcare | Healthcare | 369% | 2009 |
| 9 | Dynegy | Utilities | 361% | 2000 |
| 10 | Advanced Micro Devices | Information Technology | 348% | 2009 |
| 11 | Sprint | Communication Services | 343% | 1999 |
| 12 | Ford | Consumer Discretionary | 337% | 2009 |
| 13 | NEXTEL Communications | Communication Services | 336% | 1999 |
| 14 | LSI Logic | Information Technology | 319% | 1999 |
| 15 | NVIDIA | Information Technology | 308% | 2001 |
| 16 | Nortel Networks | Communication Services | 304% | 1999 |
| 17 | Etsy | Consumer Discretionary | 302% | 2020 |
| 18 | Genworth Financial | Financials | 301% | 2009 |
| 19 | Micron Technology | Information Technology | 300% | 2009 |
| 20 | NetFlix | Communication Services | 298% | 2013 |
| 21 | Oracle | Information Technology | 290% | 1999 |
| 22 | Western Digital | Information Technology | 286% | 2009 |
| 23 | Network Appliance (NetApp) | Information Technology | 270% | 1999 |
| 24 | Data General | Information Technology | 267% | 1991 |
| 25 | Yahoo | Communication Services | 265% | 1999 |
| 26 | Williams Companies | Energy | 264% | 2003 |
| 27 | Novell | Information Technology | 264% | 1991 |
| 28 | Dynegy | Utilities | 263% | 2003 |
| 29 | Sun Microsystems | Information Technology | 262% | 1999 |
| 30 | PMC-Sierra | Information Technology | 262% | 2003 |
| 31 | Advanced Micro Devices | Information Technology | 259% | 1991 |
| 32 | Dell | Information Technology | 248% | 1998 |
| 33 | Global Marine | Energy | 247% | 1980 |
| 34 | Micron Technology | Information Technology | 243% | 2013 |
| 35 | Best Buy | Consumer Discretionary | 237% | 2013 |
| 36 | Reebok | Consumer Discretionary | 234% | 2000 |
| 37 | Freeport-McMoRan | Materials | 229% | 2009 |
| 38 | Biomet (Zimmer Biomet) | Healthcare | 226% | 1991 |
| 39 | NVIDIA | Information Technology | 224% | 2016 |
| 40 | Gap | Consumer Discretionary | 223% | 1991 |
| 41 | NetFlix | Communication Services | 219% | 2010 |
| 42 | Fleetwood Enterprises (Fleetwood RV) | Consumer Discretionary | 217% | 1982 |
| 43 | National Semiconductor | Information Technology | 217% | 1999 |
| 44 | Dell | Information Technology | 216% | 1997 |
| 45 | Tandy Corp (RadioShack) | Information Technology | 216% | 1980 |
| 46 | Novell | Information Technology | 215% | 2003 |
| 47 | Corning | Information Technology | 215% | 2003 |
| 48 | CB Richard Ellis (CBRE) | Real Estate | 214% | 2009 |
| 49 | AES Corp | Utilities | 213% | 2003 |
| 50 | Expedia | Consumer Discretionary | 212% | 2009 |
Qualcomm was by far the top-performer in any one calendar year window. The company had key patents for Code Division Multiple Access (CDMA) technology, which enabled fast wireless internet access and became the basis for 3G networks.
Its stock took off in 1999 as it shed less profitable business lines, resolved a patent dispute with competitor Ericsson, and joined the S&P 500 Index. At the time, CNN reported that one lucky investor who heard about Qualcomm from an investment-banker-turned-rabbi earned $17 million—roughly $30 million in today’s dollars.
The most recent stocks to make the rankings were both from 2020: well-known Tesla (#2) and lesser-known online marketplace Etsy (#17), which saw sales from independent creators surge during the early COVID-19 pandemic. The dollar value of items sold on Etsy more than doubled from $5.3 billion in 2019 to $10.3 billion in 2020, with mask sales accounting for 7% of the total.
Biggest Gainers in Each Sector
While information technology stocks made up nearly half of the list, there is representation from nine of the 11 S&P 500 sectors. No companies from the Industrials or Consumer Staples sectors made it into the ranks of the top S&P 500 stocks by annual returns.
Below, we show the stock with the best annual return for each sector.

Tesla was the top-performing Consumer Discretionary stock on the list. After meeting the requirement of four consecutive quarters of positive earnings, it joined the S&P 500 Index on December 21, 2020. The company’s performance was boosted by the announcement that it would be included in the S&P 500, along with strong performance in China, and general EV buzz as environmental regulations tightened worldwide.
In the realm of Communication Services, DSC Communications saw a sizable return in 1992. The telecommunications equipment company had contracts with major companies such as Bell and Motorola. Alcatel-Lucent (then Alcatel), a French producer of mobile phones, purchased DSC Communications in 1998.
Serial Success Stories
It’s impressive to make the list of the top S&P 500 stocks by calendar returns once, but there are seven companies that have done it twice.
Some stocks saw their repeated outperformance close together, with Dell making the ranks back-to-back in 1997 and 1998.

On the other hand, a select few have more staying power. Computing giant NVIDIA topped the charts in 2001 and triumphed again 15 years later in 2016. And this year might be another win, as the company has recently reached a $1 trillion market capitalization and has the highest year-to-date return in the S&P 500 as of July 6, 2023.
-

 Markets4 weeks ago
The World’s Biggest Mutual Fund and ETF Providers
-

 Markets2 weeks ago
Brand Reputations: Ranking the Best and Worst in 2023
-

 Environment5 days ago
Hotter Than Ever: 2023 Sets New Global Temperature Records
-

 Datastream4 weeks ago
Can You Calculate Your Daily Carbon Footprint?
-

 Energy2 weeks ago
Who’s Still Buying Russian Fossil Fuels in 2023?
-

 VC+4 days ago
What’s New on VC+ in July
-

 Markets4 weeks ago
Visualizing BlackRock’s Top Equity Holdings
-

 Technology2 weeks ago
Meet the Competing Apps Battling for Twitter’s Market Share