Markets
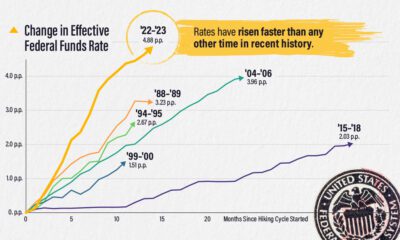
Comparing the Speed of U.S. Interest Rate Hikes (1988-2022)
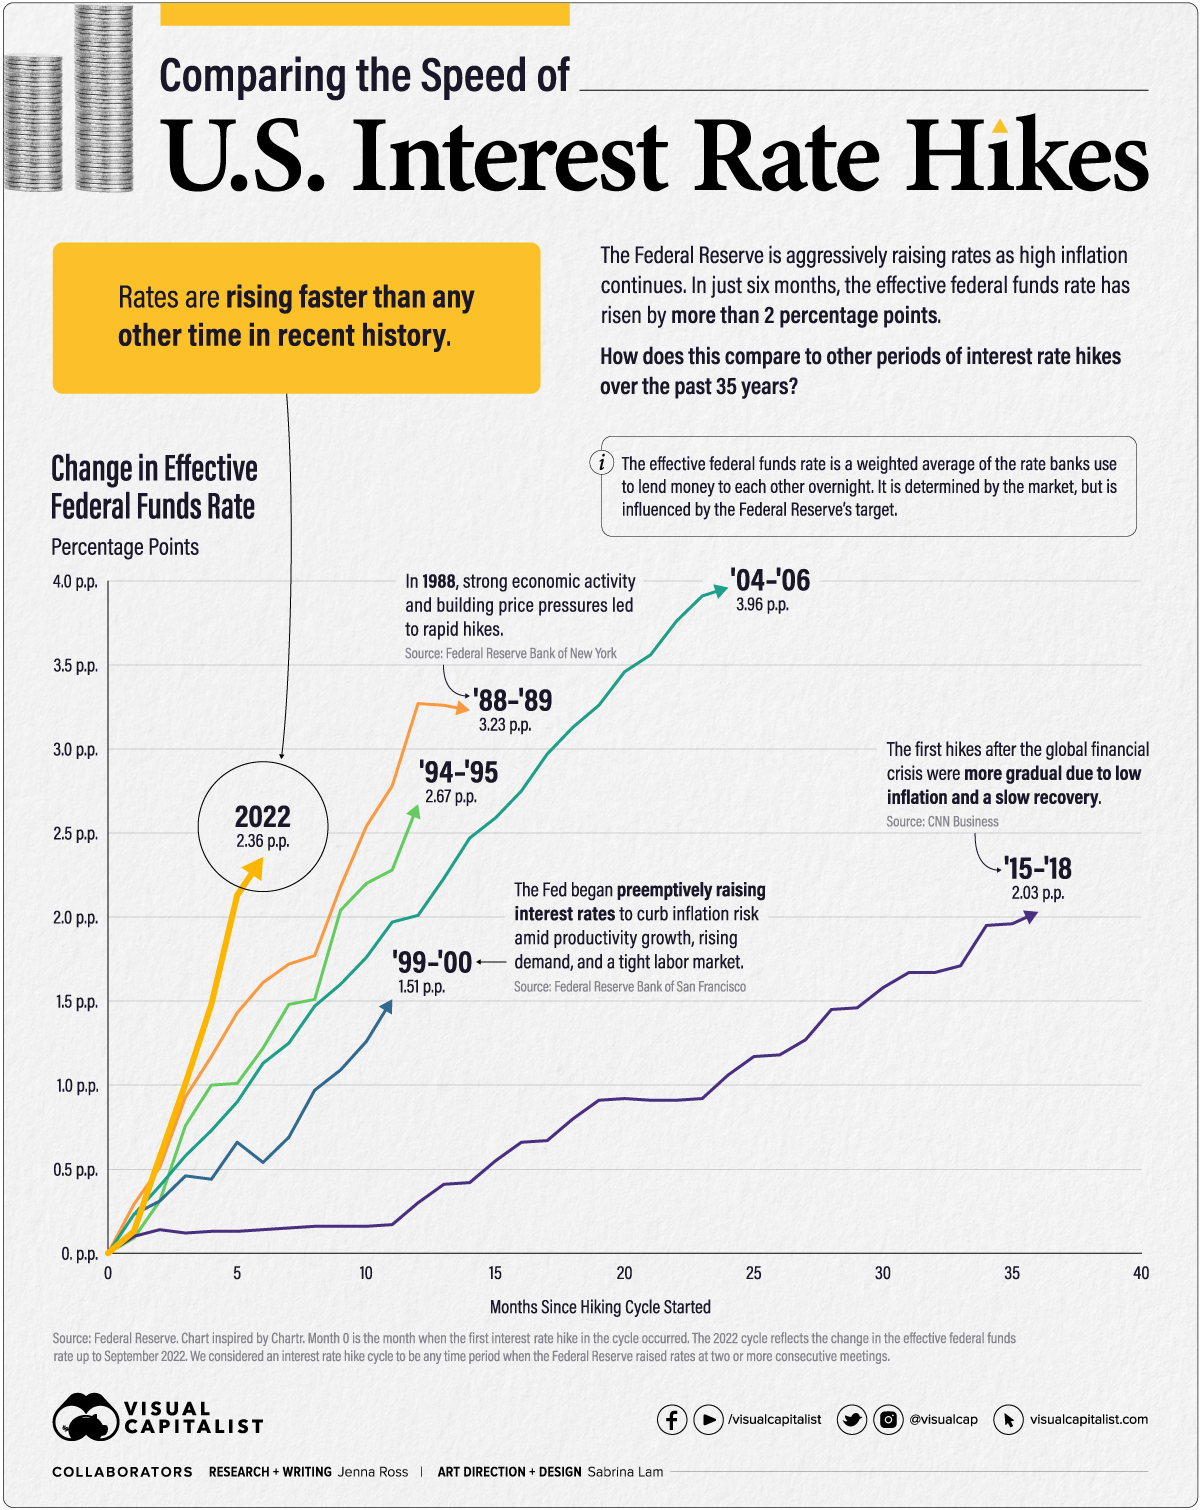


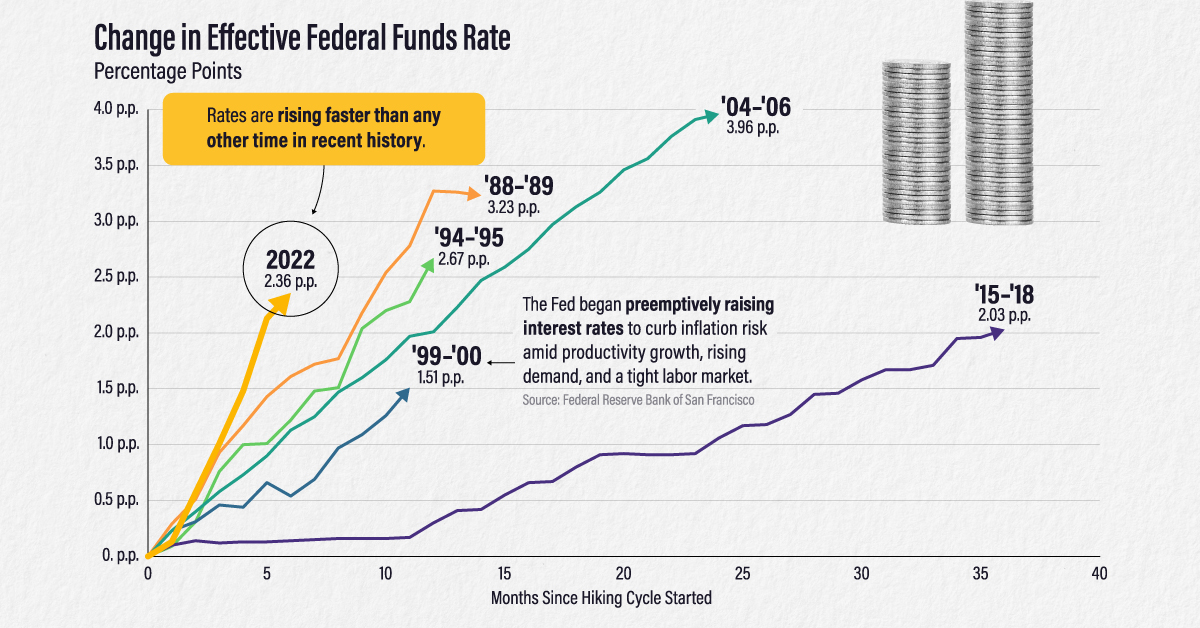
Comparing the Speed of U.S. Interest Rate Hikes
As U.S. inflation remains at multi-decade highs, the Federal Reserve has been aggressive with its interest rate hikes. In fact, rates have risen more than two percentage points in just six months.
In this graphic—which was inspired by a chart from Chartr—we compare the speed and severity of the current interest rate hikes to other periods of monetary tightening over the past 35 years.
Measuring Periods of Interest Rate Hikes
We used the effective federal funds rate (EFFR), which measures the weighted average of the rates that banks use to lend to each other overnight. It is determined by the market but influenced by the Fed’s target range. We considered the starting point for each cycle to be the EFFR during the month when the first rate hike took place.
Here is the duration and severity of each interest rate hike cycle since 1988.
| Time Period | Duration (Months) | Total Change in EFFR (Percentage Points) |
|---|---|---|
| Mar 1988 - May 1989 | 14 | 3.23 |
| Feb 1994 - Feb 1995 | 12 | 2.67 |
| Jun 1999 - May 2000 | 11 | 1.51 |
| Jun 2004 - Jun 2006 | 24 | 3.96 |
| Dec 2015 - Dec 2018 | 36 | 2.03 |
| Mar 2022 - Sep 2022 | 6 | 2.36 |
* We considered a rate hike cycle to be any time period when the Federal Reserve raised rates at two or more consecutive meetings. The 2022 rate hike cycle is ongoing with data as of September 2022.
The 2022 rate hike cycle is the fastest, reaching a 2.36 percentage point increase nearly twice as fast as the rate hike cycle of ‘88-‘89.
On the other hand, the most severe interest rate hikes occurred in the ‘04 – ‘06 cycle when the EFFR climbed by almost four percentage points. It took much longer to reach this level, however, with the hikes taking place over two years.
Timing Interest Rate Hikes
Why are 2022’s interest rate hikes so rapid? U.S. inflation far exceeds the Fed’s long-term target of 2%. In fact, when the hikes started in March 2022, inflation was the highest it’s ever been in the last six rate hike cycles.
| Time Period | Inflation Rate at Start of Cycle |
|---|---|
| Mar 1988 - May 1989 | 3.60% |
| Feb 1994 - Feb 1995 | 2.06% |
| Jun 1999 - May 2000 | 1.40% |
| Jun 2004 - Jun 2006 | 2.89% |
| Dec 2015 - Dec 2018 | 0.30% |
| Mar 2022 - Sep 2022 | 6.77% |
Inflation rate is the year-over-year change as measured by the Personal Consumption Expenditures (PCE) Index.
In contrast, three of the rate hike cycles started with inflation at or below the 2% target. Inflation was just 0.30% in December 2015 when the Fed announced its first rate hike since the global financial crisis.
Some criticized the Fed for raising rates prematurely, but the Fed’s rationale was that it can take up to three years or more for policy actions to affect economic conditions. By raising rates early and gradually, the Fed hoped to avoid surging inflation in the future.
Fast forward to today, and the picture couldn’t look more different. Inflation exceeded the 2% target for 12 months before the Fed began to raise rates. Initially, the Fed believed inflation was “transitory” or short-lived. Now, inflation is a top financial concern and there is a risk that it has gathered enough momentum that it will be difficult to bring down.
Balancing Inflation and Recession Risks
The Fed expects to raise its target rate to around 4.4% by the end of 2022, up from the current range of 3-3.25%. However, they don’t foresee inflation reaching their 2% target until 2025.
In the meantime, the rapid interest rate hikes could lead to an economic downturn. Risks of a global recession have increased as other central banks raise their rates too. The World Bank offers policymakers a number of suggestions to help avoid a recession:
- Central banks can communicate policy decisions clearly to secure inflation expectations and, hopefully, reduce how much they need to raise rates.
- Governments can carefully withdraw fiscal support, develop medium-term spending and tax policies, and provide targeted help to vulnerable households.
- Other economic policymakers can help relieve supply pressures through various measures. For instance, they can introduce policies to increase labor force participation, enhance global trade networks, and bring in measures to reduce energy consumption.
Will policymakers heed this advice and, if so, will it prove sufficient to avoid a global recession?


Markets
The 50 Best One-Year Returns on the S&P 500 (1980-2022)
The highest one-year return among the top S&P 500 stocks from 1980 to 2022 was a staggering 2,620%. Which stocks top the ranks?

The Top S&P 500 Stocks by Annual Returns
The average annual return of the S&P 500 was 10% from 1980-2022, excluding dividends. Of course, there are some companies that deliver much higher returns in any given year.
In this graphic using data from S&P Dow Jones Indices, we explore the top S&P 500 stocks with the best single year returns over the last four decades.
Ranking the Top S&P 500 Stocks
In order to find the top gainers, S&P took the top 10 best-performing stocks each year and then narrowed that list down to the top 50 overall. They ranked the top S&P 500 stocks by price returns, meaning that no dividends or stock distributions were included.
The best gains were clustered in a few select years, including the 1999 dot-com boom, the 2003 stock market rally, and the 2009 recovery from the Global Financial Crisis. None of the biggest gains happened in 2021 or 2022.
| Rank | Company | Sector | Return | Year |
|---|---|---|---|---|
| 1 | Qualcomm | Information Technology | 2620% | 1999 |
| 2 | Tesla | Consumer Discretionary | 743% | 2020 |
| 3 | DSC Communications | Communication Services | 468% | 1992 |
| 4 | Coleco Industries | Consumer Discretionary | 435% | 1982 |
| 5 | Avaya | Information Technology | 428% | 2003 |
| 6 | Chrysler | Consumer Discretionary | 426% | 1982 |
| 7 | XL Capital (Axa XL) | Financials | 395% | 2009 |
| 8 | Tenet Healthcare | Healthcare | 369% | 2009 |
| 9 | Dynegy | Utilities | 361% | 2000 |
| 10 | Advanced Micro Devices | Information Technology | 348% | 2009 |
| 11 | Sprint | Communication Services | 343% | 1999 |
| 12 | Ford | Consumer Discretionary | 337% | 2009 |
| 13 | NEXTEL Communications | Communication Services | 336% | 1999 |
| 14 | LSI Logic | Information Technology | 319% | 1999 |
| 15 | NVIDIA | Information Technology | 308% | 2001 |
| 16 | Nortel Networks | Communication Services | 304% | 1999 |
| 17 | Etsy | Consumer Discretionary | 302% | 2020 |
| 18 | Genworth Financial | Financials | 301% | 2009 |
| 19 | Micron Technology | Information Technology | 300% | 2009 |
| 20 | NetFlix | Communication Services | 298% | 2013 |
| 21 | Oracle | Information Technology | 290% | 1999 |
| 22 | Western Digital | Information Technology | 286% | 2009 |
| 23 | Network Appliance (NetApp) | Information Technology | 270% | 1999 |
| 24 | Data General | Information Technology | 267% | 1991 |
| 25 | Yahoo | Communication Services | 265% | 1999 |
| 26 | Williams Companies | Energy | 264% | 2003 |
| 27 | Novell | Information Technology | 264% | 1991 |
| 28 | Dynegy | Utilities | 263% | 2003 |
| 29 | Sun Microsystems | Information Technology | 262% | 1999 |
| 30 | PMC-Sierra | Information Technology | 262% | 2003 |
| 31 | Advanced Micro Devices | Information Technology | 259% | 1991 |
| 32 | Dell | Information Technology | 248% | 1998 |
| 33 | Global Marine | Energy | 247% | 1980 |
| 34 | Micron Technology | Information Technology | 243% | 2013 |
| 35 | Best Buy | Consumer Discretionary | 237% | 2013 |
| 36 | Reebok | Consumer Discretionary | 234% | 2000 |
| 37 | Freeport-McMoRan | Materials | 229% | 2009 |
| 38 | Biomet (Zimmer Biomet) | Healthcare | 226% | 1991 |
| 39 | NVIDIA | Information Technology | 224% | 2016 |
| 40 | Gap | Consumer Discretionary | 223% | 1991 |
| 41 | NetFlix | Communication Services | 219% | 2010 |
| 42 | Fleetwood Enterprises (Fleetwood RV) | Consumer Discretionary | 217% | 1982 |
| 43 | National Semiconductor | Information Technology | 217% | 1999 |
| 44 | Dell | Information Technology | 216% | 1997 |
| 45 | Tandy Corp (RadioShack) | Information Technology | 216% | 1980 |
| 46 | Novell | Information Technology | 215% | 2003 |
| 47 | Corning | Information Technology | 215% | 2003 |
| 48 | CB Richard Ellis (CBRE) | Real Estate | 214% | 2009 |
| 49 | AES Corp | Utilities | 213% | 2003 |
| 50 | Expedia | Consumer Discretionary | 212% | 2009 |
Qualcomm was by far the top-performer in any one calendar year window. The company had key patents for Code Division Multiple Access (CDMA) technology, which enabled fast wireless internet access and became the basis for 3G networks.
Its stock took off in 1999 as it shed less profitable business lines, resolved a patent dispute with competitor Ericsson, and joined the S&P 500 Index. At the time, CNN reported that one lucky investor who heard about Qualcomm from an investment-banker-turned-rabbi earned $17 million—roughly $30 million in today’s dollars.
The most recent stocks to make the rankings were both from 2020: well-known Tesla (#2) and lesser-known online marketplace Etsy (#17), which saw sales from independent creators surge during the early COVID-19 pandemic. The dollar value of items sold on Etsy more than doubled from $5.3 billion in 2019 to $10.3 billion in 2020, with mask sales accounting for 7% of the total.
Biggest Gainers in Each Sector
While information technology stocks made up nearly half of the list, there is representation from nine of the 11 S&P 500 sectors. No companies from the Industrials or Consumer Staples sectors made it into the ranks of the top S&P 500 stocks by annual returns.
Below, we show the stock with the best annual return for each sector.

Tesla was the top-performing Consumer Discretionary stock on the list. After meeting the requirement of four consecutive quarters of positive earnings, it joined the S&P 500 Index on December 21, 2020. The company’s performance was boosted by the announcement that it would be included in the S&P 500, along with strong performance in China, and general EV buzz as environmental regulations tightened worldwide.
In the realm of Communication Services, DSC Communications saw a sizable return in 1992. The telecommunications equipment company had contracts with major companies such as Bell and Motorola. Alcatel-Lucent (then Alcatel), a French producer of mobile phones, purchased DSC Communications in 1998.
Serial Success Stories
It’s impressive to make the list of the top S&P 500 stocks by calendar returns once, but there are seven companies that have done it twice.
Some stocks saw their repeated outperformance close together, with Dell making the ranks back-to-back in 1997 and 1998.

On the other hand, a select few have more staying power. Computing giant NVIDIA topped the charts in 2001 and triumphed again 15 years later in 2016. And this year might be another win, as the company has recently reached a $1 trillion market capitalization and has the highest year-to-date return in the S&P 500 as of July 6, 2023.
-

 Energy3 weeks ago
How Old Are the World’s Nuclear Reactors?
-

 Countries7 days ago
Mapped: World’s Top 40 Largest Military Budgets
-

 Markets3 weeks ago
How Big is the Market for Crude Oil?
-

 Maps6 days ago
Mapped: The Safest Cities in the U.S.
-

 Markets2 weeks ago
Ranked: The Most Profitable U.S. Companies, by Sector
-

 apps5 days ago
How Long it Took for Popular Apps to Reach 100 Million Users
-

 Markets4 weeks ago
The World’s Biggest Mutual Fund and ETF Providers
-

 Business2 weeks ago
Brand Reputations: Ranking the Best and Worst in 2023