Demographics
Visualizing the American Workforce as 100 People
Click to view this graphic in a higher-resolution.
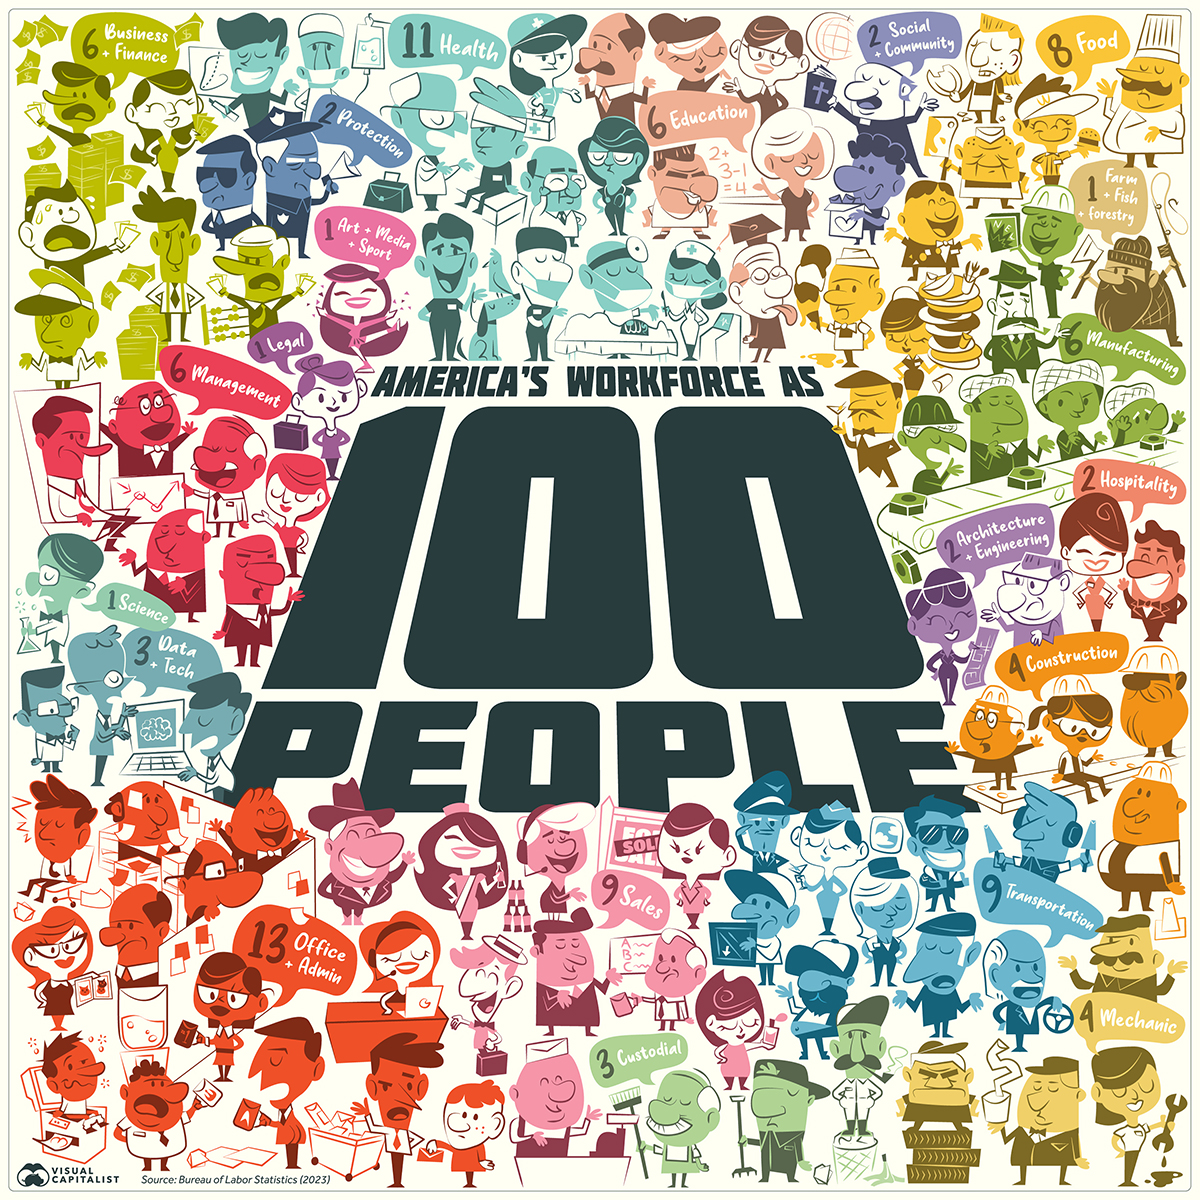


Visualizing the American Workforce as 100 People
In 2022, the U.S. population stood at 333 million. Of that, roughly 60% were employed in various jobs, positions, and sectors in the U.S. economy.
But where did all these people work? What jobs did they do and what positions did they hold? Where do most Americans do their nine-to-five?
Using data from the National Occupational Employment and Wage Estimates (2022) put out by the U.S. Bureau of Labor Statistics (BLS), we reimagine the employed American workforce as only 100 people, to find out answers.
Interestingly, the data contains a mix of information demarcations. Some are job-specific (type of work), some are based on position (like Management), and some are broken down by industry (Transport and Health).
The Most Common Jobs In the U.S.
By far, most of the American workforce (13 out of 100) are employed in Office & Administrative work. This includes a mind-boggling variety of jobs: receptionists, payroll clerks, secretaries, proof-readers, administrative assistants, and customer service representatives to name a few.
Notably, any sort of management role is absent from this, as well as any other job categories, since the BLS categorizes managers in their own class.
The industry which employs the second largest group of people is Health, accounting for 11 people from the 100. This category is a combination of two sectors listed in the original dataset (healthcare practitioners and healthcare support) and covers the entire industry: from physicians, surgeons, veterinarians, nurses, and therapists to technicians, assistants, orderlies, and home and personal care aides.
Here’s a quick look at all the major sectors most of America’s workforce actually works in.
| Rank | Jobs | People | Examples |
|---|---|---|---|
| 1. | Office & Admin | 13 | Receptionists, Clerks, Customer service, Secretaries. |
| 2. | Health | 11 | Doctors, Nurses, Paramedics, Vets, Orderlies, Personal care aides. |
| 3. | Transport | 9 | Warehouse workers, Packagers, Pilots, Ambulance, Bus, Truck, Taxi drivers, Ship captains. |
| 4. | Sales | 9 | Sales representatives, Counter clerks. |
| 5. | Food | 8 | Food preparers & servers, Bartenders, Dishwashers, Hosts. |
| 6. | Management | 6 | Legislators, Chief executives, Directors, General & Operations managers. |
| 7. | Business & Finance | 6 | Accountants, Auditors, Financial analysts, Logisticians. |
| 8. | Manufacturing | 6 | Factory workers, Gas fitters, Machine operators, Cobblers, Tailors, Barbers. |
| 9. | Education | 6 | Teachers (all fields, all levels). |
| 10. | Construction & Extraction | 4 | Stone / brick / block / cement masons. Construction laborers. Roofers, Plumbers, Electricians, Mining workers. |
| 11. | Mechanics & Installation | 4 | Auto mechanic, Farm equipment mechanic, Home appliance mechanic, Locksmiths. |
| 12. | Data & Tech | 3 | Information analyst, Database architect, Software & Web developers, Data scientists, Mathematicians, Computer support. |
| 13. | Custodial | 3 | Cleaning, Groundskeeping, Landscaping, Housekeeping. |
| 14. | Protection | 2 | Cops, Firefighters, Security guards, Lifeguards, Correctional officers. |
| 15. | Hospitality | 2 | Animal trainers / caretakers. Ushers / attendants. Makeup artists. Concierge. Exercise trainers. |
| 16. | Architecture & Engineering | 2 | All engineers and architects (excluding the information industry). |
| 17. | Community & Social Service | 2 | Social workers, Therapists (counsellors) & Religious work. |
| 18. | Arts, Media, & Sport | 1 | Fine artists, Designers, Actors, Athletes, Journalists, Writers, Authors, Musicians. |
| 19. | Science | 1 | All scientists (not engineers). |
| 20. | Legal | 1 | Lawyers, Judges, Paralegals, Mediators. |
| 21. | Farming, Fishing, & Forestry | 1 | Farmers, logging workers. |
| Total | 100 |
The third most common job is actually a tie between Transport—cargo moving workers, pilots, truck drivers—and Sales—retail and industry sales agents, counter clerks—with both sectors employing nine of the 100 people. In the Sales category, two of the nine people are cashiers.
Ranked fifth is Food, with eight people, ranging from private chefs to serving staff at fast food restaurants.
Another six all belong in some kind of Management role (across industry, and including legislators) with two of those six being “top level executives” like a CEO, a general manager, a mayor, or university president. Management shares its spot with Business & Finance, Manufacturing, and Education, all at six each.
The following jobs or industries also employ the same number of people:
- Construction & Extraction along with Mechanics & Installation, at four each.
- Data & Tech, with Custodial jobs, with three each.
- Protection, Hospitality, Architecture & Engineering, and Social work, all at two each.
- Artists & Athletes, Scientists, Legal, and Farming, Fishing & Forestry are all one each.
Quirks of the Job Data
From the numbers, some fascinating nuances of the American workforce are revealed. For example, there are more cashiers (2) in the economy than artists, writers, designers & athletes (1). There are the same number of customer service representatives as the entire Scientific and Legal fields put together (2).
But perhaps the most interesting quirk comes from how few people are employed in the Farming, Fishing & Forestry industry, a critical primary sector. In raw data, the BLS estimates only slightly more than 450,000 farm, fish & forestry workers.
Importantly, it’s worth noting the BLS only collects data from “nonfarm” establishments, explaining the low estimate for their category, which is almost one-sixth of what the USDA estimates. Please see the data note at the end of this article for a full explanation.
Which Jobs Have the Highest Wages in the U.S.?
Meanwhile, the top 20 highest paid jobs (by annual average wages) all belong to doctors (usually specialists or surgeons), with two exceptions: CEOs and athletes.
The lowest-paid jobs are a mix of entertainers, and service and retail staff.
As a broader category, however, Management makes the most money, followed by Legal and then Tech. Workers in Food, Health Support, and Custodial jobs have the lowest wages.
| Rank | Jobs | Annual Average Wages |
|---|---|---|
| 1. | Management | $131,200 |
| 2. | Legal | $124,540 |
| 3. | Data & Tech | $108,130 |
| 4. | Health (Practitioners) | $96,770 |
| 5. | Architecture & Engineering | $94,670 |
| 6. | Business & Finance | $86,080 |
| 7. | Scientists | $83,640 |
| 8. | Arts, Media, Sports | $76,500 |
| 9. | Education | $63,240 |
| 10. | Construction & Extraction | $58,400 |
| 11. | Community & Social Service | $55,760 |
| 12. | Mechanics & Installation | $55,680 |
| 13. | Protection | $54,010 |
| 14. | Sales | $50,370 |
| 15. | Office & Admin | $45,550 |
| 16. | Manufacturing | $45,370 |
| 17. | Transport | $43,930 |
| 18. | Farming, Fishing, & Forestry | $37,870 |
| 20. | Hospitality | $36,210 |
| 19. | Custodial | $35,900 |
| 21. | Health (Support) | $35,560 |
| 22. | Food | $32,130 |
Analyzing the data throws up a few correlations between number of employees and wages. The top three sectors with the most jobs (Admin, Transport, and Sales) are in the bottom 10 categories when it comes to pay.
On the other hand, three sectors in the bottom 10 of employment numbers, (Data & Tech, Architecture & Engineering, and Legal) are in the top five highest paid sectors.
The Health sector sees a big divide in pay between practitioners (doctors, nurses, therapists) ranked 5th and support staff (assistants, aides, & orderlies), ranked 21st, or second-to-last.
How is the American Workforce Changing?
Over the last five years, the American workforce has not stayed static. Of the listed 22 groups, 13 saw growth in employment numbers, nine saw a decrease, and one stayed flat since 2018.
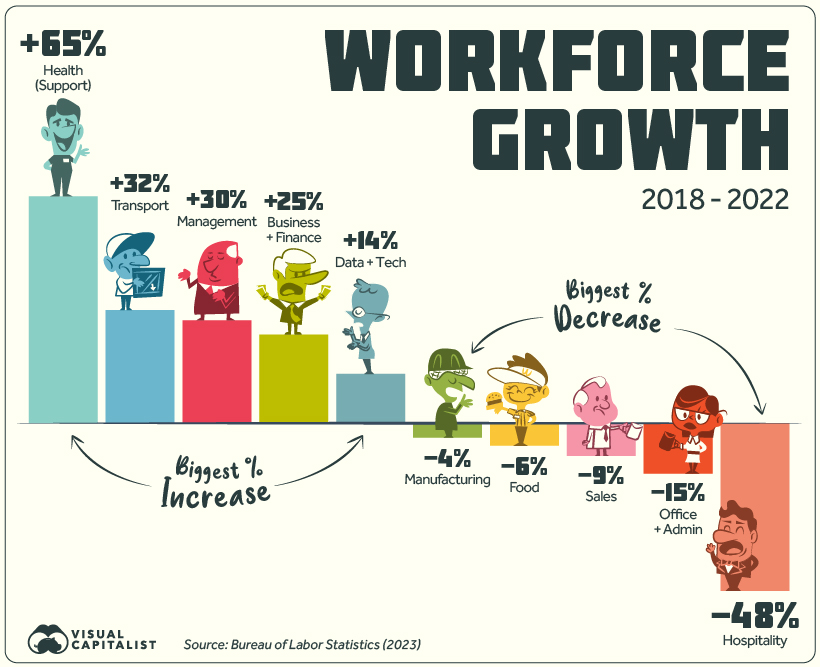
The top gainer by far is Health Support (medical assistants, care aides, orderlies, etc.) which grew by 65%. Looking at the timeline of growth does not paint a steady picture: employment jumped between 2018 and 2019, briefly fell in 2020, and has since risen again in 2021-2022.
Another top gainer is Transport, rising from the 4th to 3rd biggest employer, beating out Sales in 2022. Business & Finance and Management have also seen steady increases since 2018.
On the other hand Hospitality saw a staggering 48% drop in numbers, not all together surprising given the impact of the COVID-19 pandemic as well as the rise of tech companies like Airbnb.
Meanwhile, Office & Admin work saw a 15% loss in employees, even though this category is still the biggest employer in the country by a significant margin. Although jobs in this group saw steady declines from 2018-2021, it registered a slight uptick in workers between 2021 and 2022.
Here’s a full list of top-level sectors and how they changed.
| Jobs | 2018 | 2022 | % Change (2018-2022) |
|---|---|---|---|
| Health Support | 4,117,450 | 6,792,310 | +65% |
| Transport | 10,244,260 | 13,560,460 | +32% |
| Management | 7,616,650 | 9,860,740 | +29% |
| Business & Finance | 7,721,300 | 9,677,720 | +25% |
| Data & Tech | 4,384,300 | 5,003,910 | +14% |
| Sciences | 1,171,910 | 1,314,360 | +12% |
| Legal | 1,127,900 | 1,216,600 | +7% |
| Community & Social Service | 2,171,820 | 2,313,620 | +7% |
| Arts, Media, & Sports | 1,951,170 | 2,063,380 | +6% |
| Health Practioners | 8,646,730 | 9,043,070 | +5% |
| Mechanics and Installataion | 5,628,880 | 5,823,400 | +3% |
| Construction & Extraction | 5,962,640 | 6,075,520 | +2% |
| Protection | 3,437,410 | 3,437,610 | 0% |
| Custodial | 4,421,980 | 4,316,350 | -2% |
| Architecture & Engineering | 2,556,220 | 2,481,170 | -3% |
| Education | 8,779,780 | 8,496,780 | -3% |
| Farming, Fishing, & Forestry | 480,130 | 461,750 | -4% |
| Manufacturing | 9,115,530 | 8,738,980 | -4% |
| Food | 13,374,620 | 12,514,620 | -6% |
| Sales and Related | 14,542,290 | 13,183,250 | -9% |
| Office & Admin | 21,828,990 | 18,674,770 | -15% |
| Hospitality | 5,451,330 | 2,835,650 | -48% |
Looking ahead, questions about the future of the American workforce loom large, especially in the wake of the AI revolution that has swept imaginations, and quite possibly, soon the economy. People who hold administrative jobs—the largest category—are most vulnerable since many office tasks can be automated with increasingly sophisticated AI tools.
Will AI be as dominating a factor as the Industrial Revolution on the global economy? Will it cause as big a shift as the offshoring of manufacturing from the U.S.?
Or will AI blend seamlessly into the current make-up of the American workforce, merely enhancing productivity and profit?
Source: U.S. Bureau of Labor Statistics (BLS).
Data note 1: Categories from the original data were modified slightly for better readability. Some have been renamed all together. They are:
- Production, listed as Manufacturing.
- Installation, maintenance and repair, listed as Mechanics & Installation.
- Computer and mathematical operations, listed as Data & tech.
- Building and groundskeeping, listed as Custodial.
- Personal care and service, listed as Hospitality.
- Life, physical, social science, listed as Science.
Data note #2: OES data is a combination of surveys conducted by the BLS and estimates are produced for over 800 jobs in the country. The survey collects occupational employment and wage data from establishments in nonfarm industries only and doesn’t survey the following: Crop production, Animal production, Timber tract operations, Forest nurseries & gathering of forest products, Fishing, hunting, and trapping, Forestry support activities, and Private households.
The survey also does not cover the self-employed, owners and partners in unincorporated firms, household workers, or unpaid family workers.
Data note #3: On the calculating end, due to rounding of each category and the 100 workers total, some categories can have slightly more or less workers, depending on the method use. In 2022, both Management and Business & Finance employment can be rounded up to 7 workers each. On the other hand, Farm, Fishing and Forestry can be rounded down to 0. Our rounding was done to provide as wide a scope of the economy as possible, while also maintaining accuracy.
Finally, percentage change in employment per sector was not adjusted for general population or employment growth from 2018 to 2022.


Countries
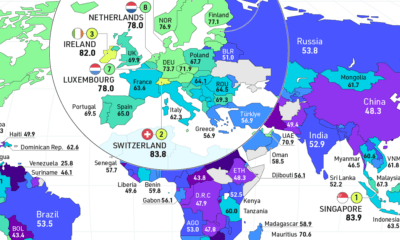
Mapped: World’s Top 40 Largest Military Budgets
War in Europe has caused Ukraine’s military spend to jump up by 640%. How do the world’s largest military budgets compare?
Mapped: World’s Top 40 Largest Military Budgets
In the final year of World War II, the U.S. spent about 38% of its GDP on its military. When adjusted for inflation, the military budget over those four years of war came to a staggering $4.1 trillion in 2020 dollars.
Almost 80 years later, modern day military spending isn’t much of a far cry from World War II budgets. The top spenders have continued to increase their military capabilities, while war in Ukraine has caused countries in the region to re-evaluate their budgets as well.
In 2022, global military budgets hit an all-time high of $2.2 trillion, according to data released by Stockholm International Peace Research Institute (SIPRI), the eighth consecutive year of increase. This post looks at the top 40 largest military budgets in the world.
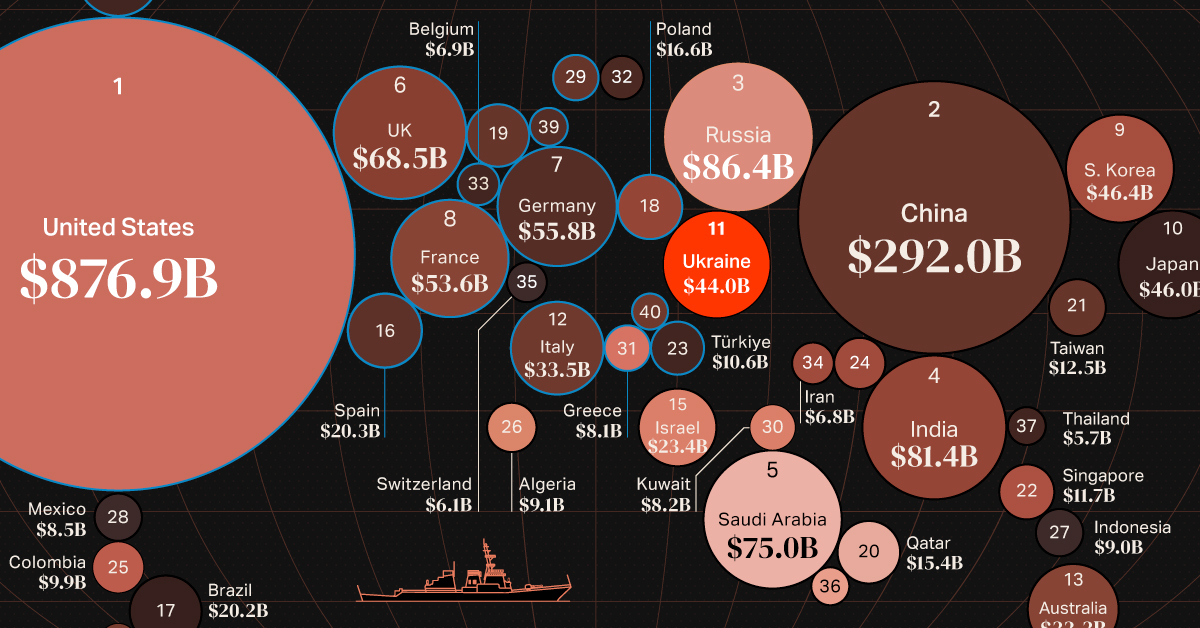
The Largest Military Budgets in 2022
The United States accounts for almost 40% of global military expenditures, with its 2022 spend coming to $877 billion.
Here are the top 40 largest military budgets in the world for 2022 in U.S. dollars:
| Rank | Country | Military Budget (Billions) | % of World Military Spend |
|---|---|---|---|
| 1 | 🇺🇸 U.S. | $876.9 | 39.0% |
| 2 | 🇨🇳 China | $292.0 | 13.0% |
| 3 | 🇷🇺 Russia | $86.4 | 3.9% |
| 4 | 🇮🇳 India | $81.4 | 3.6% |
| 5 | 🇸🇦 Saudi Arabia | $75.0 | 3.3% |
| 6 | 🇬🇧 UK | $68.5 | 3.1% |
| 7 | 🇩🇪 Germany | $55.8 | 2.5% |
| 8 | 🇫🇷 France | $53.6 | 2.4% |
| 9 | 🇰🇷 South Korea | $46.4 | 2.1% |
| 10 | 🇯🇵 Japan | $46.0 | 2.1% |
| 11 | 🇺🇦 Ukraine | $44.0 | 2.0% |
| 12 | 🇮🇹 Italy | $33.5 | 1.5% |
| 13 | 🇦🇺 Australia | $32.3 | 1.4% |
| 14 | 🇨🇦 Canada | $26.9 | 1.2% |
| 15 | 🇮🇱 Israel | $23.4 | 1.0% |
| 16 | 🇪🇸 Spain | $20.3 | 0.9% |
| 17 | 🇧🇷 Brazil | $20.2 | 0.9% |
| 18 | 🇵🇱 Poland | $16.6 | 0.7% |
| 19 | 🇳🇱 Netherlands | $15.6 | 0.7% |
| 20 | 🇶🇦 Qatar | $15.4 | 0.7% |
| 21 | 🇹🇼 Taiwan | $12.5 | 0.6% |
| 22 | 🇸🇬 Singapore | $11.7 | 0.5% |
| 23 | 🇹🇷 Türkiye | $10.6 | 0.5% |
| 24 | 🇵🇰 Pakistan | $10.3 | 0.5% |
| 25 | 🇨🇴 Colombia | $9.9 | 0.4% |
| 26 | 🇩🇿 Algeria | $9.1 | 0.4% |
| 27 | 🇮🇩 Indonesia | $9.0 | 0.4% |
| 28 | 🇲🇽 Mexico | $8.5 | 0.4% |
| 29 | 🇳🇴 Norway | $8.4 | 0.4% |
| 30 | 🇰🇼 Kuwait | $8.2 | 0.4% |
| 31 | 🇬🇷 Greece | $8.1 | 0.4% |
| 32 | 🇸🇪 Sweden | $7.7 | 0.3% |
| 33 | 🇧🇪 Belgium | $6.9 | 0.3% |
| 34 | 🇮🇷 Iran | $6.8 | 0.3% |
| 35 | 🇨🇭 Switzerland | $6.1 | 0.3% |
| 36 | 🇴🇲 Oman | $5.8 | 0.3% |
| 37 | 🇹🇭 Thailand | $5.7 | 0.3% |
| 38 | 🇨🇱 Chile | $5.6 | 0.2% |
| 39 | 🇩🇰 Denmark | $5.5 | 0.2% |
| 40 | 🇷🇴 Romania | $5.2 | 0.2% |
China, ranked second in absolute terms, accounts for another 13% of world military expenditure at $292 billion.
Russia, India and Saudi Arabia round out the top five biggest military budgets in 2022. Add in the UK to the mix (#6 rank), and these countries all had military expenditures that made up at least 3% of global spend.
Comparatively, the lowest budgets on the top 40 ranged include Romania at $5.2 billion, Denmark at $5.5 billion, and Chile at $5.6 billion. They each account for just 0.2% of the world’s military budgets in 2022, and of course there are many countries with even smaller spends.
Largest Military Budget Increases in 2022
Russia’s position as the third-largest military spender is a recent development, as the country’s military spend had a 9% increase between 2021 and 2022, according to SIPRI estimates.
On the other side of Russia’s invasion, Ukraine was the top 40 military budget with the largest annual increase in 2022, surging nearly six and a half times above its 2021 expenditures.
| Country | % Change (2021-2022) | Rank Change (2021-2022) |
|---|---|---|
| 🇺🇦 Ukraine | 640% | +25 |
| 🇶🇦 Qatar | 27% | +2 |
| 🇸🇦 Saudi Arabia | 16% | +3 |
| 🇧🇪 Belgium | 13% | 0 |
| 🇳🇱 Netherlands | 12% | 0 |
| 🇸🇪 Sweden | 12% | -1 |
| 🇵🇱 Poland | 11% | 0 |
| 🇷🇺 Russia | 9.2% | +2 |
| 🇩🇰 Denmark | 8.8% | +3 |
| 🇪🇸 Spain | 7.3% | -1 |
| 🇳🇴 Norway | 6.2% | 0 |
| 🇮🇳 India | 6.0% | -1 |
| 🇯🇵 Japan | 5.9% | -1 |
| 🇮🇷 Iran | 4.6% | +5 |
| 🇨🇳 China | 4.2% | 0 |
| 🇬🇧 UK | 3.7% | -2 |
| 🇨🇦 Canada | 3.0% | -1 |
| 🇸🇬 Singapore | 2.8% | +1 |
| 🇩🇪 Germany | 2.3% | 0 |
| 🇮🇩 Indonesia | 1.3% | 0 |
| 🇨🇴 Colombia | 1.1% | -1 |
| 🇺🇸 U.S. | 0.7% | 0 |
| 🇫🇷 France | 0.6% | -2 |
| 🇬🇷 Greece | 0.6% | -1 |
| 🇨🇭 Switzerland | 0.4% | -1 |
| 🇹🇼 Taiwan | 0.4% | -1 |
| 🇦🇺 Australia | 0.3% | -1 |
| 🇵🇰 Pakistan | -2.0% | -3 |
| 🇰🇷 South Korea | -2.5% | +1 |
| 🇷🇴 Romania | -2.6% | +1 |
| 🇴🇲 Oman | -3.0% | +1 |
| 🇩🇿 Algeria | -3.7% | -1 |
| 🇮🇱 Israel | -4.2% | -1 |
| 🇮🇹 Italy | -4.5% | -1 |
| 🇨🇱 Chile | -6.2% | -3 |
| 🇧🇷 Brazil | -7.9% | -1 |
| 🇲🇽 Mexico | -9.7% | 0 |
| 🇰🇼 Kuwait | -11% | -4 |
| 🇹🇭 Thailand | -11% | -5 |
| 🇹🇷 Türkiye | -26% | -6 |
Ukraine’s dramatic increase represents the highest single-year jump ever recorded by SIPRI, painting a vivid before-and-after picture of a nation engaged in conflict.
Although no other country comes close in matching Ukraine’s surge in defense spending, Qatar saw a substantial increase of 27% over the last year, marking a continuing trend over the last decade of significantly bolstering its military.
Additionally, Saudi Arabia, along with four European nations (Belgium, the Netherlands, Sweden, and Poland), have registered year-over-year changes of over 10%.
On the flipside, 13 of the nations with the largest military budgets decreased spend from 2021, including top 15 spenders such as South Korea, Italy, and Israel.
The largest drop was seen by Türkiye, with an estimated 26% reduction in military budget. This drop may be linked to Türkiye’s inflation problem, which saw prices rise 72.3% in 2022—effectively decreasing the purchasing power of their currency in relative terms to other nations.
The Specter of War in Europe
With an ongoing conflict in the region and large financial powerhouses, its no surprise that eight of the top 10 countries with the most significant increases in military spending are located in Europe.
Consequently, European military budgets have reached levels not witnessed since the end of the Cold War.
And amid escalating geopolitical concerns, countries in Asia such as India, Japan, and China have also ramped up their defense spending. This is an indication of simmering global flashpoints such as India and China’s border skirmishes, the longstanding South China Sea territorial conflict, and concerns surrounding Taiwan’s sovereignty.
Source: Stockholm International Peace Research Institute (SIPRI).
Data note: SIPRI’s military expenditure data collection began in 1949, thus its records do not account for all expenditure that occurred during both World Wars.
Please see SIPRI’s methodologies page for more details on how they collect their data and create estimates.

-

 United States3 weeks ago
Visualized: The 100 Largest U.S. Banks by Consolidated Assets
-

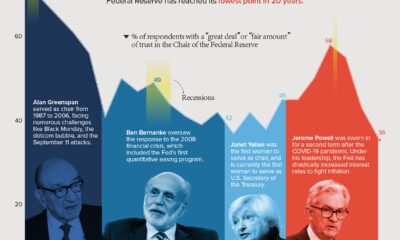
 AI1 week ago
Charted: Changing Sentiments Towards AI in the Workplace
-

 VC+3 weeks ago
What are Top Investment Managers Holding in Their Portfolios?
-

 Markets1 week ago
The 50 Best One-Year Returns on the S&P 500 (1980-2022)
-

 Markets3 weeks ago
Chart: U.S. Home Price Growth Over 50 Years
-

 Crime1 week ago
Mapped: The Most Dangerous Cities in the U.S.
-

 Energy3 weeks ago
How Old Are the World’s Nuclear Reactors?
-

 Countries7 days ago
Mapped: World’s Top 40 Largest Military Budgets