Investor Education
Visualizing The World’s Largest Sovereign Wealth Funds


Visualized: The World’s Largest Sovereign Wealth Funds
Did you know that some of the world’s largest investment funds are owned by national governments?
Known as sovereign wealth funds (SWF), these vehicles are often established with seed money that is generated by government-owned industries. If managed responsibly and given a long enough timeframe, an SWF can accumulate an enormous amount of assets.
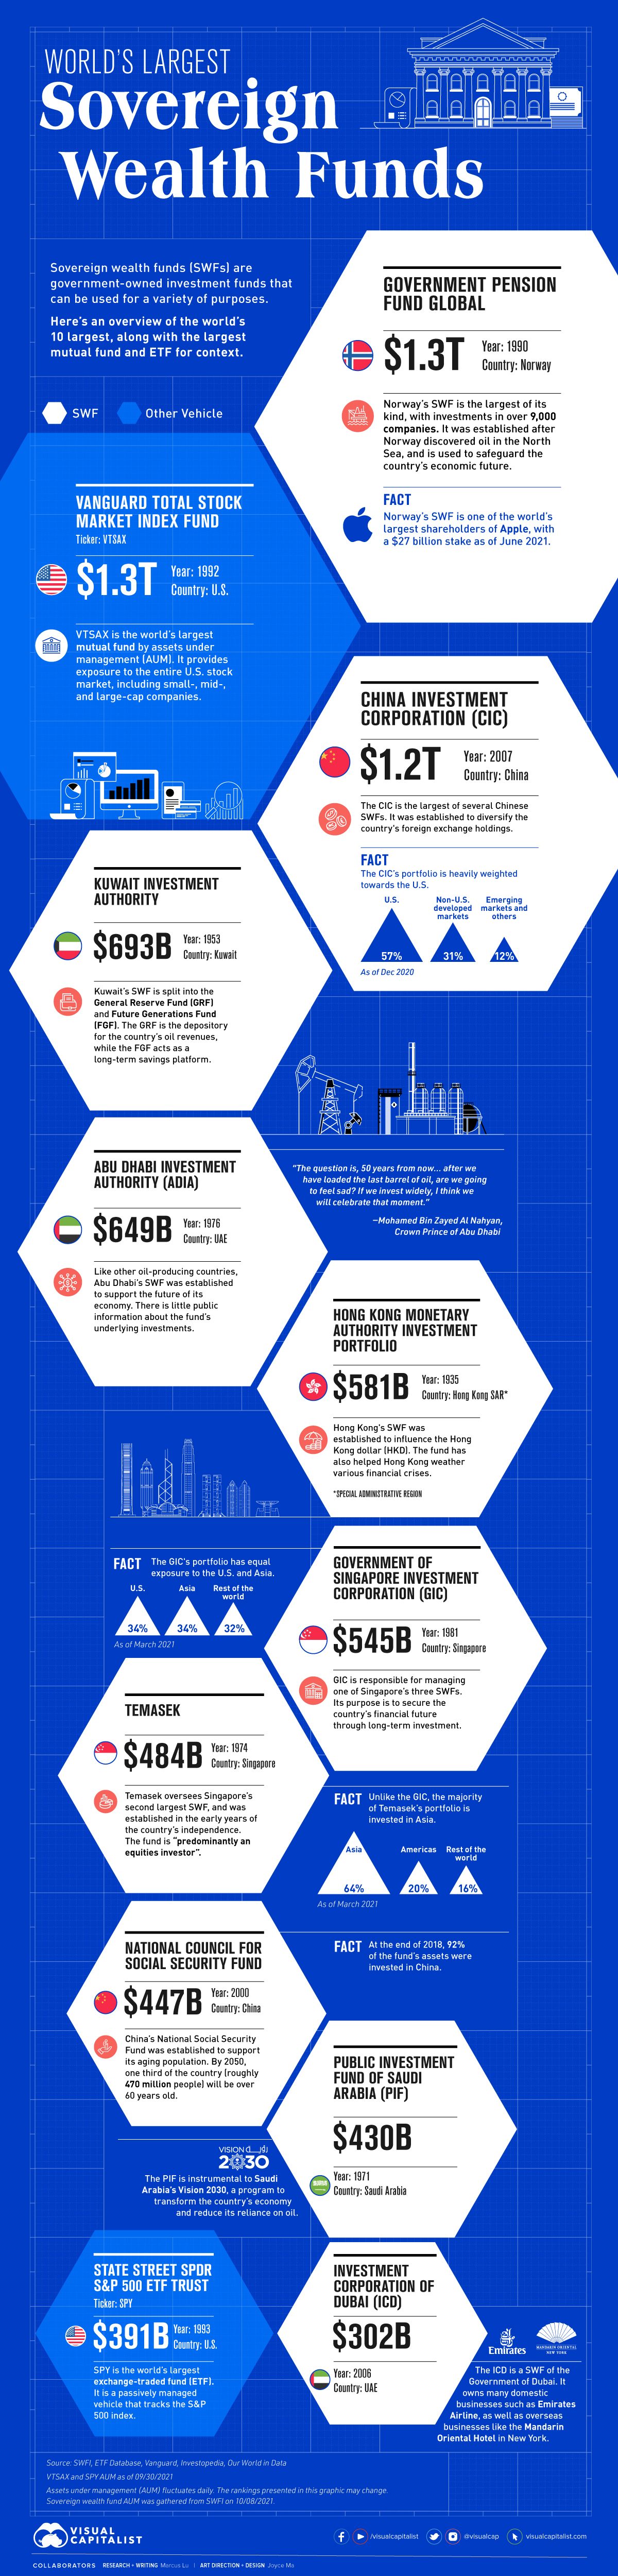
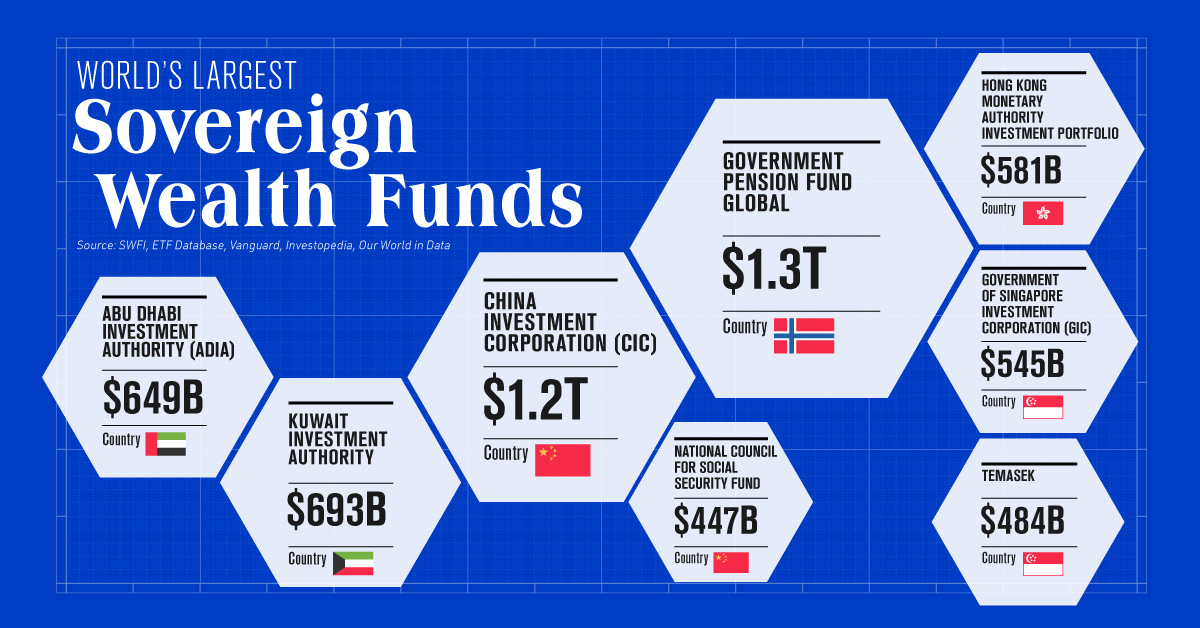
In this infographic, we’ve detailed the world’s 10 largest SWFs, along with the largest mutual fund and ETF for context.
The Big Picture
Data collected from SWFI in October 2021 ranks Norway’s Government Pension Fund Global (also known as the Norwegian Oil Fund) as the world’s largest SWF.
The world’s 10 largest sovereign wealth funds (with fund size benchmarks) are listed below:
| Country | Fund Name | Fund Type | Assets Under Management (AUM) |
|---|---|---|---|
| 🇳🇴 Norway | Government Pension Fund Global | SWF | $1.3 trillion |
| 🇺🇸 U.S. | Vanguard Total Stock Market Index Fund | Mutual fund | $1.3 trillion |
| 🇨🇳 China | China Investment Corporation | SWF | $1.2 trillion |
| 🇰🇼 Kuwait | Kuwait Investment Authority | SWF | $693 billion |
| 🇦🇪 United Arab Emirates | Abu Dhabi Investment Authority | SWF | $649 billion |
| 🇭🇰 Hong Kong SAR | Hong Kong Monetary Authority Investment Portfolio | SWF | $581 billion |
| 🇸🇬 Singapore | Government of Singapore Investment Corporation | SWF | $545 billion |
| 🇸🇬 Singapore | Temasek | SWF | $484 billion |
| 🇨🇳 China | National Council for Social Security Fund | SWF | $447 billion |
| 🇸🇦 Saudi Arabia | Public Investment Fund of Saudi Arabia | SWF | $430 billion |
| 🇺🇸 U.S. | State Street SPDR S&P 500 ETF Trust | ETF | $391 billion |
| 🇦🇪 United Arab Emirates | Investment Corporation of Dubai | SWF | $302 billion |
SWF AUM gathered on 10/08/2021. VTSAX and SPY AUM as of 09/30/2021.
So far, just two SWFs have surpassed the $1 trillion milestone. To put this in perspective, consider that the world’s largest mutual fund, the Vanguard Total Stock Market Index Fund (VTSAX), is a similar size, investing in U.S. large-, mid-, and small-cap equities.
The Trillion Dollar Club
The world’s two largest sovereign wealth funds have a combined $2.5 trillion in assets. Here’s a closer look at their underlying portfolios.
1. Government Pension Fund Global – $1.3 Trillion (Norway)
Norway’s SWF was established after the country discovered oil in the North Sea. The fund invests the revenue coming from this sector to safeguard the future of the national economy. Here’s a breakdown of its investments.
| Asset Class | % of Total Assets | Country Diversification | Number of Securities |
|---|---|---|---|
| Public Equities | 72.8% | 69 countries | 9,123 companies |
| Fixed income | 24.7% | 45 countries | 1,245 bonds |
| Real estate | 2.5% | 14 countries | 867 properties |
As of 12/31/2020
Real estate may be a small part of the portfolio, but it’s an important component for diversification (real estate is less correlated to the stock market) and generating income. Here are some U.S. office towers that the fund has an ownership stake in.
| Address | Ownership Stake |
|---|---|
| 601 Lexington Avenue, New York, NY | 45.0% |
| 475 Fifth Avenue, New York, NY | 49.9% |
| 33 Arch Street, Boston, MA | 49.9% |
| 100 First Street, San Francisco, CA | 44.0% |
As of 12/31/2020
Overall, the fund has investments in 462 properties in the U.S. for a total value of $14.9 billion.
2. China Investment Corporation (CIC) – $1.2 Trillion (China)
The CIC is the largest of several Chinese SWFs, and was established to diversify the country’s foreign exchange holdings.
Compared to the Norwegian fund, the CIC invests in a greater variety of alternatives. This includes real estate, of course, but also private equity, private credit, and hedge funds.
| Asset Class | % of Total Assets |
|---|---|
| Public equities | 38% |
| Fixed income | 17% |
| Alternative assets | 43% |
| Cash | 2% |
As of 12/31/2020
A primary focus of the CIC has been to increase its exposure to American infrastructure and manufacturing. By the end of 2020, 57% of the fund was invested in the United States.
“According to our estimate, the United States needs at least $8 trillion in infrastructure investments. There’s not sufficient capital from the U.S. government or private sector. It has to rely on foreign investments.”
– Ding Xuedong, Chairman, China Investment Corporation
This has drawn suspicion from U.S. regulators given the geopolitical tensions between the two countries. For further reading on the topic, consider this 2017 paper by the United States-China Economic and Security Review Commission.
Preparing for a Future Without Oil
Many of the countries associated with these SWFs are known for their robust fossil fuel industries. This includes Middle Eastern nations like Kuwait, Saudi Arabia, and the United Arab Emirates.
Oil has been an incredible source of wealth for these countries, but it’s unlikely to last forever. Some analysts believe that we could even see peak oil demand before 2030—though this doesn’t mean that oil will stop being an important resource.
Regardless, oil-producing countries are looking to hedge their reliance on fossil fuels. Their SWFs play an important role by taking oil revenue and investing it to generate returns and/or bolster other sectors of the economy.
An example of this is Saudi Arabia’s Public Investment Fund (PIF), which supports the country’s Vision 2030 framework by investing in clean energy and other promising sectors.


Investor Education
Visualizing BlackRock’s Top Equity Holdings
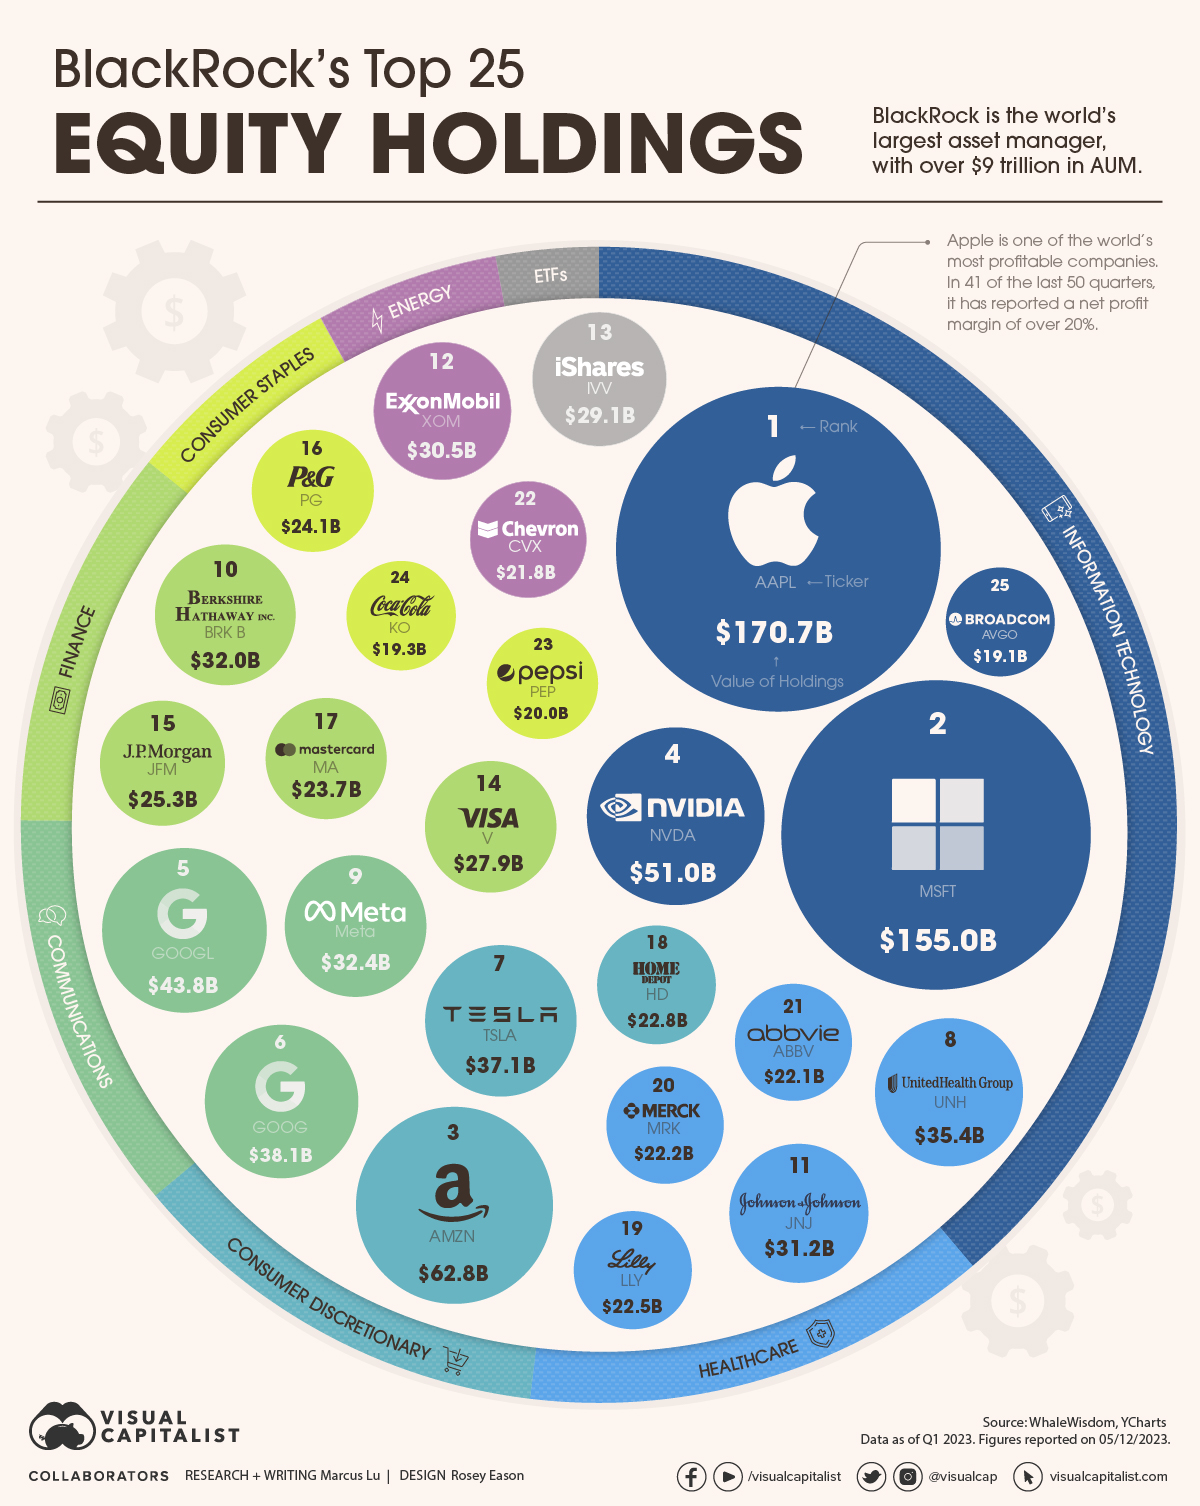
BlackRock is the world’s largest asset manager, with over $9 trillion in holdings. Here are the company’s top equity holdings.
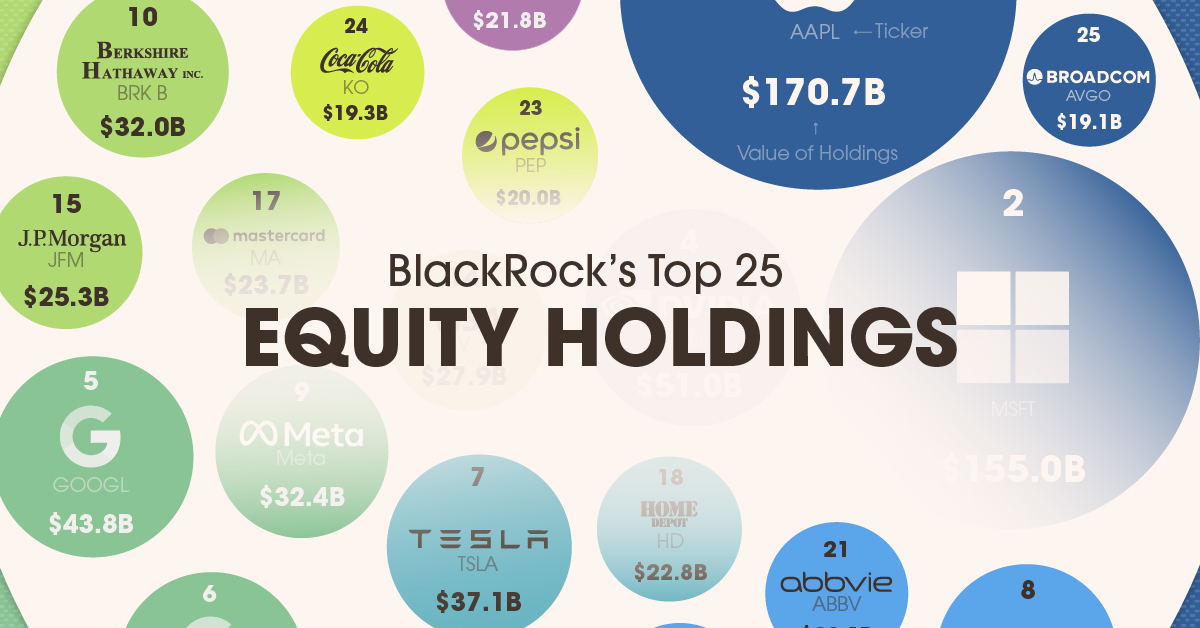
Visualizing BlackRock’s Top 25 Equity Holdings
Founded just 34 years ago in 1988, BlackRock has quickly become the world’s largest asset manager with over $9 trillion in assets under management (AUM).
Given this status, BlackRock’s equity portfolio may provide useful insights to investors. To learn more, we’ve visualized the firm’s top 25 equity holdings as of Q1 2023. At that time, these 25 positions were worth over $1 trillion, and they represented about 30% of BlackRock’s overall equity portfolio.
Top 25 Data
The following table shows the data we used to create this infographic. These figures come from BlackRock’s latest 13F filing, which was released on May 12.
| Rank | Name | Sector | Value of Holdings (USD billions) |
|---|---|---|---|
| 1 | Apple | Information Technology | $171 |
| 2 | Microsoft | Information Technology | $155 |
| 3 | Amazon | Consumer Discretionary | $63 |
| 4 | Nvidia | Information Technology | $51 |
| 5 | Google (Class A) | Communications | $44 |
| 6 | Google (Class C) | Communications | $38 |
| 7 | Tesla | Consumer Discretionary | $37 |
| 8 | UnitedHealth Group | Health Care | $35 |
| 9 | Meta | Communications | $32 |
| 10 | Berkshire Hathaway (Class B) | Finance | $32 |
| 11 | Johnson & Johnson | Health Care | $31 |
| 12 | Exxon Mobil | Energy | $30 |
| 13 | iShares Core S&P 500 ETF | ETF | $29 |
| 14 | Visa | Finance | $28 |
| 15 | JPMorgan Chase & Co | Finance | $25 |
| 16 | Procter & Gamble Co | Consumer Staples | $24 |
| 17 | Mastercard | Finance | $24 |
| 18 | Home Depot | Consumer Discretionary | $23 |
| 19 | Eli Lilly And Co | Health Care | $23 |
| 20 | Merck & Co | Health Care | $22 |
| 21 | AbbVie | Health Care | $22 |
| 22 | Chevron | Energy | $22 |
| 23 | PepsiCo | Consumer Staples | $20 |
| 24 | Coca-Cola Co | Consumer Staples | $19 |
| 25 | Broadcom | Information Technology | $19 |
As expected, BlackRock’s top equity holdings include America’s most established tech companies: Apple, Microsoft, Amazon, and Google.
BlackRock also has large positions in Nvidia and Broadcom, which happen to be America’s two largest semiconductor companies. Given Nvidia’s incredible YTD performance (198% as of June 19th), this position has likely grown even bigger.
Altogether, tech stocks make up 39% of this top 25 list. The next biggest sector would be healthcare, at 13% of the total value.
Ownership Stakes
How much of a controlling stake does BlackRock have in these companies? We answer this question in the following table, which again uses Q1 2023 data.
| Name | % Ownership | Quarter 1st Owned |
|---|---|---|
| Merck & Co | 8.24% | Q3 2007 |
| UnitedHealth Group | 8.02% | Q4 2008 |
| Berkshire Hathaway (Class B) | 7.98% | Q3 2007 |
| PepsiCo | 7.96% | Q3 2007 |
| AbbVie | 7.86% | Q1 2013 |
| Home Depot | 7.60% | Q3 2007 |
| Nvidia | 7.44% | Q3 2007 |
| Microsoft | 7.22% | Q3 2007 |
| Coca-Cola Co | 7.20% | Q3 2007 |
| Broadcom | 7.16% | Q3 2009 |
| Google (Class A) | 7.09% | Q3 2007 |
| Chevron | 7.02% | Q3 2007 |
| Eli Lilly And Co | 6.90% | Q3 2007 |
| Mastercard | 6.89% | Q3 2007 |
| Procter & Gamble Co | 6.86% | Q3 2007 |
| Exxon Mobil | 6.83% | Q3 2007 |
| JPMorgan Chase & Co | 6.59% | Q3 2007 |
| Visa | 6.55% | Q2 2008 |
| Apple | 6.54% | Q3 2007 |
| Johnson & Johnson | 6.46% | Q3 2007 |
| Google (Class C) | 6.13% | Q2 2014 |
| Amazon | 5.93% | Q4 2008 |
| Tesla | 5.70% | Q3 2010 |
| Meta | 5.69% | Q2 2012 |
Google’s Class C shares (Ticker: GOOG) do not offer voting rights.
When it comes to shareholder voting, BlackRock has historically voted on behalf of its clients to “advance their long-term economic interests.” Given its massive size, some people believe that BlackRock has too much influence on major corporations.
In 2021, it was reported that BlackRock would begin allowing some institutional clients to cast their own votes at shareholder meetings.

-

 Energy3 weeks ago
How Old Are the World’s Nuclear Reactors?
-

 Countries7 days ago
Mapped: World’s Top 40 Largest Military Budgets
-

 Energy3 weeks ago
How Big is the Market for Crude Oil?
-

 United States6 days ago
Mapped: The Safest Cities in the U.S.
-

 Markets2 weeks ago
Ranked: The Most Profitable U.S. Companies, by Sector
-

 Technology5 days ago
How Long it Took for Popular Apps to Reach 100 Million Users
-

 Markets4 weeks ago
The World’s Biggest Mutual Fund and ETF Providers
-

 Brands2 weeks ago
Brand Reputations: Ranking the Best and Worst in 2023