Economy
Animated Chart: The S&P 500 in 2023 So Far
Article/Editing:
The S&P 500’s Performance in 2023 Q1
With one quarter of 2023 in the books, how has the S&P 500 performed so far?
The index had a tumultuous 2022, ending the year down 18%, its worst performance since 2008. But so far, despite dealing with tight monetary conditions and an unexpected banking crisis, the S&P 500 has promptly started to rebound.
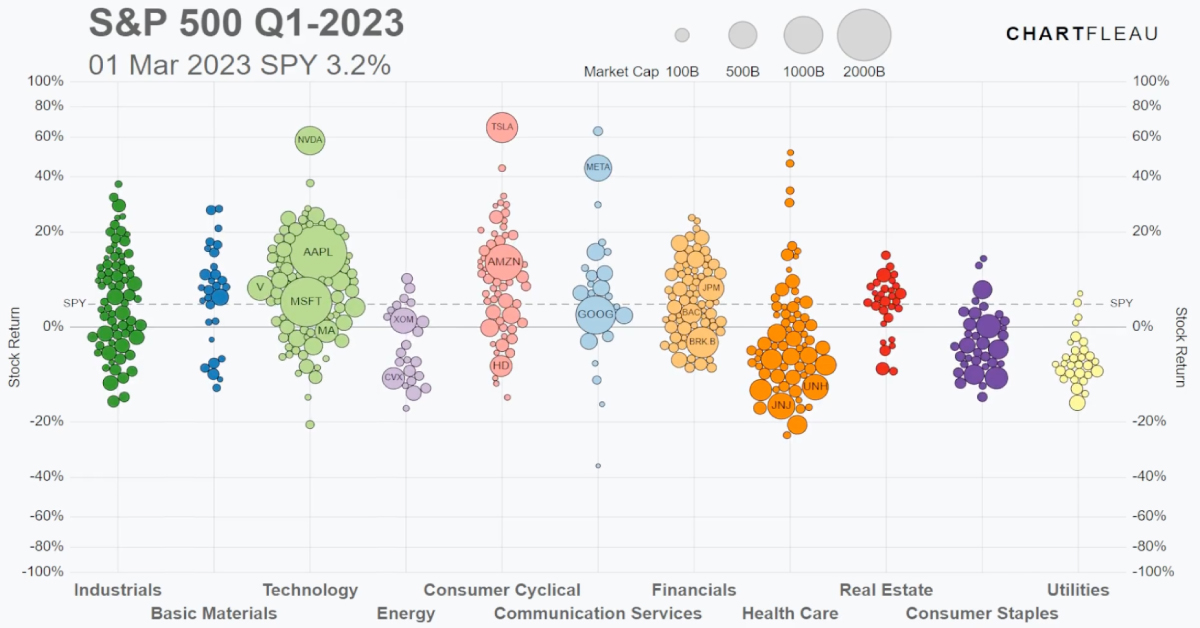
The above animation from Jan Varsava shows the stock performance of each company on the S&P 500, categorized by sector.
Biggest Gainers on the S&P 500
The S&P 500 increased 7.5% during the first quarter of 2023. Though it was led by a few big outperformers, more than half of the stocks on the index closed above their end-of-December prices.
Here are the top 30 biggest gainers on the index from January 1 to March 31, 2023.
| Rank | Company | 3-Month Return |
|---|---|---|
| 1 | Nvidia | 90.1% |
| 2 | Meta (Facebook) | 76.1% |
| 3 | Tesla | 68.4% |
| 4 | Warner Bros. Discovery | 59.3% |
| 5 | Align Technology | 58.4% |
| 6 | AMD | 51.3% |
| 7 | Salesforce | 50.7% |
| 8 | West Pharmaceuticals | 47.3% |
| 9 | General Electric | 46.3% |
| 10 | Catalent | 46.0% |
| 11 | First Solar | 45.2% |
| 12 | Monolithic Power Systems | 41.8% |
| 13 | MarketAxess Holdings | 40.6% |
| 14 | GE Healthcare Tech | 40.5% |
| 15 | Arista Networks | 38.3% |
| 16 | ANSYS Inc. | 37.8% |
| 17 | Fortinet Inc. | 35.9% |
| 18 | Wynn Resorts | 35.7% |
| 19 | Paramount Global | 33.8% |
| 20 | FedEx Corp | 32.7% |
| 21 | MGM Resorts | 32.5% |
| 22 | Royal Caribbean Group | 32.1% |
| 23 | ON Semiconductor Corp | 32.0% |
| 24 | Booking Holdings | 31.6% |
| 25 | Cadence Design Systems | 30.8% |
| 26 | Skyworks Solutions | 30.2% |
| 27 | Pulte Group | 28.4% |
| 28 | Seagate Technology | 27.1% |
| 29 | Apple | 27.1% |
| 30 | Lam Research | 26.6% |
Nvidia shares gained the most of all the companies on the S&P 500 in Q1 2023, posting a staggering 90% return over three months.
As the world’s largest chipmaker by market cap, Nvidia gained from both strong earnings and semiconductor industry performance. It also benefited from the rising prevalence of artificial intelligence (AI) through software like ChatGPT.
Meanwhile, other tech giants Apple and Microsoft gained 27% and 21% respectively over the same time period.
Tech Leads Returns by Sector
The technology sector as a whole was the best performing sectoral index thanks to these big moves, up 21.7% at the end of March.
| Sector | 3-Month Return |
|---|---|
| Technology | 21.65% |
| Consumer Services | 21.27% |
| Consumer Discretionary | 16.60% |
| Materials | 4.29% |
| Industrials | 3.47% |
| Real Estate | 1.95% |
| Consumer Staples | 0.72% |
| Utilities | -3.24% |
| Health Care | -4.31% |
| Energy | -4.37% |
| Financials | -5.56% |
| S&P 500 | 7.5% |
Shares of other tech-adjacent companies like Meta (formerly Facebook) and Tesla—listed on the S&P 500 under the categories of communication services and consumer discretionary—also had a strong start to the year and lifted their respective sectors.
Meta in particular is up 76% in Q1 2023, continuing its rebound after falling to an eight-year low in November 2022 on the back of better-than-expected fourth quarter results and share buybacks.
Biggest Losers on the S&P 500
On the other side of the S&P 500, the financial sector was rocked by sudden collapses.
Signature Bank and Silicon Valley Financial Group shares lost the most ground in the first quarter, after both banks collapsed, shedding nearly all of their value in a matter of 30 days.
In fact, seven of the 10 worst performers on the index to start 2023 are banks or financial companies. The visualization shows the ripple effect on the market after the collapse of regional banks in March, and the ensuing rout driving the entire sector down 5.6% year-to-date.
Here are the top 30 biggest losers on the index from January 1 to March 31, 2023.
| Rank | Company | 3-Month Return |
|---|---|---|
| 1 | Signature Bank | -99.8% |
| 2 | Silicon Valley Financial Group | -99.6% |
| 3 | First Republic Bank | -88.5% |
| 4 | Lumen Technologies | -49.2% |
| 5 | Zions Bancorporation | -38.6% |
| 6 | Charles Schwab Corp | -36.9% |
| 7 | Comerica Incorporated | -33.9% |
| 8 | DISH Network | -33.5% |
| 9 | KeyCorp | -27.3% |
| 10 | Lincoln National Corp | -25.8% |
| 11 | Centene Corporation | -22.9% |
| 12 | Cigna Group | -22.5% |
| 13 | APA Corporation | -22.3% |
| 14 | Citizens Financial Group | -22.1% |
| 15 | Enphase Energy Inc. | -20.6% |
| 16 | Baxter International Inc. | -19.9% |
| 17 | Truist Financial Corporation | -19.9% |
| 18 | American International Group | -19.8% |
| 19 | CVS Health Corporation | -19.7% |
| 20 | Pfizer | -19.6% |
| 21 | Gen Digital | -19.5% |
| 22 | MetLife | -19.4% |
| 23 | Huntington Bancshares | -19.4% |
| 24 | Fidelity National | -19.3% |
| 25 | Halliburton Company | -19.2% |
| 26 | Molina Healthcare | -19.0% |
| 27 | PNC Financial Services | -18.8% |
| 28 | Boston Properties | -18.4% |
| 29 | Fifth Third Bancorp | -17.8% |
| 30 | Allstate Corporation | -17.7% |
Despite the tight monetary landscape, traditionally defensive sectors like energy, consumer staples, and healthcare also underperformed the broader index. This is a reversal from market trends seen in 2022.
Investment Trends to Watch for in 2023
Experts predict a pause in U.S. interest rate hikes “sometime in 2023” but it’s unclear when (or at what level) the pause will take place given persistent inflation in the economy.
However, if interest rates level off in 2023, it could be a key momentum maker for the S&P 500. As Barron’s points out, the index tends to rise after hikes are paused.
Meanwhile, the current tumult in the financial sector is fanning the flames of recessionary fears. How effectively regulators manage the crisis might be the story of the year.
Finally, as we have seen in 2023 so far, investor interest in AI has sent tech stocks soaring. Is this a quick fad, or an overarching trend for the year?

This article was published as a part of Visual Capitalist's Creator Program, which features data-driven visuals from some of our favorite Creators around the world.


China
How Do Chinese Citizens Feel About Other Countries?
What is the Chinese public’s view of world powers? This visual breaks down Chinese sentiment towards other countries.
Public Opinion: How Chinese Citizens Feel About Other Countries
Tensions over Taiwan, the COVID-19 pandemic, trade, and the war in Ukraine have impacted Chinese sentiment towards other countries.
This visualization uses data from the Center for International Security and Strategy (CISS) at Tsinghua University to rank survey responses from the Chinese public on their attitudes towards countries and regions around the world.
Chinese Sentiment Towards Other Countries in 2023
In the Center’s opinion polls, which surveyed a random sample of more than 2,500 Chinese mainland adults in November 2022, Russia came out significantly ahead.
Just under 60% of respondents held Russia in a favorable view, with 19% seeing the country as “very favorable.” Contrast that to the mere 12% that viewed the U.S. in a positive light.
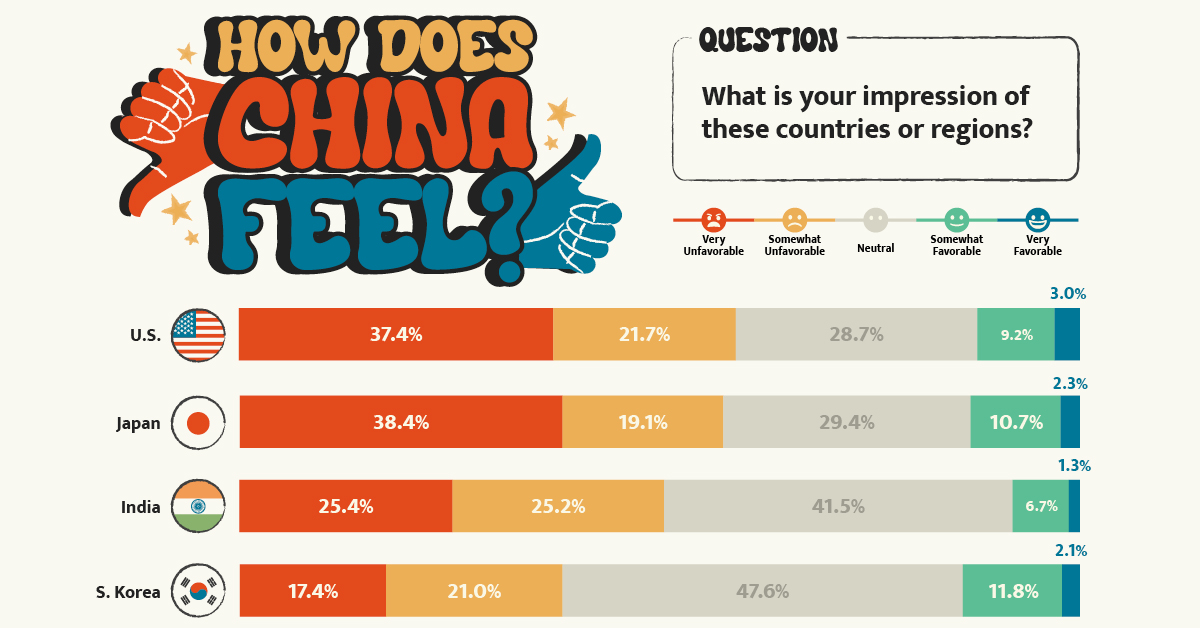
Here’s a closer look at the data. The percentages refer to the share of respondents that voted for said category.
| Country/Region | Very Unfavorable | Somewhat Unfavorable | Neutral | Somewhat Favorable | Very Favorable |
|---|---|---|---|---|---|
| 🇺🇸 United States | 37.4% | 21.7% | 28.7% | 9.2% | 3.0% |
| 🇯🇵 Japan | 38.4% | 19.1% | 29.4% | 10.7% | 2.3% |
| 🇮🇳 India | 25.4% | 25.2% | 41.5% | 6.7% | 1.3% |
| 🇰🇷 South Korea | 17.4% | 21.0% | 47.6% | 11.8% | 2.1% |
| 🇪🇺 European Union | 9.3% | 15.6% | 57.6% | 14.1% | 3.3% |
| Southeast Asia | 7.1% | 13.1% | 59.5% | 16.8% | 3.5% |
| 🇷🇺 Russia | 3.0% | 4.8% | 33.7% | 39.4% | 19.0% |
Japan ranked just below the U.S. in terms of overall unfavorability, though a slightly higher share of respondents saw Japan as “very unfavorable” compared to America. This is likely due to both modern tensions in the East China Sea over mutually claimed islands and historical tensions over the Sino-Japanese Wars.
Chinese sentiment towards India was also unfavorable at just over 50%, though notably the country also received the lowest favorability rating at just 8%.
Additional Survey Findings
The survey also found that 39% of Chinese people get their information on international security from Chinese state-run media (mainly through TV), with an additional 19% getting information from government websites and official social accounts. Conversely, only 1.7% get their news from foreign websites and foreign social media, partially due to the Great Firewall.
When asked about different international security issues, the biggest shares of Chinese citizens ranked the following as their top three:
- Pandemics (12.9%)
- Disputes over territory and territorial waters (12.9%)
- China-U.S. relations (12.0%)
The pandemic’s high score reflects the harsher impact COVID-19 had on China. Chinese borders were shut for years and the public faced intense measures to reduce spread.
In terms of other world events, the majority of Chinese people align with a more “Eastern” viewpoint. For example, in regards to the war in Ukraine, the report found that:
“About 80 percent of the respondents believe the U.S. and Western countries should be held most accountable [for the war], while less than ten percent of the respondents argue that Russia is mainly responsible.”– Center for International Security and Strategy, Tsinghua University
Overall, the views of the Chinese public reflect the opposite of those found in many Western countries. They provide an important insight that it is not just the Chinese government holding particular views about the world, but the Chinese public as well.
-

 Energy3 weeks ago
How Big is the Market for Crude Oil?
-

 United States6 days ago
Mapped: The Safest Cities in the U.S.
-

 Markets2 weeks ago
Ranked: The Most Profitable U.S. Companies, by Sector
-

 apps5 days ago
How Long it Took for Popular Apps to Reach 100 Million Users
-

 Markets4 weeks ago
The World’s Biggest Mutual Fund and ETF Providers
-

 Brands2 weeks ago
Brand Reputations: Ranking the Best and Worst in 2023
-

 Environment5 days ago
Hotter Than Ever: 2023 Sets New Global Temperature Records
-

 Datastream4 weeks ago
Can You Calculate Your Daily Carbon Footprint?