United States
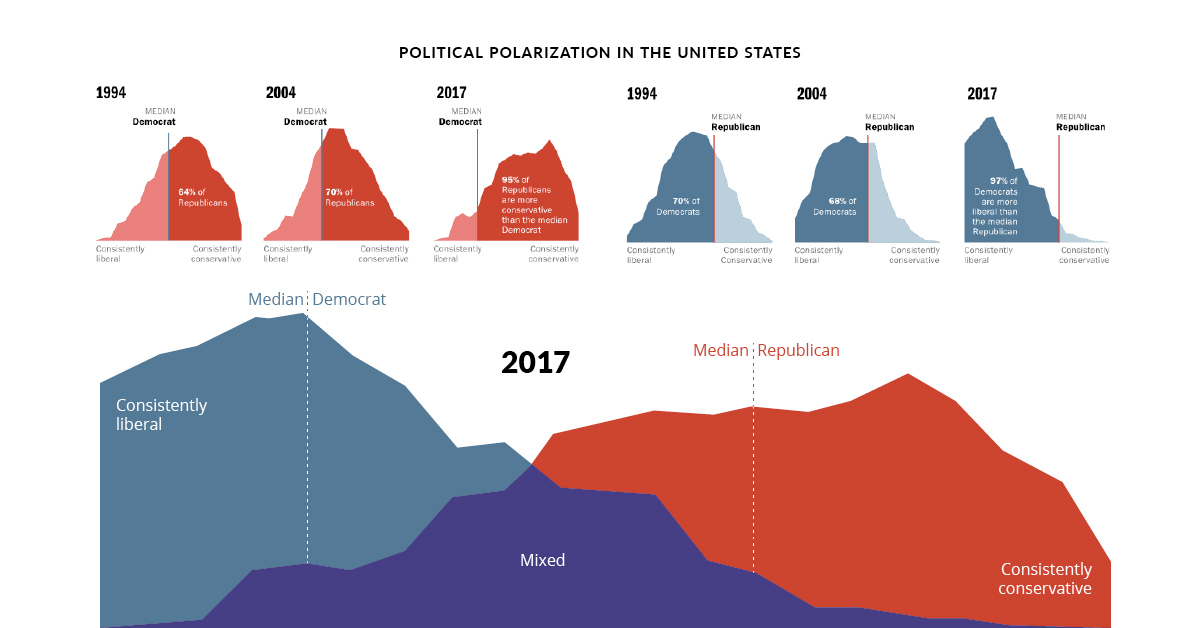
Charts: America’s Political Divide, 1994–2017
Original animation from Pew Research Center, Washington, D.C. (October 2017).
Charts: America’s Political Divide, From 1994–2017
Politics can be a hot button topic in America. With rising tensions on both sides of the political spectrum, some claim that bipartisanship is dead. Recent research shows that may well be true.
Today’s charts come from a report by the independent think tank Pew Research on the partisan divide between the two major U.S. political parties, Democrats and Republicans.
The data is based on surveys of over 5,000 adults to gauge public sentiment, tracking the dramatic shifts in political polarization in the U.S. from 1994 to 2017. The results are a fascinating deep dive into America’s shifting political sentiment.
Over Two Decades of Differences
The animation above demonstrates how the political divide by party has grown significantly and consistently over 23 years. In 1994, the general public was more mixed in their allegiances, but a significant divergence started to occur from 2011 onward.
By 2017, the divide had significantly shifted towards the two extremes of the consistently liberal/conservative scale. Median Democrat and Republican sentiment also moved further apart, especially for politically engaged Americans.
How have Americans’ feelings across major issues evolved over time?
NOTE: For brevity, any mention of Democrats and Republicans in the post below will also refer to survey respondents who “lean Democratic/ lean Republican”.
Americans on the Economy
Original charts from Pew Research Center, Washington, D.C. (October 2017).
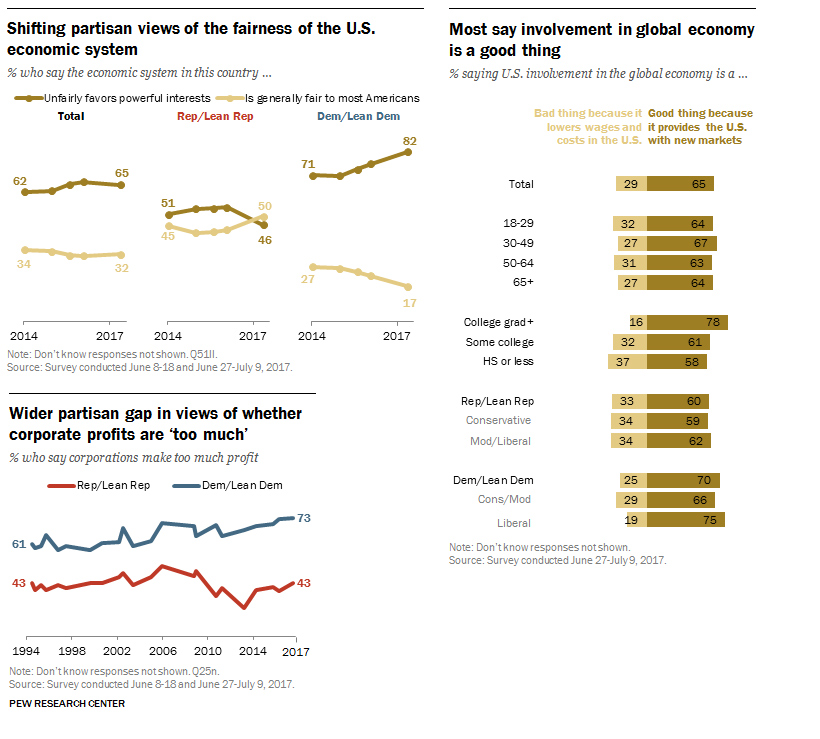
Several survey questions were designed to assess Americans’ perceptions of the economy. Surprisingly, between 60–70% of Democrats and Republicans agree that U.S. involvement in the global economy is positive, because it provides the country with access to new markets.
However, they diverge when asked about the fairness of the economic system itself. 50% of Republicans think it is fair to most Americans, but 82% of Democrats think it unfairly favors powerful interests.
Finally, 73% of Democrats think corporations make ‘too much’ profit, while only 43% of Republicans think so. Since 1994, Democrats have become more convinced of this point, gaining 10 percentage points (p.p.), while Republican impressions have fluctuated marginally.
Americans on the Environment
Original charts from Pew Research Center, Washington, D.C. (October 2017).
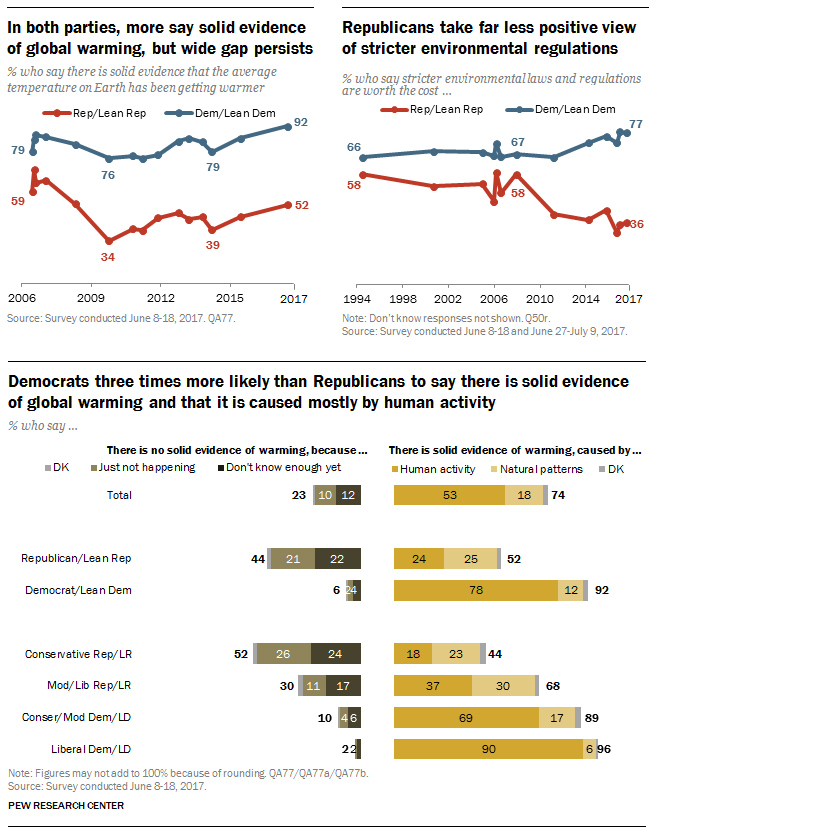
When it comes to climate change, both Democrats and Republicans see that there is growing evidence for global warming, but they are not sold on the reasons why. 78% of Democrats see human activity as the cause, while only 24% of Republicans agree.
Americans also disagree on whether stricter sustainability laws are worth the cost—77% of Democrats think so, but only 36% of Republicans are on the same page. The position of Democrats on this issue has increased by 11 p.p. since 1994, but dropped by double (22 p.p.) for Republicans during this time.
Americans on the Government
Original charts from Pew Research Center, Washington, D.C. (October 2017).
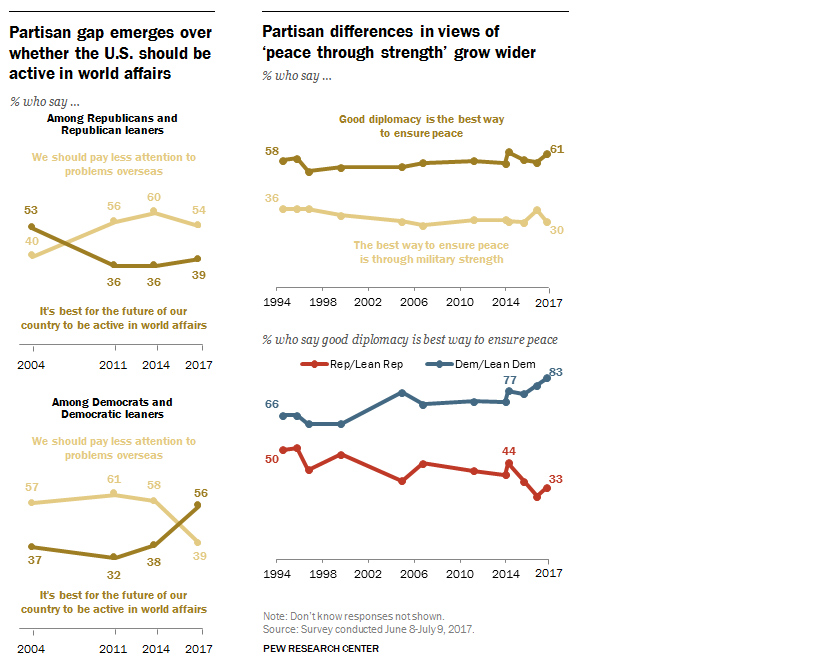
Americans are highly concerned about the U.S. presence on the global stage. Over half (56%) of Democrats think the U.S. should be active in world affairs, while 54% of Republicans think such attention should be focused inward instead of overseas.
This filters into what they consider the best strategy for peace—83% of Democrats believe in democracy to achieve this, while only 33% of Republicans agree, preferring military strength instead. Democrats have cemented their position on diplomacy by 17 p.p. since 1994, growing the political divide.
Americans on Their Society
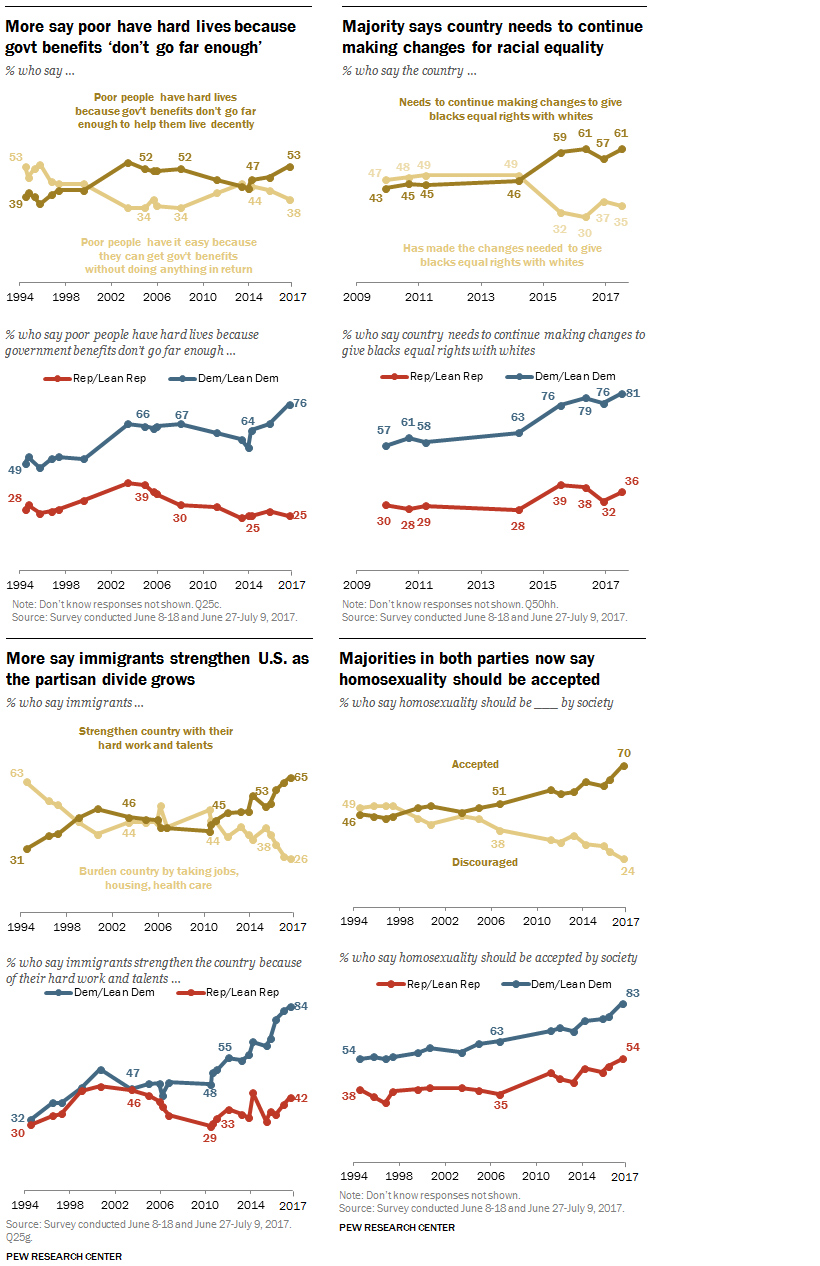
Original charts from Pew Research Center, Washington, D.C. (October 2017).
On several social issues, both parties have become more liberal in their opinions over the decades, especially on immigration and homosexuality. Democrats have seen the biggest advancement on their views of immigration, from 32% in favor in 1994, to 84% in 2017.
However, there’s still a wide partisan divide between Democrats and Republicans on their ideas of government aid (51 p.p. gap), racial equality (45 p.p. gap), immigration (42 p.p. gap), and homosexuality (29 p.p. gap).
Americans on Each Other
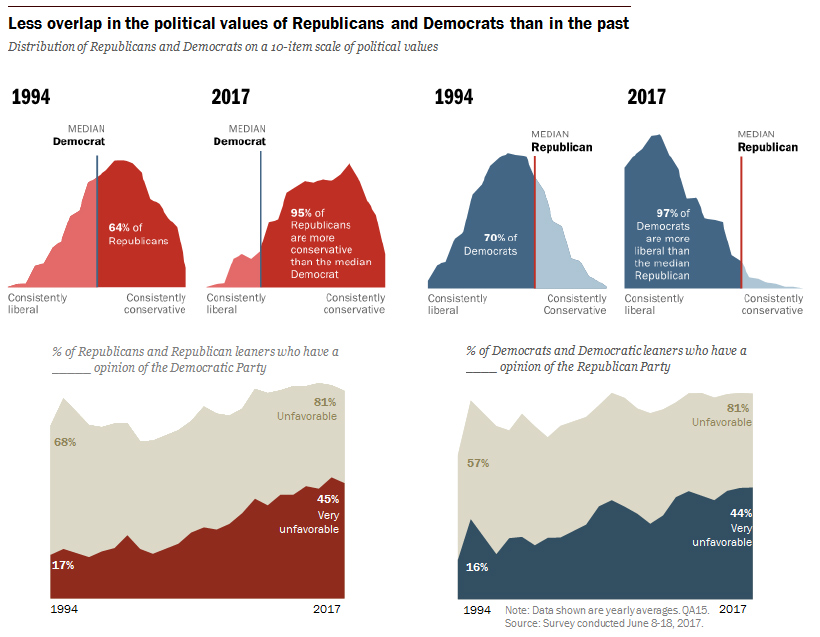
Original charts from Pew Research Center, Washington, D.C. (October 2017).
It’s evident that not only does the American public hold less of a mix of liberal and conservative values, but the center of this political divide has also moved dramatically on both ends of the spectrum. In simple terms, it means that Americans are less willing to consider the other side of debates, preferring to stay entrenched in the group think of their political affiliation.
Not only this, but partisan animosity is on the rise—81% of Republicans and Democrats find those belonging to the other party equally unfavorable. In fact, both parties have seen a 28 p.p. increase in ‘very unfavorable’ views of people in the other party, compared to 1994.
Can the Rift be Repaired?
While the above data on group polarization ends in 2017, it’s clear that the repercussions continue to have ripple effects into today and the future. These differences mean there is no consensus on the nation’s key priorities.
In 2019, Republicans believe that terrorism, the economy, social security, immigration, and the military should be top of mind, while Democrats refer to healthcare, education, environment, Medicare, and the poor and needy as their leads.
With Trump’s presidential term up for contest in 2020, the lack of common ground on pressing issues will continue to cause a stir among both Democratic and Republican bases. Is there anything Americans will be willing to cross the aisle for?


Crime
Mapped: The Safest Cities in the U.S.
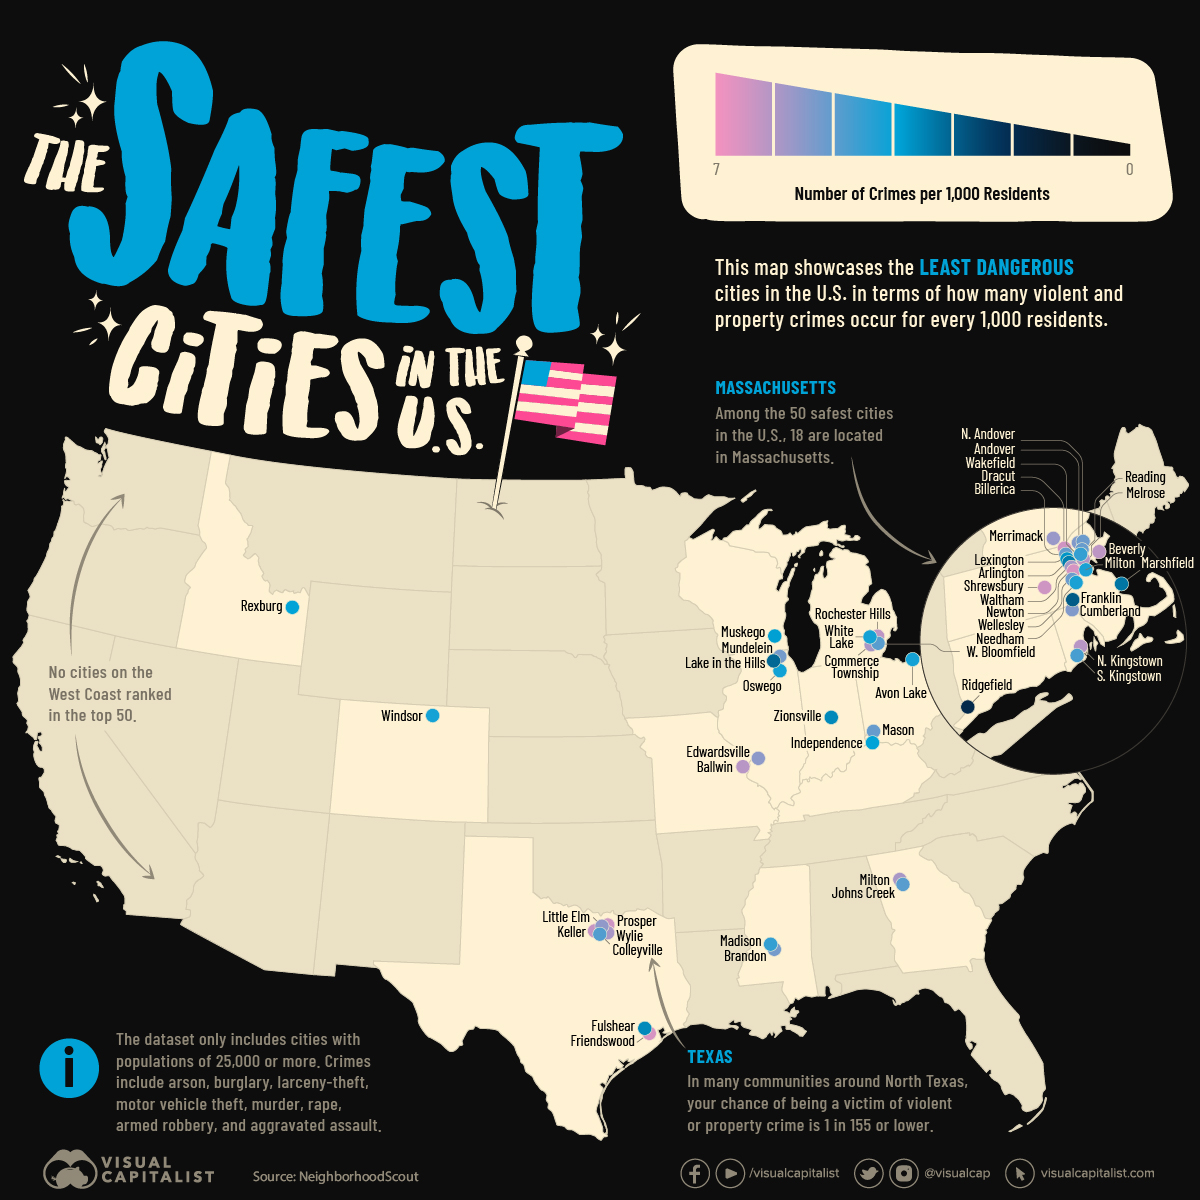
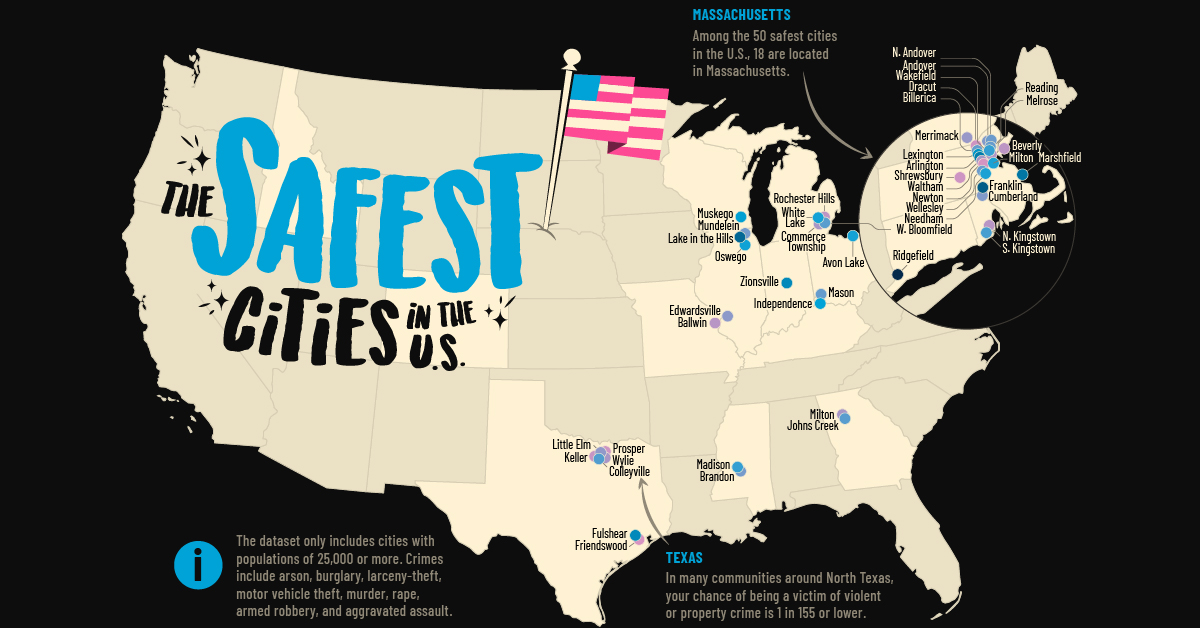
How safe is small town America? This map reveals the safest cities in the U.S. in terms of the total crime rate per every 1,000 residents.
Mapped: The Safest Cities in America
The phrase “small town America” often conjures up images of white picket fences, well-trimmed lawns, and big houses. But how safe is modern-day suburbia in America?
Some of the smallest places in the country can actually be among the most dangerous. Take for example Bessemer, Alabama, with a population of around 26,000 and a violent crime rate of 33.1 per every 1,000 residents.
That said, there are many small cities that are true havens for families across the United States. This map showcases the safest cities in the U.S., using FBI data and Census Bureau populations compiled by NeighborhoodScout in 2023.
Note: The source only considered cities with a population of 25,000 or higher. This report is based on total index crimes reported in each city, which includes arson, burglary, larceny-theft, motor vehicle theft, murder, rape, armed robbery, and aggravated assault.
Top 100 Safest Cities in the U.S.
40% of the cities in the ranking are located in Northeastern states, which are typically rated the “safest” based on FBI data.
Here’s a closer look at the full list:
| Rank | City | State | Total Crime Rate(per 1,000 residents) | Chance of Beinga Victim |
|---|---|---|---|---|
| 1 | Ridgefield | Connecticut | 1.9 | 1 in 510 |
| 2 | Franklin | Massachusetts | 2.9 | 1 in 344 |
| 3 | Lake in the Hills | Illinois | 3.1 | 1 in 321 |
| 4 | Marshfield | Massachusetts | 3.3 | 1 in 300 |
| 5 | Arlington | Massachusetts | 3.4 | 1 in 292 |
| 6 | Fulshear | Texas | 3.6 | 1 in 276 |
| 7 | Zionsville | Indiana | 3.6 | 1 in 275 |
| 8 | Lexington | Massachusetts | 3.7 | 1 in 270 |
| 9 | Muskego | Wisconsin | 3.8 | 1 in 265 |
| 10 | Rexburg | Idaho | 3.9 | 1 in 253 |
| 11 | Independence | Kentucky | 3.9 | 1 in 253 |
| 12 | Oswego | Illinois | 4.1 | 1 in 238 |
| 13 | Milton | Massachusetts | 4.2 | 1 in 233 |
| 14 | Needham | Massachusetts | 4.2 | 1 in 233 |
| 15 | White Lake | Michigan | 4.2 | 1 in 233 |
| 16 | Avon Lake | Ohio | 4.3 | 1 in 232 |
| 17 | Madison | Mississippi | 4.5 | 1 in 221 |
| 18 | Wakefield | Massachusetts | 4.5 | 1 in 218 |
| 19 | Windsor | Colorado | 4.5 | 1 in 218 |
| 20 | South Kingstown | Rhode Island | 4.7 | 1 in 212 |
| 21 | Colleyville | Texas | 4.8 | 1 in 206 |
| 22 | West Bloomfield | Michigan | 4.9 | 1 in 204 |
| 23 | Johns Creek | Georgia | 4.9 | 1 in 202 |
| 24 | Billerica | Massachusetts | 5.1 | 1 in 195 |
| 25 | Mason | Ohio | 5.1 | 1 in 192 |
| 26 | Reading | Massachusetts | 5.1 | 1 in 192 |
| 27 | North Andover | Massachusetts | 5.2 | 1 in 190 |
| 28 | Wellesley | Massachusetts | 5.2 | 1 in 189 |
| 29 | Mundelein | Illinois | 5.3 | 1 in 187 |
| 30 | Brandon | Mississippi | 5.3 | 1 in 186 |
| 31 | Cumberland | Rhode Island | 5.4 | 1 in 184 |
| 32 | Andover | Massachusetts | 5.4 | 1 in 182 |
| 33 | Edwardsville | Illinois | 5.5 | 1 in 178 |
| 34 | Little Elm | Texas | 5.6 | 1 in 176 |
| 35 | Merrimack | New Hampshire | 5.7 | 1 in 172 |
| 36 | Waltham | Massachusetts | 5.8 | 1 in 169 |
| 37 | Wylie | Texas | 5.9 | 1 in 169 |
| 38 | Commerce Township | Michigan | 5.9 | 1 in 169 |
| 39 | Milton | Georgia | 5.9 | 1 in 167 |
| 40 | Melrose | Massachusetts | 6.0 | 1 in 164 |
| 41 | Ballwin | Missouri | 6.1 | 1 in 162 |
| 42 | North Kingstown | Rhode Island | 6.1 | 1 in 162 |
| 43 | Beverly | Massachusetts | 6.2 | 1 in 161 |
| 44 | Rochester Hills | Michigan | 6.2 | 1 in 160 |
| 45 | Keller | Texas | 6.3 | 1 in 158 |
| 46 | Shrewsbury | Massachusetts | 6.4 | 1 in 156 |
| 47 | Dracut | Massachusetts | 6.4 | 1 in 155 |
| 48 | Prosper | Texas | 6.4 | 1 in 155 |
| 49 | Newton | Massachusetts | 6.5 | 1 in 152 |
| 50 | Friendswood | Texas | 6.5 | 1 in 152 |
| 51 | McHenry | Illinois | 6.5 | 1 in 152 |
| 52 | Fort Mill | South Carolina | 6.6 | 1 in 151 |
| 53 | Wallingford | Connecticut | 6.8 | 1 in 146 |
| 54 | Caledonia | Wisconsin | 6.9 | 1 in 144 |
| 55 | Belmont | Massachusetts | 6.9 | 1 in 144 |
| 56 | De Pere | Wisconsin | 6.9 | 1 in 143 |
| 57 | Flower Mound | Texas | 7.0 | 1 in 142 |
| 58 | Easton | Massachusetts | 7.0 | 1 in 141 |
| 59 | Highland Park | Illinois | 7.0 | 1 in 141 |
| 60 | Carmel | Indiana | 7.2 | 1 in 138 |
| 61 | Sachse | Texas | 7.2 | 1 in 138 |
| 62 | Algonquin | Illinois | 7.2 | 1 in 137 |
| 63 | Hendersonville | Tennessee | 7.2 | 1 in 137 |
| 64 | San Luis | Arizona | 7.3 | 1 in 136 |
| 65 | Fishers | Indiana | 7.3 | 1 in 135 |
| 66 | Perrysburg | Ohio | 7.4 | 1 in 135 |
| 67 | Lake Stevens | Washington | 7.4 | 1 in 134 |
| 68 | Cheshire | Connecticut | 7.4 | 1 in 134 |
| 69 | Milford | Massachusetts | 7.5 | 1 in 132 |
| 70 | Saratoga Springs | Utah | 7.5 | 1 in 132 |
| 71 | Bella Vista | Arkansas | 7.5 | 1 in 132 |
| 72 | Princeton | New Jersey | 7.5 | 1 in 131 |
| 73 | Bluffton | South Carolina | 7.6 | 1 in 130 |
| 74 | Novi | Michigan | 7.6 | 1 in 130 |
| 75 | Chelmsford | Massachusetts | 7.6 | 1 in 130 |
| 76 | Amherst | Massachusetts | 7.7 | 1 in 129 |
| 77 | Rosemount | Minnesota | 7.7 | 1 in 129 |
| 78 | Gloucester | Massachusetts | 7.7 | 1 in 129 |
| 79 | Syracuse | Utah | 7.8 | 1 in 127 |
| 80 | Waukee | Iowa | 7.8 | 1 in 126 |
| 81 | Mequon | Wisconsin | 7.9 | 1 in 126 |
| 82 | Westfield | Indiana | 7.9 | 1 in 126 |
| 83 | Spring Hill | Tennessee | 7.9 | 1 in 126 |
| 84 | Upper Arlington | Ohio | 7.9 | 1 in 126 |
| 85 | Rahway | New Jersey | 7.9 | 1 in 125 |
| 86 | Montclair | New Jersey | 7.9 | 1 in 125 |
| 87 | Greenwich | Connecticut | 8.0 | 1 in 125 |
| 88 | Hutto | Texas | 8.0 | 1 in 124 |
| 89 | Vestavia Hills | Alabama | 8.0 | 1 in 123 |
| 90 | Brownsburg | Indiana | 8.1 | 1 in 123 |
| 91 | Wilmette | Illinois | 8.1 | 1 in 123 |
| 92 | New Milford | Connecticut | 8.1 | 1 in 122 |
| 93 | Hilliard | Ohio | 8.2 | 1 in 120 |
| 94 | Royal Oak | Michigan | 8.2 | 1 in 120 |
| 95 | Derry | New Hampshire | 8.3 | 1 in 121 |
| 96 | Dublin | Ohio | 8.3 | 1 in 120 |
| 97 | West Warwick | Rhode Island | 8.5 | 1 in 116 |
| 98 | Watertown | Massachusetts | 8.5 | 1 in 116 |
| 99 | Walpole | Massachusetts | 8.6 | 1 in 115 |
| 100 | Kaysville | Utah | 8.6 | 1 in 115 |
One quarter of the safest cities are located in Massachusetts, with the vast majority clustered around Boston.
The median population of the cities and towns in the top 100 is just 32,000, and few widely-recognized cities make the list. Carmel, Indiana (#60) is the only city with a population above 100,000 to make the rankings. This would seem to follow the logic that bigger cities are more dangerous, but our map covering the most dangerous cities in America shows that many small cities were just as dangerous, and some even more.
Regardless, small towns can truly be idyllic. For example, a person’s chance of falling victim to crime in Ridgefield, Connecticut, the safest ranked city in the U.S., is just 1-in-510. That’s an overall rate of fewer than two incidents of crime per every 1,000 residents.
One surprising observation from the data is that many of the safest U.S. cities are in very close proximity to some of the most dangerous.
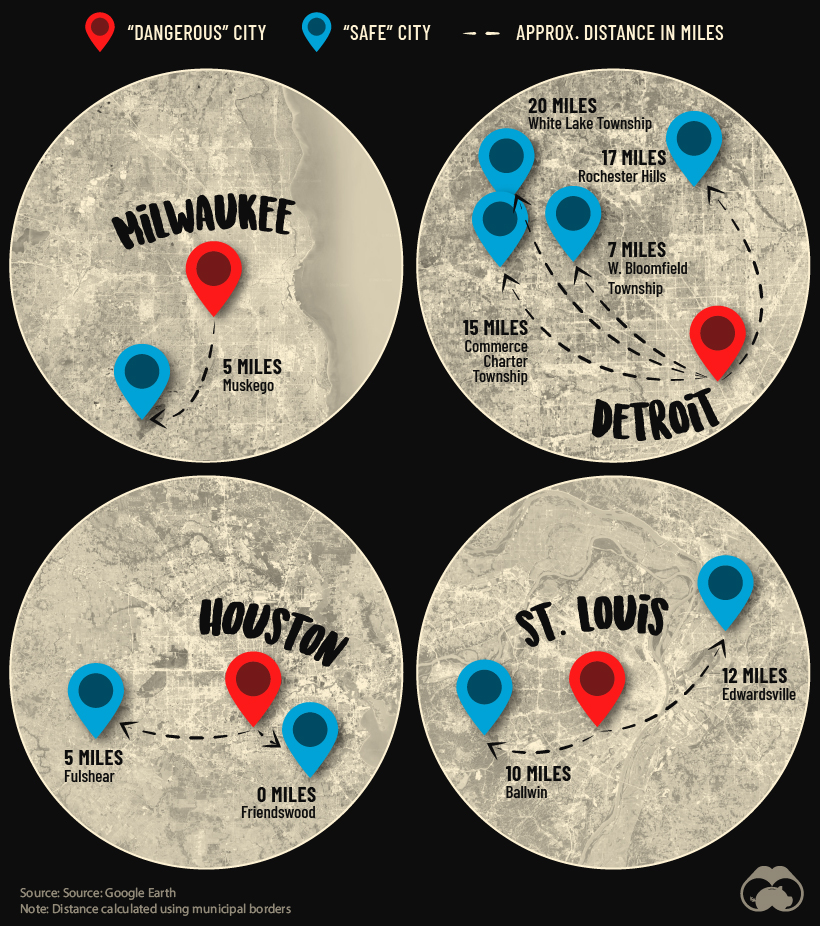
One example that illustrates this is Detroit, which ranks as the sixth most dangerous city in America. Despite this, as shown on the map above, there are four communities nearby that have some of the lowest crime rates in America.
In other words, America’s metro areas contain much contrast, and these insights provide valuable information for individuals and families seeking secure places to live across the country.

-

 Energy2 weeks ago
Who’s Still Buying Russian Fossil Fuels in 2023?
-

 VC+4 days ago
What’s New on VC+ in July
-

 Investor Education4 weeks ago
Visualizing BlackRock’s Top Equity Holdings
-

 Technology2 weeks ago
Meet the Competing Apps Battling for Twitter’s Market Share
-

 Politics17 hours ago
How Do Chinese Citizens Feel About Other Countries?
-

 Markets4 weeks ago
Visualizing Every Company on the S&P 500 Index
-

 Markets2 weeks ago
Visualizing 1 Billion Square Feet of Empty Office Space
-

 Energy4 weeks ago
Life Cycle Emissions: EVs vs. Combustion Engine Vehicles