Money
Ranked: The Most Expensive Sports Team Sales in History
Article/Editing:
Ranking the Biggest Sports Team Sales in History
After a record-setting year in 2022, professional sports team sales are on an uptick yet again.
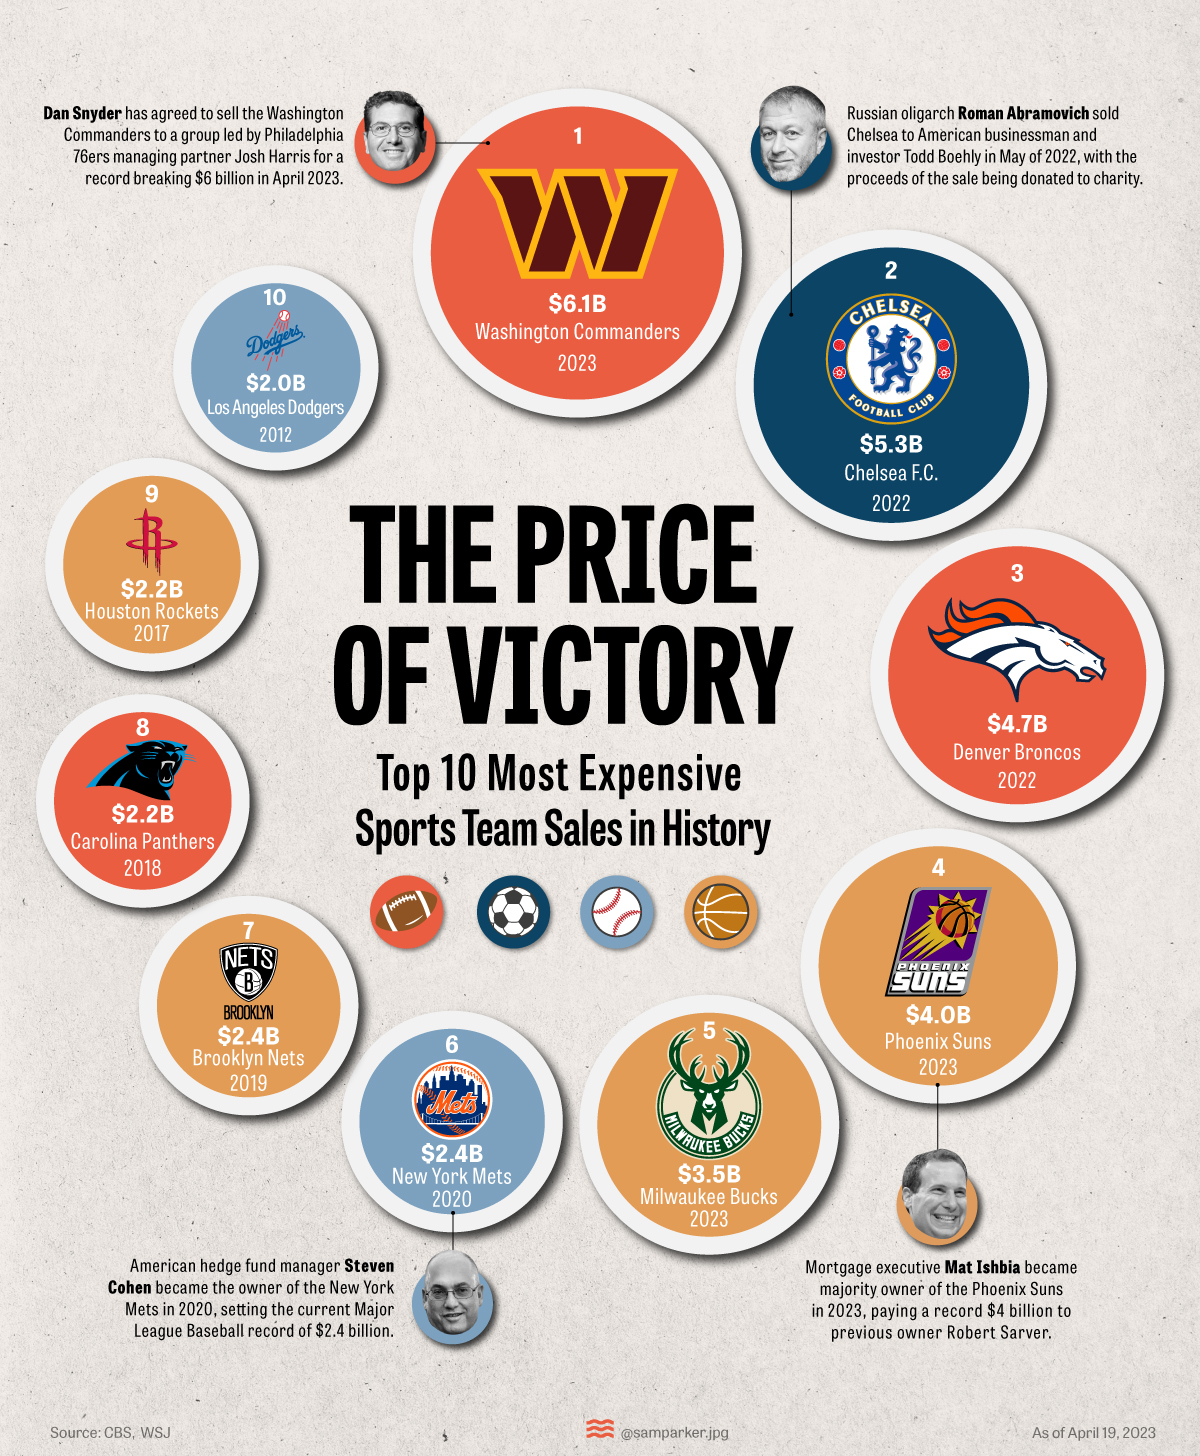
The tentative $6.05 billion Washington Commanders sale, already approved by other NFL owners, will be the highest amount paid for a sports team once completed.
This graphic from Sam Parker shows how the Commanders’ April 2023 deal measures up against the biggest sports team sales in history, using data from the Wall Street Journal and CBS Sports.
Washington Commanders Sale vs. Other Franchise Fortunes
Valuations have become significantly larger in the last couple of years, with the largest sales all occurring after 2010. Here are the 10 most highly-priced sales for a professional sports team franchise globally.
| Rank | Team | Price | Year of Sale |
|---|---|---|---|
| 1 | 🏈 Washington Commanders | $6.1B | 2023 |
| 2 | ⚽ Chelsea Football Club | $5.3B | 2022 |
| 3 | 🏈 Denver Broncos | $4.7B | 2022 |
| 4 | 🏀 Phoenix Suns | $4.0B | 2023 |
| 5 | 🏀 Milwaukee Bucks | $3.5B | 2023 |
| 6 | ⚾ New York Mets | $2.4B | 2020 |
| 7 | 🏀 Brooklyn Nets | $2.4B | 2019 |
| 8 | 🏈 Carolina Panthers | $2.2B | 2018 |
| 9 | 🏀 Houston Rockets | $2.2B | 2017 |
| 10 | ⚾ Los Angeles Dodgers | $2.0B | 2012 |
The Washington Commanders sale takes the top spot at $6.1 billion, even though it could still be de-throned. It’s been reported that a $7 billion dollar bid for the team is still in play as well.
Dan Snyder, the current owner of the team, is one of the world’s richest people in sports. He purchased the team for $800 million in 1999 and, if the $6.1 billion sale completes, will have made a cumulative return of over 650%.
Chelsea Football Club is the only non-U.S. sale on the list. The sports team was previously owned by Roman Abramovich, a Russian oligarch who was subject to sanctions after Russia’s invasion of Ukraine and was forced to sell the team.
Hedge fund billionaire Todd Boehly, who was part of the consortium that purchased Chelsea, is also part owner of number 10 on the list: the LA Dodgers. Boehly is said to have helped with one of the “most dramatic turnarounds in North American sports” through his purchase of the Dodgers in 2012 for $2.0 billion, with the team wining the MLB World Series in 2020.
Will any sale top the Washington Commanders number? NFL teams specifically are some of the world’s most valuable teams, so the sale of a team such as the Dallas Cowboys or Los Angeles Rams could be worth more.
Other competition could come from soccer teams, including Chelsea rivals Manchester United or Liverpool. Manchester United’s owners put the club up for sale in 2022, hoping for a valuation of £5 billion to £6 billion ($6.2 billion to $7.5 billion).
Why Are Sports Team Sale Prices So High?
Sports teams haven’t always collected such sky-high prices like the Washington Commanders sale. In fact, sports teams used to be the investment of choice for eccentric entrepreneurs and were considered money-losing propositions.
So what’s changed? There are a number of factors driving high valuations and passionate interest from billionaires:
- Media deals: Digitization means sports now have a global audience, and broadcast rights have become a major driver of leagues’ revenue growth. For example, the NFL has $115 billion in long-term media rights deals with major TV networks, Amazon, and Google’s YouTube TV.
- Industry monopoly: There were once a handful of professional baseball leagues, but Major League Baseball earned an exemption from antitrust (pro-competition) laws in 1922. Other sports leagues have conglomerated to become the biggest and best representatives of their sport, making it nearly impossible for new entrants to compete.
- League benefits: Contracts negotiated at a league level are equally split between every league’s sports team. The Packers, the only NFL team with public financial statements, earned 60% of their income from national sources in 2022. Most leagues also have salary caps which limit player costs.
- Favorable Taxes: In 2004, the U.S. federal government introduced a rule allowing sports team owners to write off most of their purchase price against team profits over 15 years.
Beyond these factors, perhaps the biggest driver of sports team value is the prestige associated with owning one.
“Sports teams are a bit of a vanity asset, like owning a Picasso, and the highest bidder is going to be a very rich person who wants to own the team so they (can) call themselves an owner of a sports team.” — Stephen Dodson, Portfolio Manager of Bretton Fund

This article was published as a part of Visual Capitalist's Creator Program, which features data-driven visuals from some of our favorite Creators around the world.


Cities
Ranked: The Most Affordable U.S. Cities for Home Buyers
There’s more to consider than the price tag when purchasing a house. This ranking reveals the most affordable U.S. cities for home buyers.
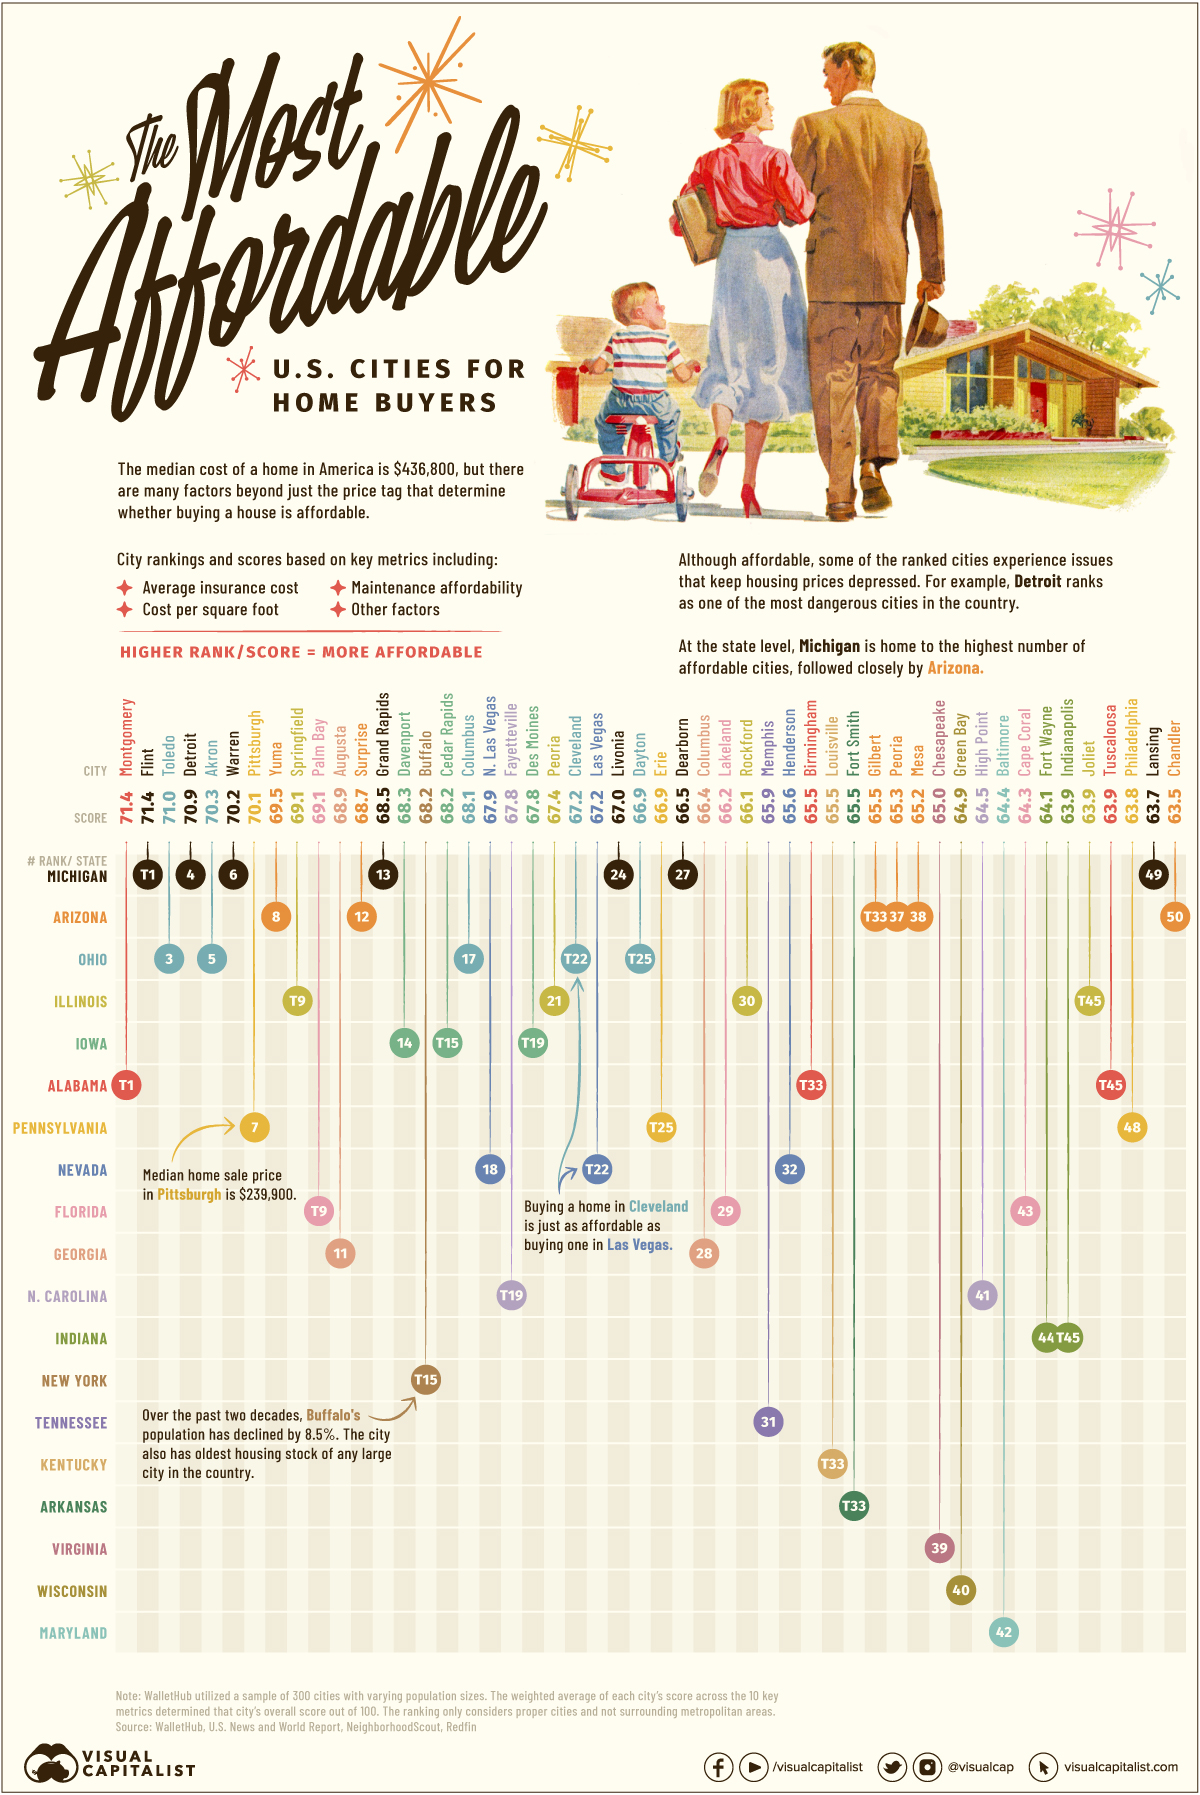

Ranked: The Most Affordable U.S. Cities for Home Buyers
Just before the pandemic, the average home price in the U.S. was $313,000—a figure that has since jumped by 40% to $436,800 today. As home prices and mortgage rates increase, home ownership is becoming an unrealistic dream for some.
In the cities ranked above, however, buying a house is a much more attainable goal.
By looking at factors like the real estate tax rate, median home price appreciation, and cost of living, this study from WalletHub assesses the most affordable cities in the U.S. for home buyers. The scores in the ranking are out of 100 and the higher a score, the more affordable that city is for home buyers.
The Methodology
This ranking considers much more than just the price tag on a house when it comes to affordability. Using 10 metrics, which cover an array of important considerations for home buyers, the overall affordability score is measured for each city.
Here’s a closer look at the 10 categories and how each one was weighted and measured:
| Metric | Weight |
|---|---|
| Housing Affordability | 25.00 points |
| Cost per Square Foot | 16.67 points |
| Maintenance Affordability | 8.33 points |
| Average Cost of Homeowner's Insurance | 8.33 points |
| Cost of Living | 8.33 points |
| Real Estate Tax Rate | 8.33 points |
| Rent-to-Price-Ratio | 8.33 points |
| Median Home Price Appreciation | 8.33 points |
| Quarterly Active Listings per Capita | 4.17 points |
| Vacancy Rate | 4.17 points |
The highest-weighted metric is the median price of the home itself divided by the median household income in that area, or house affordability.
Other important metrics assessed include the availability of homes for sale, the average cost of homeowner’s insurance, maintenance costs, and many other vital things people must consider when purchasing a home.
Which U.S. Cities are the Most Affordable for Home Buyers?
Here’s a closer look at the 50 most affordable cities for home buyers in the U.S.:
| Rank | City | Score |
|---|---|---|
| T1 | Montgomery, AL | 71.4 |
| T1 | Flint, MI | 71.4 |
| 3 | Toledo, OH | 71.0 |
| 4 | Detroit, MI | 70.9 |
| 5 | Akron, OH | 70.3 |
| 6 | Warren, MI | 70.2 |
| 7 | Pittsburgh, PA | 70.1 |
| 8 | Yuma, AZ | 69.5 |
| T9 | Springfield, Il | 69.1 |
| T9 | Palm Bay, FL | 69.1 |
| 11 | Augusta, GA | 68.9 |
| 12 | Surpise, AZ | 68.7 |
| 13 | Grand Rapids, MI | 68.5 |
| 14 | Davenport, IA | 68.3 |
| T15 | Buffalo, NY | 68.2 |
| T15 | Cedar Rapids, IA | 68.2 |
| 17 | Columbus, OH | 68.1 |
| 18 | North Las Vegas, NV | 67.9 |
| T19 | Fayetteville, NC | 67.8 |
| T19 | Des Moines, IA | 67.8 |
| 21 | Peoria, IL | 67.4 |
| T22 | Cleveland, OH | 67.2 |
| T22 | Las Vegas, NV | 67.2 |
| 24 | Livonia, MI | 67.0 |
| T25 | Dayton, OH | 66.9 |
| T25 | Erie, PA | 66.9 |
| 27 | Dearborn, MI | 66.5 |
| 28 | Columbus, GA | 66.4 |
| 29 | Lakeland, FL | 66.2 |
| 30 | Rockford, IL | 66.1 |
| 31 | Memphis, TN | 65.9 |
| 32 | Henderson, NV | 65.6 |
| T33 | Birmingham, AL | 65.5 |
| T33 | Louisville, KY | 65.5 |
| T33 | Fort Smith, AR | 65.5 |
| T33 | Gilbert, AZ | 65.5 |
| 37 | Peoria, AZ | 65.3 |
| 38 | Mesa, AZ | 65.2 |
| 39 | Chesapeake, VA | 65.0 |
| 40 | Green Bay, WI | 64.9 |
| 41 | High Point, NC | 64.5 |
| 42 | Baltimore, MD | 64.4 |
| 43 | Cape Coral, FL | 64.3 |
| 44 | Fort Wayne, IN | 64.1 |
| T45 | Indianapolis, IN | 63.9 |
| T45 | Joliet, IL | 63.9 |
| T45 | Tuscaloosa, AL | 63.9 |
| 48 | Philadelphia, PA | 63.8 |
| 49 | Lansing, MI | 63.7 |
| 50 | Chandler, AZ | 63.5 |
When it comes to the individual metrics, here’s a look at some cities which had the best scores in a few of the unique categories:
- #1 in Housing Affordability: Springfield, IL
- #1 in Maintenance Affordability: Sunnyvale, CA
- #1 in Rent-to-Price Ratio: Flint, MI
- #1 in Vacancy Rate: Miami Beach, FL
Location, Location, Location
Narrowing down which locations are feasible from a lifestyle and financial standpoint is a critical first step in the home-buying journey. Popular suburban communities and iconic hubs like Los Angeles or NYC hold great appeal, but these places command a higher price point or have housing stock that is incompatible with lifestyle needs.
On the flip side, some of the most affordable cities may have issues that negatively affect desirability. Flint, Michigan (#1), for example, is still widely perceived to have issues with its drinking water. Other places are high in crime or have a narrow range of economic opportunities, like Detroit (#4) or Yuma, Arizona (#9), respectively.
Many of the cities in the ranking are concentrated in Michigan, Arizona, and Ohio. In terms of big cities that are actually affordable, Pittsburgh, Columbus, Philadelphia, and Baltimore are examples of well-known spots to make the list.
There are also a number of ties in the ranking, with makes for interesting juxtapositions. For instance, Las Vegas is just as affordable as Cleveland, Ohio (#22). Here’s a look at some other cities that are equally affordable for home buyers:
- Montgomery, Alabama and Flint, Michigan (#1)
- Springfield, Illinois and Palm Bay, Florida (#9)
- Buffalo, New York and Cedar Rapids, Iowa (#15)
- Fayetteville, North Carolina and Des Moines, Iowa (#19)
- Dayton, Ohio and Erie, Pennsylvania (#25)
- Birmingham, Alabama; Louisville, Kentucky; Fort Smith, Arkansas; and Gilbert, Arizona (#33)
- Indianapolis, Indiana; Joliet, Illinois; and Tuscaloosa, Alabama (#45)
Overall, the home ownership rate in the U.S.—the share of homes that are occupied by their owners—is currently 66%, according to FRED data. While the trend shows a general recovery from the steep drop off that occurred during the pandemic, there is a while to go before the U.S. reaches pre-2020 figures. Perhaps, these affordable towns could offer a solution.
Where Does This Data Come From?
Source: WalletHub using data from the U.S. Census Bureau, The National Association of Realtors, Council for Community and Economic Research and Insurance Information Institute.
Data notes: To determine the most affordable cities for home buyers, WalletHub compared a sample of 300 U.S. cities (varying in size) across ten key metrics, which are listed below with their corresponding weights. Each metric was graded on a 100-point scale, with a score of 100 representing the most favorable conditions for home affordability. The ranking only considers proper cities and not surrounding metropolitan areas. Visit the source for further details.
-

 Markets4 weeks ago
Visualizing BlackRock’s Top Equity Holdings
-

 Technology2 weeks ago
Meet the Competing Apps Battling for Twitter’s Market Share
-

 Politics14 hours ago
How Do Chinese Citizens Feel About Other Countries?
-

 Markets4 weeks ago
Visualizing Every Company on the S&P 500 Index
-

 Economy2 weeks ago
Visualizing 1 Billion Square Feet of Empty Office Space
-

 Green4 weeks ago
Life Cycle Emissions: EVs vs. Combustion Engine Vehicles
-

 Maps2 weeks ago
Vintage Viz: The World’s Rivers and Lakes, Organized Neatly
-

 Markets3 weeks ago
Visualized: The 100 Largest U.S. Banks by Consolidated Assets