Real Estate
Mapped: The Growth in House Prices by Country
The following slider shows both nominal and real housing prices by country. Use slider arrows to navigate.

Mapped: The Growth in House Prices by Country
This was originally posted on Advisor Channel. Sign up to the free mailing list to get beautiful visualizations on financial markets that help advisors and their clients.
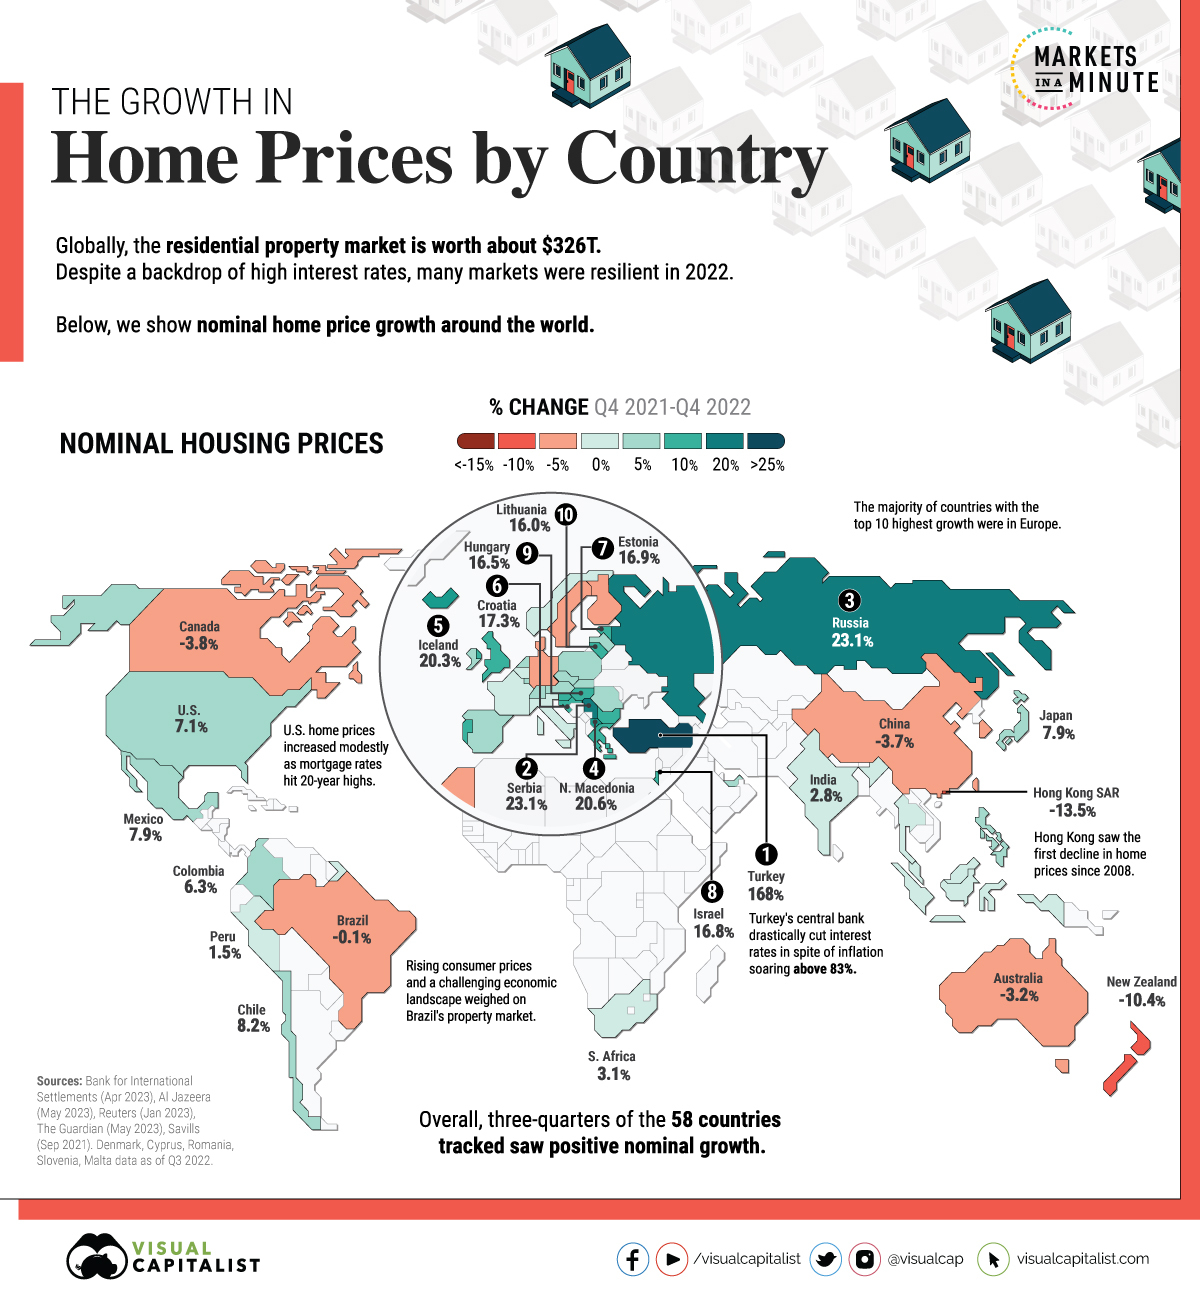
Global housing prices rose an average of 6% annually, between Q4 2021 and Q4 2022.
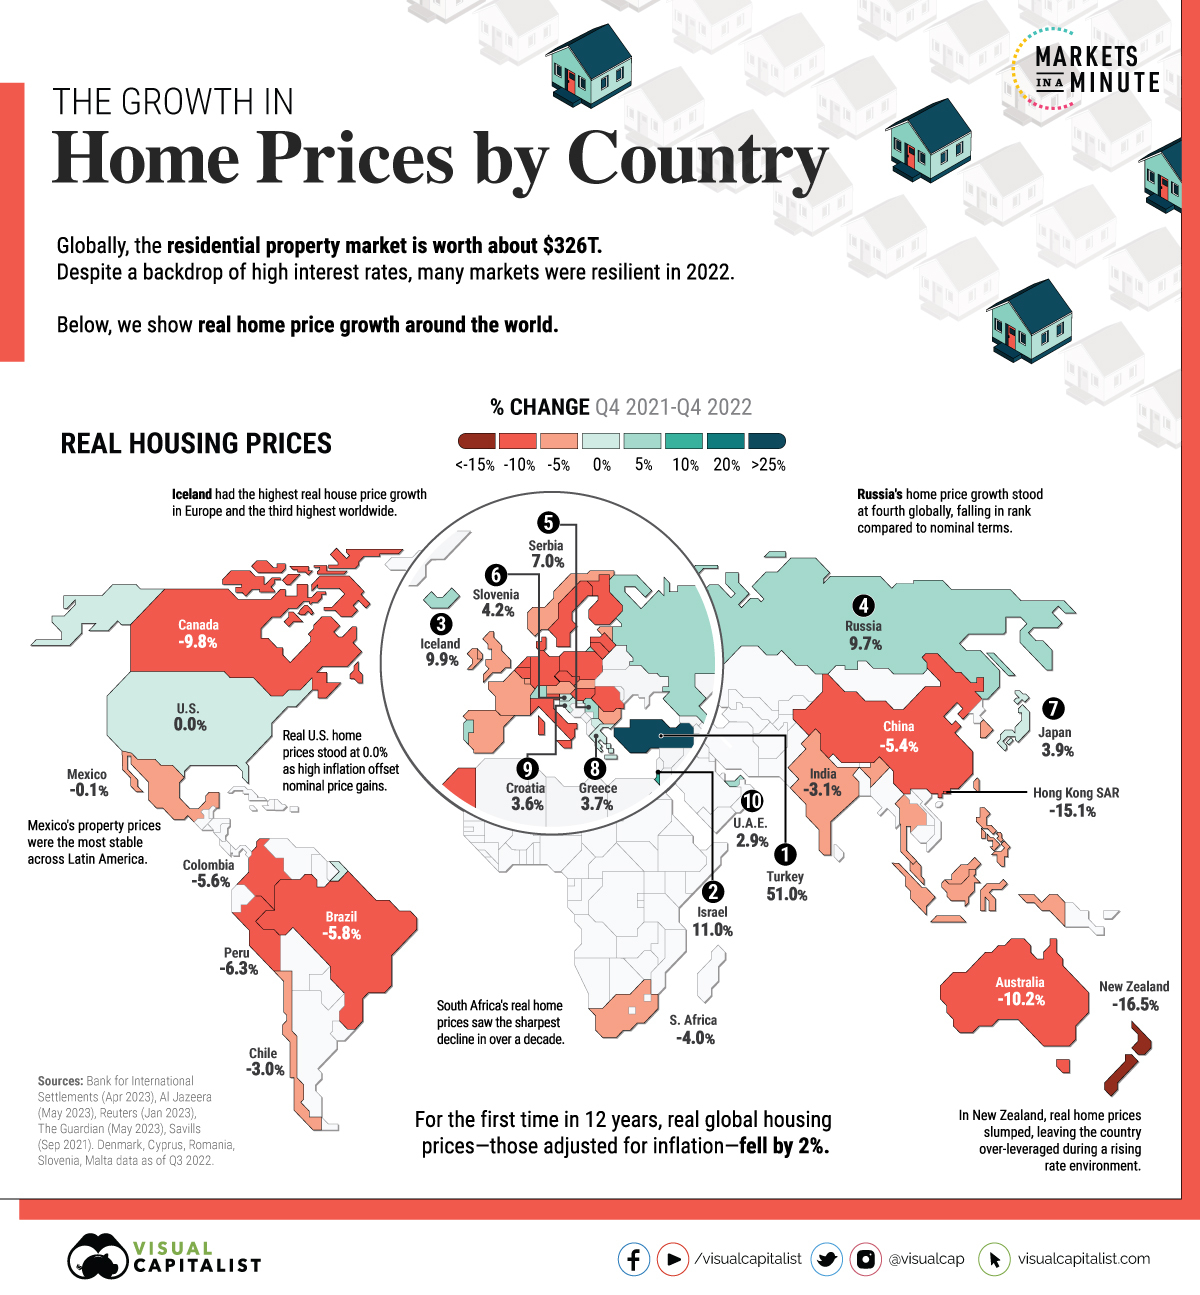
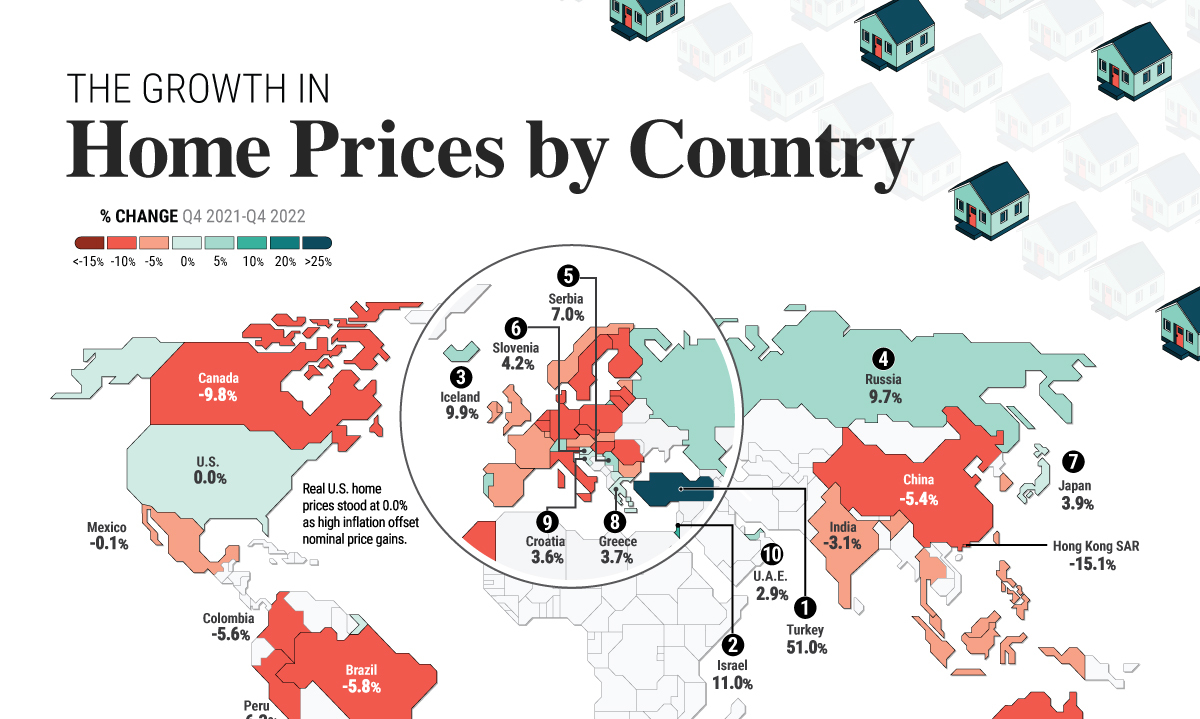
In real terms that take inflation into account, prices actually fell 2% for the first decline in 12 years. Despite a surge in interest rates and mortgage costs, housing markets were noticeably stable. Real prices remain 7% above pre-pandemic levels.
In this graphic, we show the change in residential property prices with data from the Bank for International Settlements (BIS).
The Growth in House Prices, Ranked
The following dataset from the BIS covers nominal and real house price growth across 58 countries and regions as of the fourth quarter of 2022:
| Price Growth Rank | Country / Region | Nominal Year-over-Year Change (%) | Real Year-over-Year Change (%) |
|---|---|---|---|
| 1 | 🇹🇷 Türkiye | 167.9 | 51.0 |
| 2 | 🇷🇸 Serbia | 23.1 | 7.0 |
| 3 | 🇷🇺 Russia | 23.1 | 9.7 |
| 4 | 🇲🇰 North Macedonia | 20.6 | 1.0 |
| 5 | 🇮🇸 Iceland | 20.3 | 9.9 |
| 6 | 🇭🇷 Croatia | 17.3 | 3.6 |
| 7 | 🇪🇪 Estonia | 16.9 | -3.0 |
| 8 | 🇮🇱 Israel | 16.8 | 11.0 |
| 9 | 🇭🇺 Hungary | 16.5 | -5.1 |
| 10 | 🇱🇹 Lithuania | 16.0 | -5.5 |
| 11 | 🇸🇮 Slovenia | 15.4 | 4.2 |
| 12 | 🇧🇬 Bulgaria | 13.4 | -3.2 |
| 13 | 🇬🇷 Greece | 12.2 | 3.7 |
| 14 | 🇵🇹 Portugal | 11.3 | 1.3 |
| 15 | 🇬🇧 United Kingdom | 10.0 | -0.7 |
| 16 | 🇸🇰 Slovak Republic | 9.7 | -4.8 |
| 17 | 🇦🇪 United Arab Emirates | 9.6 | 2.9 |
| 18 | 🇵🇱 Poland | 9.3 | -6.9 |
| 19 | 🇱🇻 Latvia | 9.1 | -10.2 |
| 20 | 🇸🇬 Singapore | 8.6 | 1.9 |
| 21 | 🇮🇪 Ireland | 8.6 | -0.2 |
| 22 | 🇨🇱 Chile | 8.2 | -3.0 |
| 23 | 🇯🇵 Japan | 7.9 | 3.9 |
| 24 | 🇲🇽 Mexico | 7.9 | -0.1 |
| 25 | 🇵🇭 Philippines | 7.7 | -0.2 |
| 26 | 🇺🇸 United States | 7.1 | 0.0 |
| 27 | 🇨🇿 Czechia | 6.9 | -7.6 |
| 28 | 🇷🇴 Romania | 6.7 | -7.5 |
| 29 | 🇲🇹 Malta | 6.3 | -0.7 |
| 30 | 🇨🇾 Cyprus | 6.3 | -2.9 |
| 31 | 🇨🇴 Colombia | 6.3 | -5.6 |
| 32 | 🇱🇺 Luxembourg | 5.6 | -0.5 |
| 33 | 🇪🇸 Spain | 5.5 | -1.1 |
| 34 | 🇨🇭 Switzerland | 5.4 | 2.4 |
| 35 | 🇳🇱 Netherlands | 5.4 | -5.3 |
| 36 | 🇦🇹 Austria | 5.2 | -4.8 |
| 37 | 🇫🇷 France | 4.8 | -1.2 |
| 38 | 🇧🇪 Belgium | 4.7 | -5.7 |
| 39 | 🇹🇭 Thailand | 4.7 | -1.1 |
| 40 | 🇿🇦 South Africa | 3.1 | -4.0 |
| 41 | 🇮🇳 India | 2.8 | -3.1 |
| 42 | 🇮🇹 Italy | 2.8 | -8.0 |
| 43 | 🇳🇴 Norway | 2.6 | -3.8 |
| 44 | 🇮🇩 Indonesia | 2.0 | -3.4 |
| 45 | 🇵🇪 Peru | 1.5 | -6.3 |
| 46 | 🇲🇾 Malaysia | 1.2 | -2.6 |
| 47 | 🇰🇷 South Korea | -0.1 | -5.0 |
| 48 | 🇲🇦 Morocco | -0.1 | -7.7 |
| 49 | 🇧🇷 Brazil | -0.1 | -5.8 |
| 50 | 🇫🇮 Finland | -2.3 | -10.2 |
| 51 | 🇩🇰 Denmark | -2.4 | -10.6 |
| 52 | 🇦🇺 Australia | -3.2 | -10.2 |
| 53 | 🇩🇪 Germany | -3.6 | -12.1 |
| 54 | 🇸🇪 Sweden | -3.7 | -13.7 |
| 55 | 🇨🇳 China | -3.7 | -5.4 |
| 56 | 🇨🇦 Canada | -3.8 | -9.8 |
| 57 | 🇳🇿 New Zealand | -10.4 | -16.5 |
| 58 | 🇭🇰 Hong Kong SAR | -13.5 | -15.1 |
Türkiye’s property prices jumped the highest globally, at nearly 168% amid soaring inflation.
Real estate demand has increased alongside declining interest rates. The government drastically cut interest rates from 19% in late 2021 to 8.5% to support a weakening economy.
Many European countries saw some of the highest price growth in nominal terms. A strong labor market and low interest rates pushed up prices, even as mortgage rates broadly doubled across the continent. For real price growth, most countries were in negative territory—notably Sweden, Germany, and Denmark.
Nominal U.S. housing prices grew just over 7%, while real price growth halted to 0%. Prices have remained elevated given the stubbornly low supply of inventory. In fact, residential prices remain 45% above pre-pandemic levels.
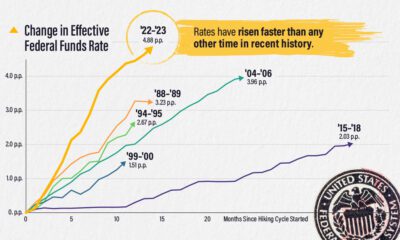
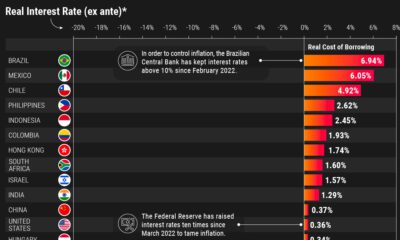
How Do Interest Rates Impact Property Markets?
Global house prices boomed during the pandemic as central banks cut interest rates to prop up economies.
Now, rates have returned to levels last seen before the Global Financial Crisis. On average, rates have increased four percentage points in many major economies. Roughly three-quarters of the countries in the BIS dataset witnessed negative year-over-year real house price growth as of the fourth quarter of 2022.
Interest rates have a large impact on property prices. Cross-country evidence shows that for every one percentage point increase in real interest rates, the growth rate of housing prices tends to fall by about two percentage points.
When Will Housing Prices Fall?
The rise in U.S. interest rates has been counteracted by homeowners being reluctant to sell so they can keep their low mortgage rates. As a result, it is keeping inventory low and prices high. Homeowners can’t sell and keep their low mortgage rates unless they meet strict conditions on a new property.
Additionally, several other factors impact price dynamics. Construction costs, income growth, labor shortages, and population growth all play a role.
With a strong labor market continuing through 2023, stable incomes may help stave off prices from falling. On the other hand, buyers with floating-rate mortgages face steeper costs and may be unable to afford new rates. This could increase housing supply in the market, potentially leading to lower prices.


Economy
Visualizing 1 Billion Square Feet of Empty Office Space
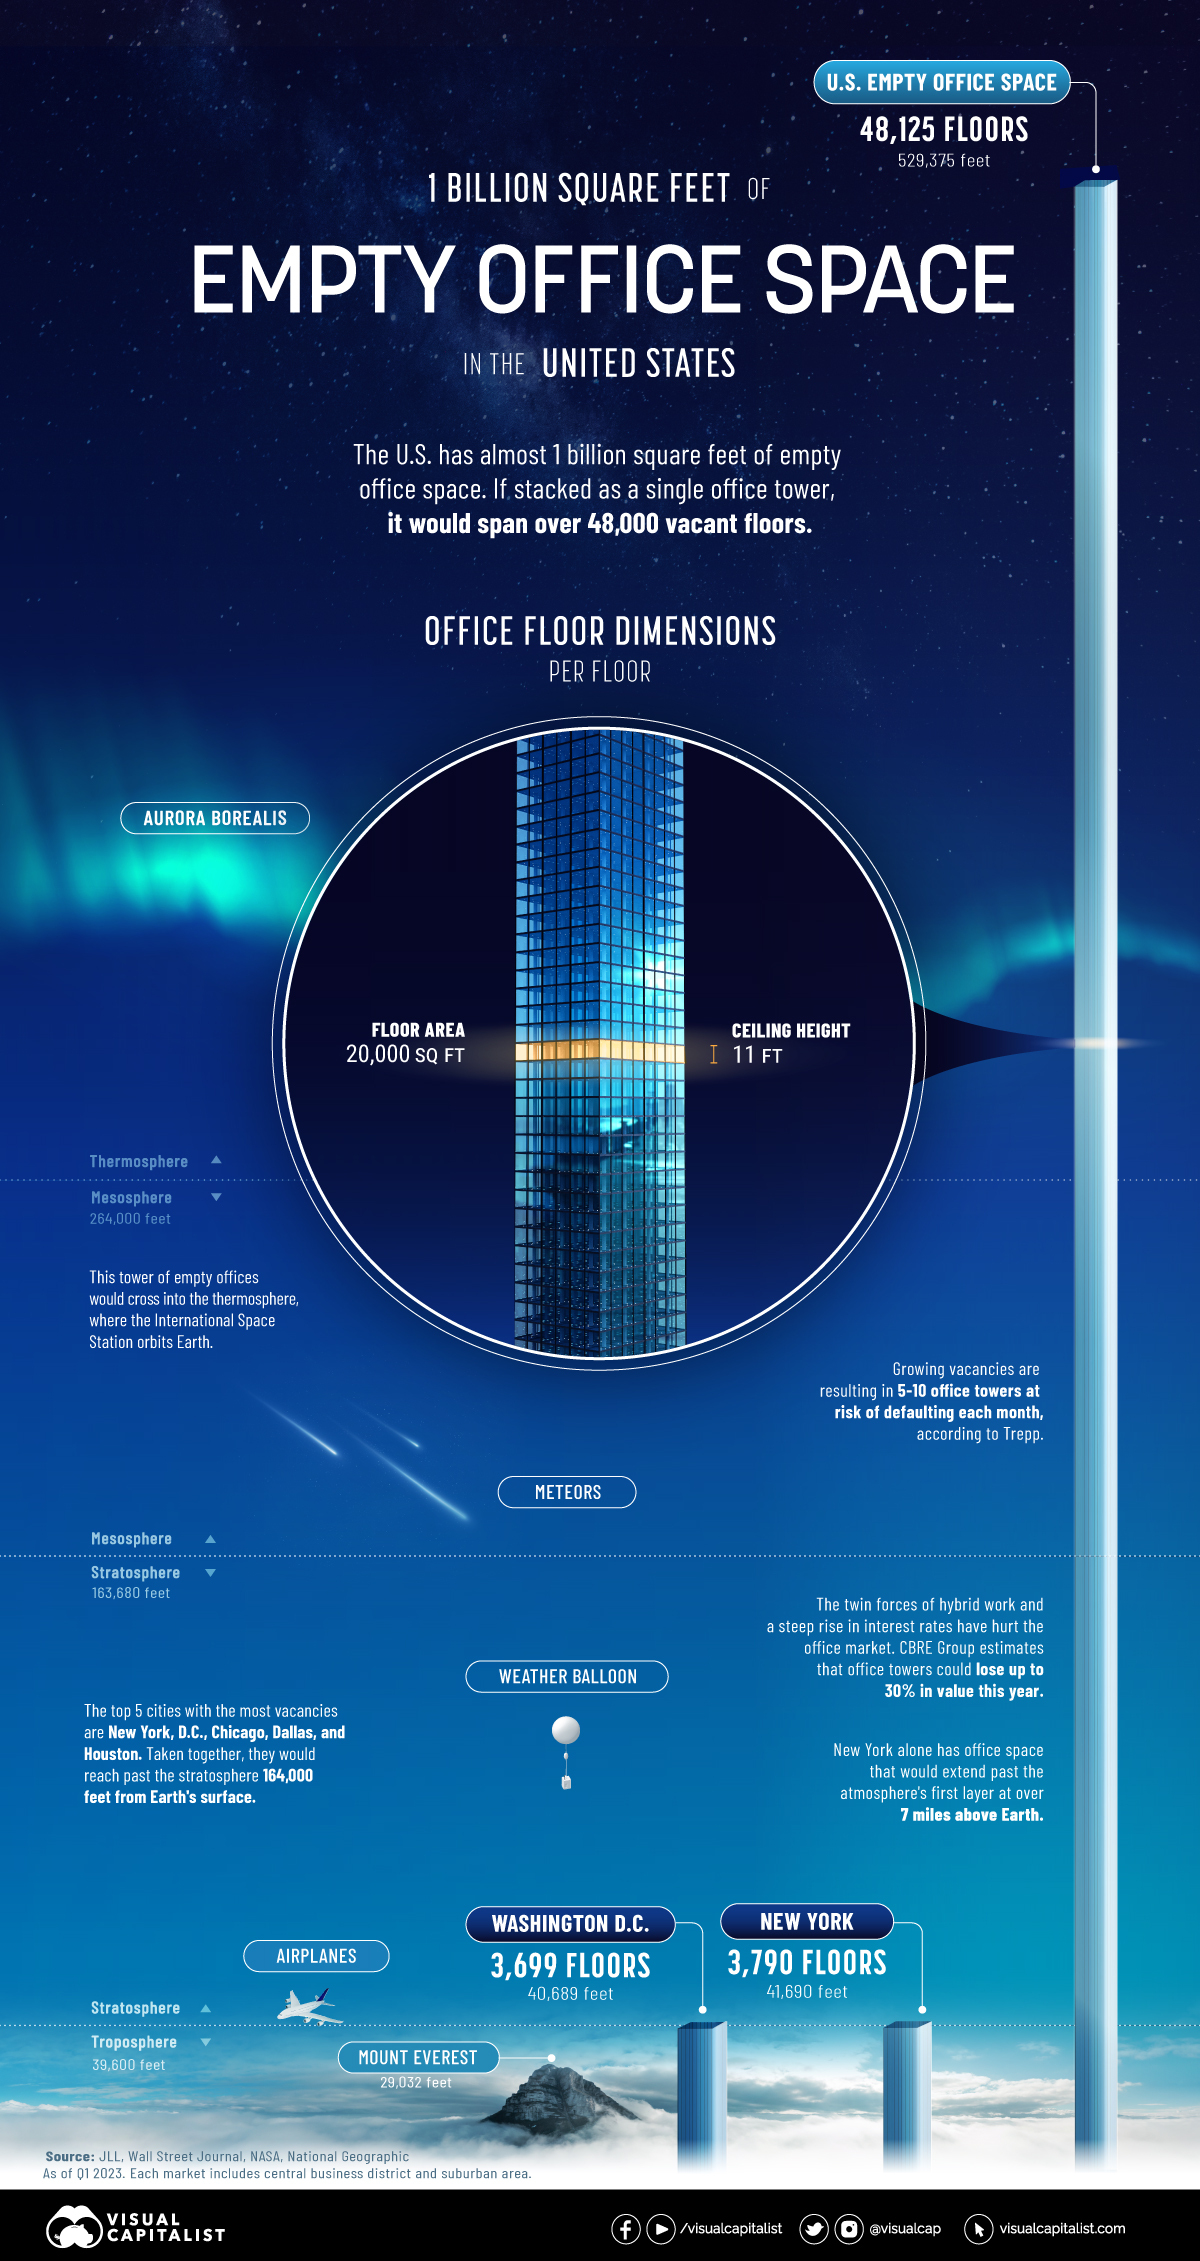
Empty office space is hitting record highs in 2023. We show almost 1 billion square feet of unused space stacked as a single office tower.

1 Billion Square Feet of Empty Office Space
In April, one of America’s largest office owners, Brookfield, defaulted on a $161 million loan.
The loan, covering 12 office buildings, was mainly concentrated in the Washington, D.C. market. Faced with low occupancy rates, it joined other office giants Blackstone and WeWork defaulting on office debt this year.
The above graphic shows nearly 1 billion square feet of empty office space in the U.S. based on data from JLL—and the wider implications of office towers standing empty.
Ranking U.S. Cities by Empty Office Space
At the end of the first quarter of 2023, a record 963 million square feet of office space was unoccupied in America. An estimated five to 10 office towers are at risk of defaulting each month according to Manus Clancy, senior managing director at Trepp.
Here are cities ranked by their total square feet of office vacancy as of Q1 2023. Figures include central business districts and suburban areas.
| Ranking | Market | Total Vacancy (SF) | Total Vacancy (%) |
|---|---|---|---|
| 1 | New York | 75.8M | 16.1% |
| 2 | Washington, D.C. | 74.0M | 20.8% |
| 3 | Chicago | 63.2M | 23.5% |
| 4 | Dallas | 53.5M | 25.0% |
| 5 | Houston | 49.3M | 25.6% |
| 6 | Los Angeles | 47.1M | 24.1% |
| 7 | New Jersey | 43.3M | 25.8% |
| 8 | Atlanta | 38.1M | 21.6% |
| 9 | Boston | 31.8M | 19.1% |
| 10 | Philadelphia | 27.8M | 18.8% |
| 11 | Denver | 27.3M | 21.6% |
| 12 | Phoenix | 25.2M | 23.9% |
| 13 | San Francisco | 22.8M | 26.4% |
| 14 | Seattle | 21.4M | 17.7% |
| 15 | Minneapolis | 19.9M | 19.7% |
| 16 | Detroit | 18.0M | 19.3% |
| 17 | Orange County | 17.7M | 17.6% |
| 18 | Salt Lake City | 13.9M | 18.5% |
| 19 | Kansas City | 13.8M | 20.8% |
| 20 | Pittsburgh | 13.8M | 21.8% |
| 21 | Charlotte | 13.7M | 20.6% |
| 22 | Austin | 13.6M | 18.9% |
| 23 | Baltimore | 13.1M | 18.2% |
| 24 | Portland | 12.8M | 17.5% |
| 25 | Silicon Valley | 12.1M | 17.3% |
| 26 | Oakland–East Bay | 11.7M | 22.0% |
| 27 | San Diego | 10.7M | 12.3% |
| 28 | St. Louis | 10.5M | 21.9% |
| 29 | Cincinnati | 10.1M | 21.4% |
| 30 | Sacramento | 9.9M | 19.6% |
| 31 | Fairfield County | 9.7M | 25.4% |
| 32 | Columbus | 9.7M | 21.7% |
| 33 | Milwaukee | 9.2M | 24.0% |
| 34 | Nashville | 9.0M | 18.9% |
| 35 | Raleigh-Durham | 8.9M | 15.2% |
| 36 | Indianapolis | 8.6M | 22.4% |
| 37 | Tampa | 8.2M | 17.2% |
| 38 | Fort Worth | 7.6M | 16.7% |
| 39 | Miami | 7.6M | 16.2% |
| 40 | Cleveland | 7.3M | 18.3% |
| 41 | San Antonio | 7.2M | 17.8% |
| 42 | Long Island | 6.3M | 15.2% |
| 43 | Westchester County | 5.8M | 22.1% |
| 44 | Jacksonville | 5.4M | 18.6% |
| 45 | Orlando | 5.0M | 13.3% |
| 46 | San Francisco Peninsula | 4.4M | 13.3% |
| 47 | Richmond | 4.3M | 13.3% |
| 48 | Fort Lauderdale | 4.3M | 16.1% |
| 49 | North San Francisco Bay | 4.0M | 18.3% |
| 50 | Louisville | 3.6M | 16.8% |
| 51 | Des Moines | 3.2M | 12.0% |
| 52 | Hampton Roads | 3.1M | 14.7% |
| 53 | West Palm Beach | 2.4M | 10.3% |
| 54 | Grand Rapids | 1.8M | 13.2% |
| United States | 962.5M | 20.2% |
Numbers may not total 100 due to rounding.
New York has roughly 76 million square feet of empty office space. If this were stacked as a single office building, it would stretch 7 miles into the atmosphere. In 2019, the office sector accounted for about a third of all jobs in the city.
Falling closely behind is Washington, D.C. with a 21% vacancy rate—8% higher than what is typically considered healthy. Occupiers are downsizing given remote work trends, yet some office buildings are being converted to residential properties, curtailing vacancy rates.
Across 54 markets in the dataset, San Francisco has the highest vacancy rate at over 26%. Prior to the pandemic, vacancy rates were about 4%. This year, Salesforce walked away from a 30-story tower in downtown San Francisco spanning 104,000 square feet in an effort to cut costs.
Overall, rising interest rates and higher vacancies have hurt U.S. office markets, with many cities potentially seeing an uptick in vacancies going forward.
Empty Office Space: Impact on Banks
Office building valuations are projected to fall 30% in 2023 according to Richard Barkham, global chief economist at CBRE Group.
A sharp decline in property values could potentially result in steep losses for banks. This is especially true for small and regional banks that make up the majority of U.S. office loans. Big banks cover roughly 20% of office and downtown retail totals.
Consider how commercial real estate exposure breaks down by different types of banks:
| Bank Assets | Commercial Real Estate Loans % of Total Assets | Share of Industry Assets |
|---|---|---|
| <$100M | 11.3% | 0.2% |
| $100M-$1B | 26.9% | 4.7% |
| $1B-$10B | 32.5% | 9.7% |
| $10B-$250B | 18.1% | 30.1% |
| >$250B | 5.6% | 55.5% |
Source: FitchRatings
For big banks, a recent stress test by the Federal Reserve shows that a 40% decline in commercial property values could result in a $65 billion loss on their commercial loan portfolios. The good news is that many big banks are sitting on healthy capital reserves based on requirements set in place after the global financial crisis.
Smaller banks are a different story. Many have higher loan concentrations and less oversight on reserve requirements. If these loan portfolios deteriorate, banks may face a downgrade in ratings and higher credit losses.
Additionally, banks with loans in markets with high vacancy rates like San Francisco, Houston, and Washington, D.C. could see more elevated risk.
How High Rates Could Escalate Losses
Adding further strain are the ramifications of higher interest rates.
Higher rates have negatively impacted smaller banks’ balance sheets—meaning they are less likely to issue new loans. This is projected to cause commercial real estate transaction volume to decline 27% in 2023, contributing to lower prices. Banks have already slowed lending for commercial real estate in 2023 due to credit quality concerns.
The good news is that some banks are extending existing loan terms or restructuring debt. In this way, banks are willing to negotiate new loan agreements to prevent widespread foreclosures from hurting their commercial loan portfolios. Short-term extensions on existing loans were often seen during the global financial crisis.
Still, foreclosures could take place if restructuring the loan doesn’t make financial sense.
Overall, only so many banks may be willing to wait out the uncertainty with loan extensions if fundamentals continue to worsen. Offices that are positioned to weather declines will likely have better quality, location, roster of tenants, and financing structures.

-

 United States3 weeks ago
Chart: U.S. Home Price Growth Over 50 Years
-

 Crime1 week ago
Mapped: The Most Dangerous Cities in the U.S.
-

 Energy3 weeks ago
How Old Are the World’s Nuclear Reactors?
-

 Countries7 days ago
Mapped: World’s Top 40 Largest Military Budgets
-

 Markets3 weeks ago
How Big is the Market for Crude Oil?
-

 Maps7 days ago
Mapped: The Safest Cities in the U.S.
-

 Markets2 weeks ago
Ranked: The Most Profitable U.S. Companies, by Sector
-

 Technology5 days ago
How Long it Took for Popular Apps to Reach 100 Million Users