Markets
Mapped: GDP Growth Forecasts by Country, in 2023


Mapped: GDP Growth Forecasts by Country, in 2023
This was originally posted on Advisor Channel. Sign up to the free mailing list to get beautiful visualizations on financial markets that help advisors and their clients.
Since Russia’s invasion of Ukraine early last year, talk of global recession has dominated the outlook for 2023.
High inflation, spurred by rising energy costs, has tested GDP growth. Tightening monetary policy in the U.S., with interest rates jumping from roughly 0% to over 4% in 2022, has historically preceded a downturn about one to two years later.
For European economies, energy prices are critical. The good news is that prices have fallen recently since March highs, but the continent remains on shaky ground.
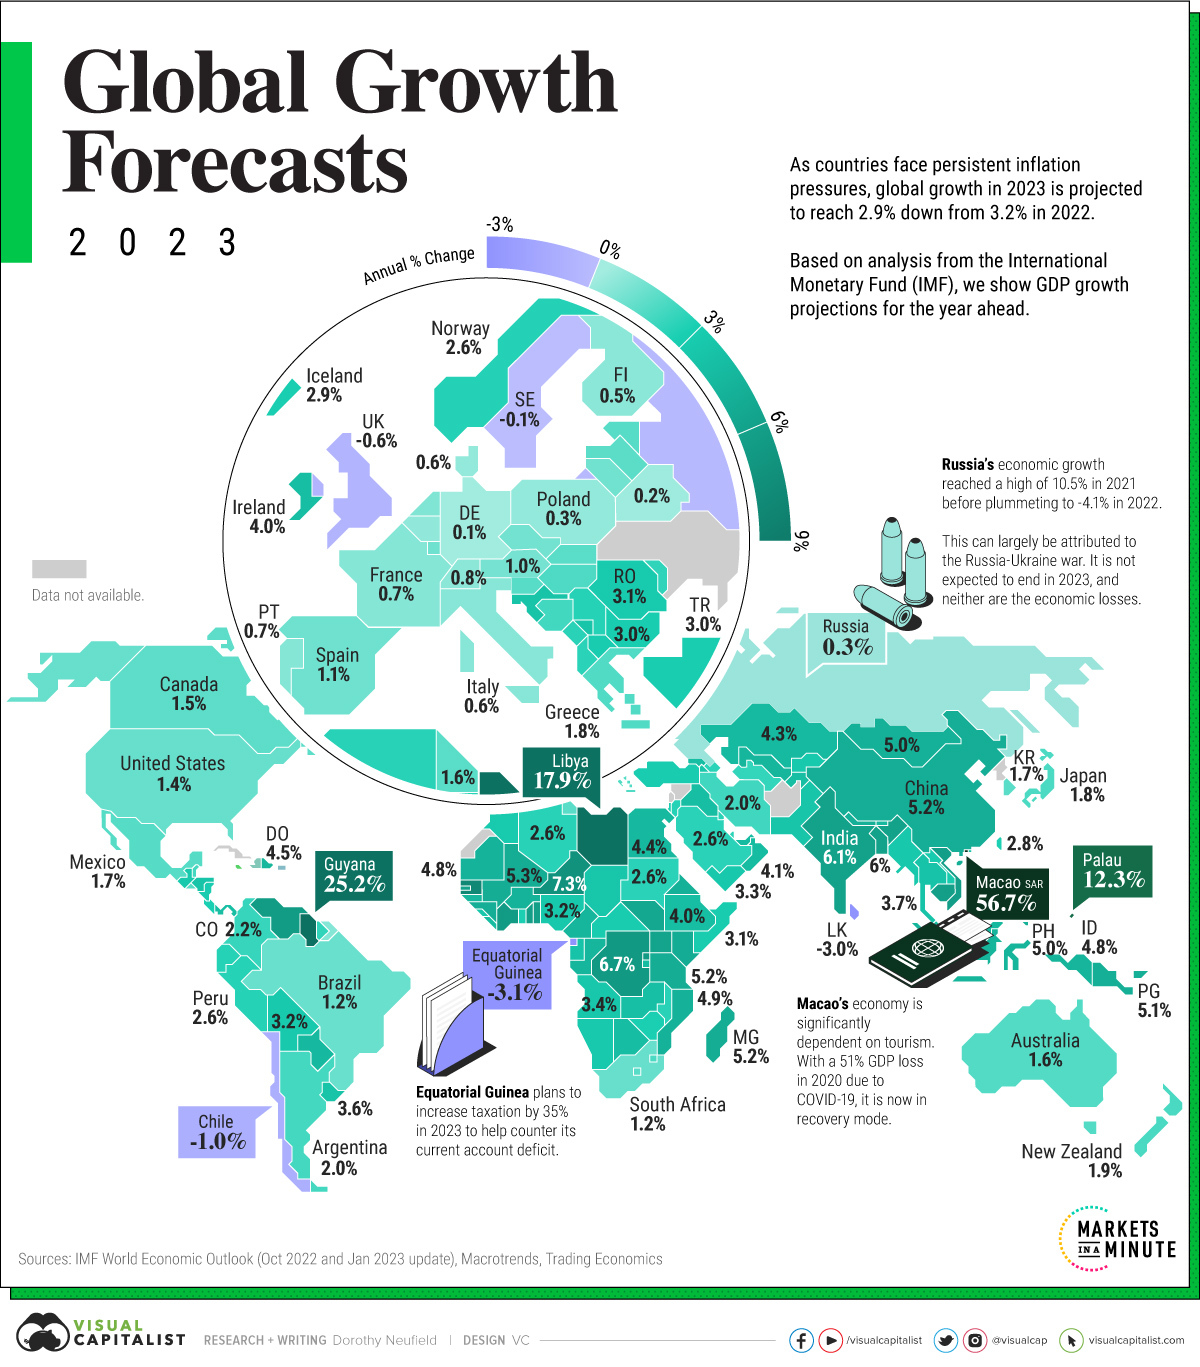
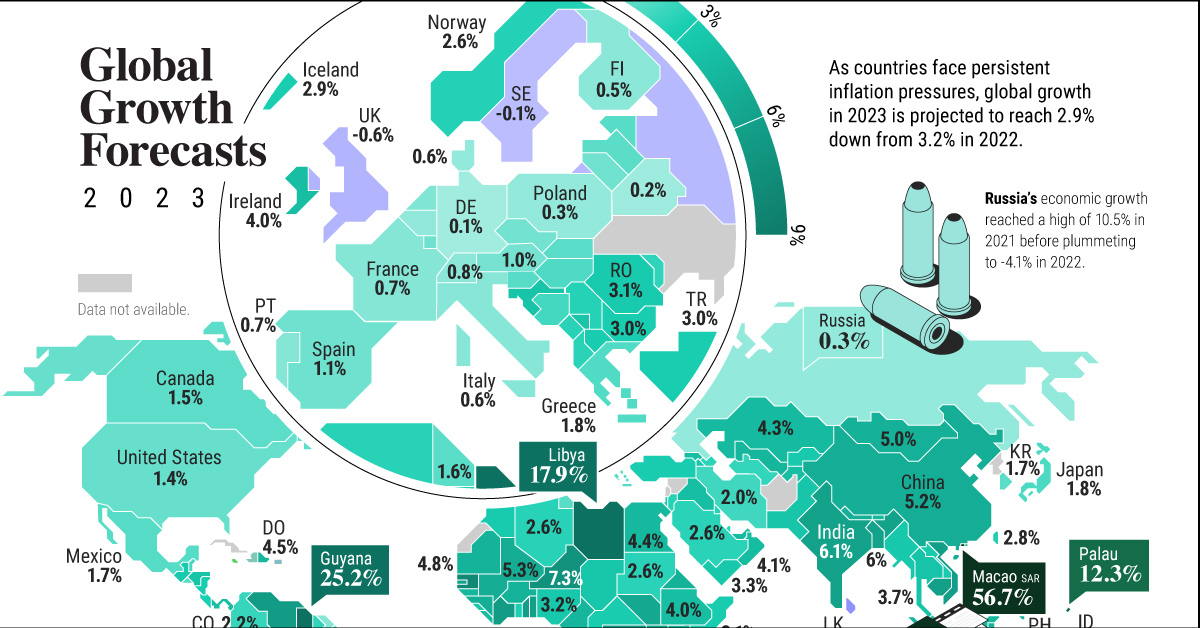
The above infographic maps GDP growth forecasts by country for the year ahead, based on projections from the International Monetary Fund (IMF) October 2022 Outlook and January 2023 update.
2023 GDP Growth Outlook
The world economy is projected to see just 2.9% GDP growth in 2023, down from 3.2% projected for 2022.
This is a 0.2% increase since the October 2022 Outlook thanks in part to China’s reopening, higher global demand, and slowing inflation projected across certain countries in the year ahead.
With this in mind, we show GDP growth forecasts for 191 jurisdictions given multiple economic headwinds—and a few emerging bright spots in 2023.
| Country / Region | 2023 Real GDP % Change (Projected) |
|---|---|
| 🇦🇱 Albania | 2.5% |
| 🇩🇿 Algeria | 2.6% |
| 🇦🇴 Angola | 3.4% |
| 🇦🇬 Antigua and Barbuda | 5.6% |
| 🇦🇷 Argentina* | 2.0% |
| 🇦🇲 Armenia | 3.5% |
| 🇦🇼 Aruba | 2.0% |
| 🇦🇺 Australia* | 1.6% |
| 🇦🇹 Austria | 1.0% |
| 🇦🇿 Azerbaijan | 2.5% |
| 🇧🇭 Bahrain | 3.0% |
| 🇧🇩 Bangladesh | 6.0% |
| 🇧🇧 Barbados | 5.0% |
| 🇧🇾 Belarus | 0.2% |
| 🇧🇪 Belgium | 0.4% |
| 🇧🇿 Belize | 2.0% |
| 🇧🇯 Benin | 6.2% |
| 🇧🇹 Bhutan | 4.3% |
| 🇧🇴 Bolivia | 3.2% |
| 🇧🇦 Bosnia and Herzegovina | 2.0% |
| 🇧🇼 Botswana | 4.0% |
| 🇧🇷 Brazil* | 1.2% |
| 🇧🇳 Brunei Darussalam | 3.3% |
| 🇧🇬 Bulgaria | 3.0% |
| 🇧🇫 Burkina Faso | 4.8% |
| 🇧🇮 Burundi | 4.1% |
| 🇨🇻 Cabo Verde | 4.8% |
| 🇨🇲 Cameroon | 4.6% |
| 🇰🇭 Cambodia | 6.2% |
| 🇨🇦 Canada* | 1.5% |
| 🇨🇫 Central African Republic | 3.0% |
| 🇹🇩 Chad | 3.4% |
| 🇨🇱 Chile | -1.0% |
| 🇨🇳 China* | 5.3% |
| 🇨🇴 Colombia | 2.2% |
| 🇰🇲 Comoros | 3.4% |
| 🇨🇷 Costa Rica | 2.9% |
| 🇨🇮 Côte d'Ivoire | 6.5% |
| 🇭🇷 Croatia | 3.5% |
| 🇨🇾 Cyprus | 2.5% |
| 🇨🇿 Czech Republic | 1.5% |
| 🇨🇩 Democratic Republic of the Congo | 6.7% |
| 🇩🇰 Denmark | 0.6% |
| 🇩🇯 Djibouti | 5.0% |
| 🇩🇲 Dominica | 4.9% |
| 🇩🇴 Dominican Republic | 4.5% |
| 🇪🇨 Ecuador | 2.7% |
| 🇪🇬 Egypt* | 4.0% |
| 🇸🇻 El Salvador | 1.7% |
| 🇬🇶 Equatorial Guinea | -3.1% |
| 🇪🇷 Eritrea | 2.9% |
| 🇪🇪 Estonia | 1.8% |
| 🇸🇿 Eswatini | 1.8% |
| 🇪🇹 Ethiopia | 5.3% |
| 🇫🇯 Fiji | 6.9% |
| 🇫🇮 Finland | 0.5% |
| 🇫🇷 France* | 0.7% |
| 🇲🇰 North Macedonia | 3.0% |
| 🇬🇦 Gabon | 3.7% |
| Georgia | 4.0% |
| Germany* | 0.1% |
| Ghana | 2.8% |
| Greece | 1.8% |
| Grenada | 3.6% |
| Guatemala | 3.2% |
| Guinea | 5.1% |
| Guinea-Bissau | 4.5% |
| Guyana | 25.2% |
| Haiti | 0.5% |
| Honduras | 3.5% |
| Hong Kong SAR | 3.9% |
| Hungary | 1.8% |
| Iceland | 2.9% |
| India* | 6.1% |
| Indonesia* | 4.8% |
| Iraq | 4.0% |
| Ireland | 4.0% |
| Iran* | 2.0% |
| Israel | 3.0% |
| Italy* | 0.6% |
| Jamaica | 3.0% |
| Japan* | 1.8% |
| Jordan | 2.7% |
| Kazakhstan* | 4.3% |
| Kenya | 5.1% |
| Kiribati | 2.4% |
| South Korea* | 1.7% |
| Kosovo | 3.5% |
| Kuwait | 2.6% |
| Kyrgyz Republic | 3.2% |
| Lao P.D.R. | 3.1% |
| Latvia | 1.6% |
| Lesotho | 1.6% |
| Liberia | 4.2% |
| Libya | 17.9% |
| Lithuania | 1.1% |
| Luxembourg | 1.1% |
| Macao SAR | 56.7% |
| Madagascar | 5.2% |
| 🇲🇼 Malawi | 2.5% |
| 🇲🇾 Malaysia* | 4.4% |
| 🇲🇻 Maldives | 6.1% |
| 🇲🇱 Mali | 5.3% |
| 🇲🇹 Malta | 3.3% |
| 🇲🇭 Marshall Islands | 3.2% |
| 🇲🇷 Mauritania | 4.8% |
| 🇲🇺 Mauritius | 5.4% |
| 🇲🇽 Mexico* | 1.7% |
| 🇫🇲 Micronesia | 2.9% |
| 🇲🇩 Moldova | 2.3% |
| 🇲🇳 Mongolia | 5.0% |
| 🇲🇪 Montenegro | 2.5% |
| 🇲🇦 Morocco | 3.1% |
| 🇲🇿 Mozambique | 4.9% |
| 🇲🇲 Myanmar | 3.3% |
| 🇳🇦 Namibia | 3.2% |
| 🇳🇷 Nauru | 2.0% |
| 🇳🇵 Nepal | 5.0% |
| 🇳🇱 Netherlands* | 0.6% |
| 🇳🇿 New Zealand | 1.9% |
| 🇳🇮 Nicaragua | 3.0% |
| 🇳🇪 Niger | 7.3% |
| 🇳🇬 Nigeria* | 3.2% |
| 🇳🇴 Norway | 2.6% |
| 🇴🇲 Oman | 4.1% |
| 🇵🇰 Pakistan* | 2.0% |
| 🇵🇼 Palau | 12.3% |
| 🇵🇦 Panama | 4.0% |
| 🇵🇬 Papua New Guinea | 5.1% |
| 🇵🇾 Paraguay | 4.3% |
| 🇵🇪 Peru | 2.6% |
| 🇵🇭 Philippines* | 5.0% |
| 🇵🇱 Poland* | 0.3% |
| 🇵🇹 Portugal | 0.7% |
| 🇵🇷 Puerto Rico | 0.4% |
| 🇶🇦 Qatar | 2.4% |
| 🇨🇬 Republic of Congo | 4.6% |
| 🇷🇴 Romania | 3.1% |
| 🇷🇺 Russia* | 0.3% |
| 🇷🇼 Rwanda | 6.7% |
| 🇼🇸 Samoa | 4.0% |
| 🇸🇲 San Marino | 0.8% |
| 🇸🇹 São Tomé and Príncipe | 2.6% |
| 🇸🇦 Saudi Arabia* | 2.6% |
| 🇸🇳 Senegal | 8.1% |
| 🇷🇸 Serbia | 2.7% |
| 🇸🇨 Seychelles | 5.2% |
| 🇸🇱 Sierra Leone | 3.3% |
| 🇸🇬 Singapore | 2.3% |
| 🇸🇰 Slovak Republic | 1.5% |
| 🇸🇮 Slovenia | 1.7% |
| 🇸🇧 Solomon Islands | 2.6% |
| 🇸🇴 Somalia | 3.1% |
| 🇿🇦 South Africa* | 1.2% |
| 🇸🇸 South Sudan | 5.6% |
| 🇪🇸 Spain* | 1.1% |
| 🇱🇰 Sri Lanka | -3.0% |
| 🇰🇳 St. Kitts and Nevis | 4.8% |
| 🇱🇨 St. Lucia | 5.8% |
| 🇻🇨 St. Vincent and the Grenadines | 6.0% |
| 🇸🇩 Sudan | 2.6% |
| 🇸🇷 Suriname | 2.3% |
| 🇸🇪 Sweden | -0.1% |
| 🇨🇭 Switzerland | 0.8% |
| 🇹🇼 Taiwan | 2.8% |
| 🇹🇯 Tajikistan | 4.0% |
| 🇹🇿 Tanzania | 5.2% |
| 🇹🇭 Thailand* | 3.7% |
| 🇧🇸 The Bahamas | 4.1% |
| 🇬🇲 The Gambia | 6.0% |
| 🇹🇱 Timor-Leste | 4.2% |
| 🇹🇬 Togo | 6.2% |
| 🇹🇴 Tonga | 2.9% |
| 🇹🇹 Trinidad and Tobago | 3.5% |
| 🇹🇳 Tunisia | 1.6% |
| 🇹🇷 Turkey* | 3.0% |
| 🇹🇲 Turkmenistan | 2.3% |
| 🇹🇻 Tuvalu | 3.5% |
| 🇺🇬 Uganda | 5.9% |
| 🇺🇦 Ukraine | N/A |
| 🇦🇪 United Arab Emirates | 4.2% |
| 🇬🇧 United Kingdom* | -0.6% |
| 🇺🇲 U.S.* | 1.4% |
| 🇺🇾 Uruguay | 3.6% |
| 🇺🇿 Uzbekistan | 4.7% |
| 🇻🇺 Vanuatu | 3.1% |
| 🇻🇪 Venezuela | 6.5% |
| 🇻🇳 Vietnam | 6.2% |
| West Bank and Gaza | 3.5% |
| 🇾🇪 Yemen | 3.3% |
| 🇿🇲 Zambia | 4.0% |
| 🇿🇼 Zimbabwe | 2.8% |
*Reflect updated figures from the January 2023 IMF Update.
The U.S. is forecast to see 1.4% GDP growth in 2023, up from 1.0% seen in the last October projection.
Still, signs of economic weakness can be seen in the growing wave of tech layoffs, foreshadowed as a white-collar or ‘Patagonia-vest’ recession. Last year, 88,000 tech jobs were cut and this trend has continued into 2023. Major financial firms have also followed suit. Still, unemployment remains fairly steadfast, at 3.5% as of December 2022. Going forward, concerns remain around inflation and the path of interest rate hikes, though both show signs of slowing.
Across Europe, the average projected GDP growth rate is 0.7% for 2023, a sharp decline from the 2.1% forecast for last year.
Both Germany and Italy are forecast to see slight growth, at 0.1% and 0.6%, respectively. Growth forecasts were revised upwards since the IMF’s October release. However, an ongoing energy crisis exposes the manufacturing sector to vulnerabilities, with potential spillover effects to consumers and businesses, and overall Euro Area growth.
China remains an open question. In 2023, growth is predicted to rise 5.2%, higher than many large economies. While its real estate sector has shown signs of weakness, the recent opening on January 8th, following 1,016 days of zero-Covid policy, could boost demand and economic activity.
A Long Way to Go
The IMF has stated that 2023 will feel like a recession for much of the global economy. But whether it is headed for a recovery or a sharper decline remains unknown.
Today, two factors propping up the global economy are lower-than-expected energy prices and resilient private sector balance sheets. European natural gas prices have sunk to levels seen before the war in Ukraine. During the height of energy shocks, firms showed a notable ability to withstand astronomical energy prices squeezing their finances. They are also sitting on significant cash reserves.
On the other hand, inflation is far from over. To counter this effect, many central banks will have to use measures to rein in prices. This may in turn have a dampening effect on economic growth and financial markets, with unknown consequences.
As economic data continues to be released over the year, there may be a divergence between consumer sentiment and whether things are actually changing in the economy. Where the economy is heading in 2023 will be anyone’s guess.


Stocks
The 50 Best One-Year Returns on the S&P 500 (1980-2022)
The highest one-year return among the top S&P 500 stocks from 1980 to 2022 was a staggering 2,620%. Which stocks top the ranks?

The Top S&P 500 Stocks by Annual Returns
The average annual return of the S&P 500 was 10% from 1980-2022, excluding dividends. Of course, there are some companies that deliver much higher returns in any given year.
In this graphic using data from S&P Dow Jones Indices, we explore the top S&P 500 stocks with the best single year returns over the last four decades.
Ranking the Top S&P 500 Stocks
In order to find the top gainers, S&P took the top 10 best-performing stocks each year and then narrowed that list down to the top 50 overall. They ranked the top S&P 500 stocks by price returns, meaning that no dividends or stock distributions were included.
The best gains were clustered in a few select years, including the 1999 dot-com boom, the 2003 stock market rally, and the 2009 recovery from the Global Financial Crisis. None of the biggest gains happened in 2021 or 2022.
| Rank | Company | Sector | Return | Year |
|---|---|---|---|---|
| 1 | Qualcomm | Information Technology | 2620% | 1999 |
| 2 | Tesla | Consumer Discretionary | 743% | 2020 |
| 3 | DSC Communications | Communication Services | 468% | 1992 |
| 4 | Coleco Industries | Consumer Discretionary | 435% | 1982 |
| 5 | Avaya | Information Technology | 428% | 2003 |
| 6 | Chrysler | Consumer Discretionary | 426% | 1982 |
| 7 | XL Capital (Axa XL) | Financials | 395% | 2009 |
| 8 | Tenet Healthcare | Healthcare | 369% | 2009 |
| 9 | Dynegy | Utilities | 361% | 2000 |
| 10 | Advanced Micro Devices | Information Technology | 348% | 2009 |
| 11 | Sprint | Communication Services | 343% | 1999 |
| 12 | Ford | Consumer Discretionary | 337% | 2009 |
| 13 | NEXTEL Communications | Communication Services | 336% | 1999 |
| 14 | LSI Logic | Information Technology | 319% | 1999 |
| 15 | NVIDIA | Information Technology | 308% | 2001 |
| 16 | Nortel Networks | Communication Services | 304% | 1999 |
| 17 | Etsy | Consumer Discretionary | 302% | 2020 |
| 18 | Genworth Financial | Financials | 301% | 2009 |
| 19 | Micron Technology | Information Technology | 300% | 2009 |
| 20 | NetFlix | Communication Services | 298% | 2013 |
| 21 | Oracle | Information Technology | 290% | 1999 |
| 22 | Western Digital | Information Technology | 286% | 2009 |
| 23 | Network Appliance (NetApp) | Information Technology | 270% | 1999 |
| 24 | Data General | Information Technology | 267% | 1991 |
| 25 | Yahoo | Communication Services | 265% | 1999 |
| 26 | Williams Companies | Energy | 264% | 2003 |
| 27 | Novell | Information Technology | 264% | 1991 |
| 28 | Dynegy | Utilities | 263% | 2003 |
| 29 | Sun Microsystems | Information Technology | 262% | 1999 |
| 30 | PMC-Sierra | Information Technology | 262% | 2003 |
| 31 | Advanced Micro Devices | Information Technology | 259% | 1991 |
| 32 | Dell | Information Technology | 248% | 1998 |
| 33 | Global Marine | Energy | 247% | 1980 |
| 34 | Micron Technology | Information Technology | 243% | 2013 |
| 35 | Best Buy | Consumer Discretionary | 237% | 2013 |
| 36 | Reebok | Consumer Discretionary | 234% | 2000 |
| 37 | Freeport-McMoRan | Materials | 229% | 2009 |
| 38 | Biomet (Zimmer Biomet) | Healthcare | 226% | 1991 |
| 39 | NVIDIA | Information Technology | 224% | 2016 |
| 40 | Gap | Consumer Discretionary | 223% | 1991 |
| 41 | NetFlix | Communication Services | 219% | 2010 |
| 42 | Fleetwood Enterprises (Fleetwood RV) | Consumer Discretionary | 217% | 1982 |
| 43 | National Semiconductor | Information Technology | 217% | 1999 |
| 44 | Dell | Information Technology | 216% | 1997 |
| 45 | Tandy Corp (RadioShack) | Information Technology | 216% | 1980 |
| 46 | Novell | Information Technology | 215% | 2003 |
| 47 | Corning | Information Technology | 215% | 2003 |
| 48 | CB Richard Ellis (CBRE) | Real Estate | 214% | 2009 |
| 49 | AES Corp | Utilities | 213% | 2003 |
| 50 | Expedia | Consumer Discretionary | 212% | 2009 |
Qualcomm was by far the top-performer in any one calendar year window. The company had key patents for Code Division Multiple Access (CDMA) technology, which enabled fast wireless internet access and became the basis for 3G networks.
Its stock took off in 1999 as it shed less profitable business lines, resolved a patent dispute with competitor Ericsson, and joined the S&P 500 Index. At the time, CNN reported that one lucky investor who heard about Qualcomm from an investment-banker-turned-rabbi earned $17 million—roughly $30 million in today’s dollars.
The most recent stocks to make the rankings were both from 2020: well-known Tesla (#2) and lesser-known online marketplace Etsy (#17), which saw sales from independent creators surge during the early COVID-19 pandemic. The dollar value of items sold on Etsy more than doubled from $5.3 billion in 2019 to $10.3 billion in 2020, with mask sales accounting for 7% of the total.
Biggest Gainers in Each Sector
While information technology stocks made up nearly half of the list, there is representation from nine of the 11 S&P 500 sectors. No companies from the Industrials or Consumer Staples sectors made it into the ranks of the top S&P 500 stocks by annual returns.
Below, we show the stock with the best annual return for each sector.

Tesla was the top-performing Consumer Discretionary stock on the list. After meeting the requirement of four consecutive quarters of positive earnings, it joined the S&P 500 Index on December 21, 2020. The company’s performance was boosted by the announcement that it would be included in the S&P 500, along with strong performance in China, and general EV buzz as environmental regulations tightened worldwide.
In the realm of Communication Services, DSC Communications saw a sizable return in 1992. The telecommunications equipment company had contracts with major companies such as Bell and Motorola. Alcatel-Lucent (then Alcatel), a French producer of mobile phones, purchased DSC Communications in 1998.
Serial Success Stories
It’s impressive to make the list of the top S&P 500 stocks by calendar returns once, but there are seven companies that have done it twice.
Some stocks saw their repeated outperformance close together, with Dell making the ranks back-to-back in 1997 and 1998.

On the other hand, a select few have more staying power. Computing giant NVIDIA topped the charts in 2001 and triumphed again 15 years later in 2016. And this year might be another win, as the company has recently reached a $1 trillion market capitalization and has the highest year-to-date return in the S&P 500 as of July 6, 2023.
-

 Energy4 weeks ago
Life Cycle Emissions: EVs vs. Combustion Engine Vehicles
-

 Maps2 weeks ago
Vintage Viz: The World’s Rivers and Lakes, Organized Neatly
-

 United States3 weeks ago
Visualized: The 100 Largest U.S. Banks by Consolidated Assets
-

 Automation1 week ago
Charted: Changing Sentiments Towards AI in the Workplace
-

 Markets3 weeks ago
What are Top Investment Managers Holding in Their Portfolios?
-

 Stocks1 week ago
The 50 Best One-Year Returns on the S&P 500 (1980-2022)
-

 Markets3 weeks ago
Chart: U.S. Home Price Growth Over 50 Years
-

 Cities1 week ago
Mapped: The Most Dangerous Cities in the U.S.