Money
All of the World’s Money and Markets in One Visualization (2022)


All of the World’s Money and Markets in One Visualization
The era of easy money is now officially over.
For 15 years, policymakers have tried to stimulate the global economy through money creation, zero interest-rate policies, and more recently, aggressive COVID fiscal stimulus.
With capital at near-zero costs over this stretch, investors started to place more value on cash flows in the distant future. Assets inflated and balance sheets expanded, and money inevitably chased more speculative assets like NFTs, crypto, or unproven venture-backed startups.
But the free money party has since ended, after persistent inflation prompted the sudden reversal of many of these policies. And as Warren Buffett says, it’s only when the tide goes out do you get to see “who’s been swimming naked.”
Measuring Money and Markets in 2022
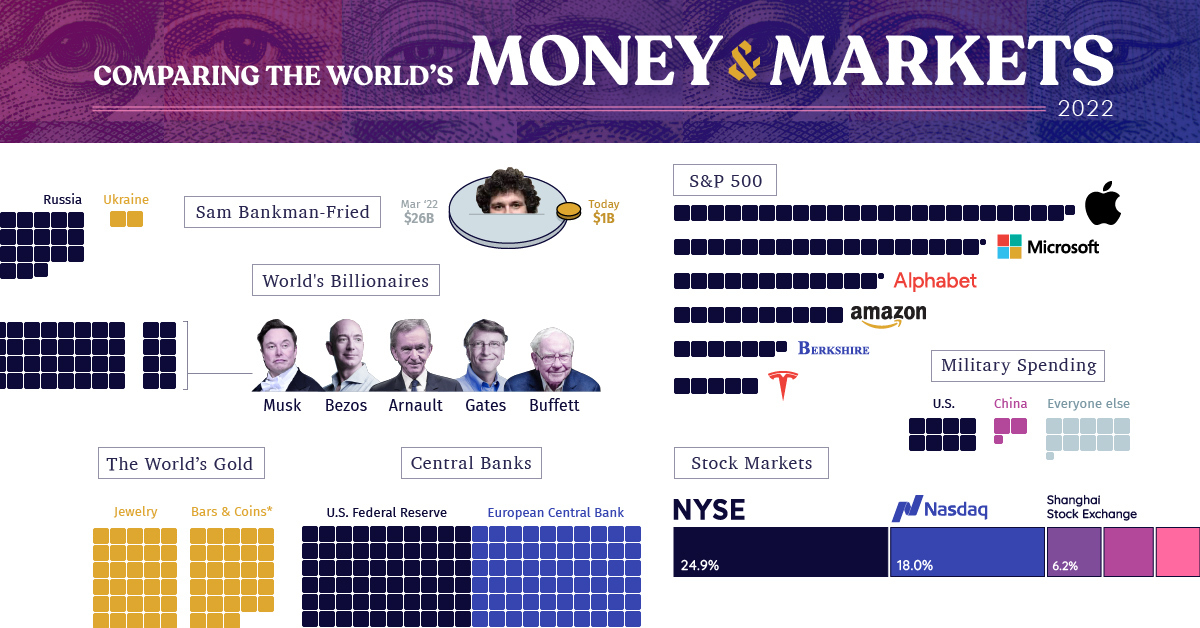
Every time we publish this visualization, our common unit of measurement is a two-dimensional box with a value of $100 billion.
Even though you need many of these to convey the assets on the balance sheet of the U.S. Federal Reserve, or the private wealth held by the world’s billionaires, it’s quite amazing to think what actually fits within this tiny building block of measurement:
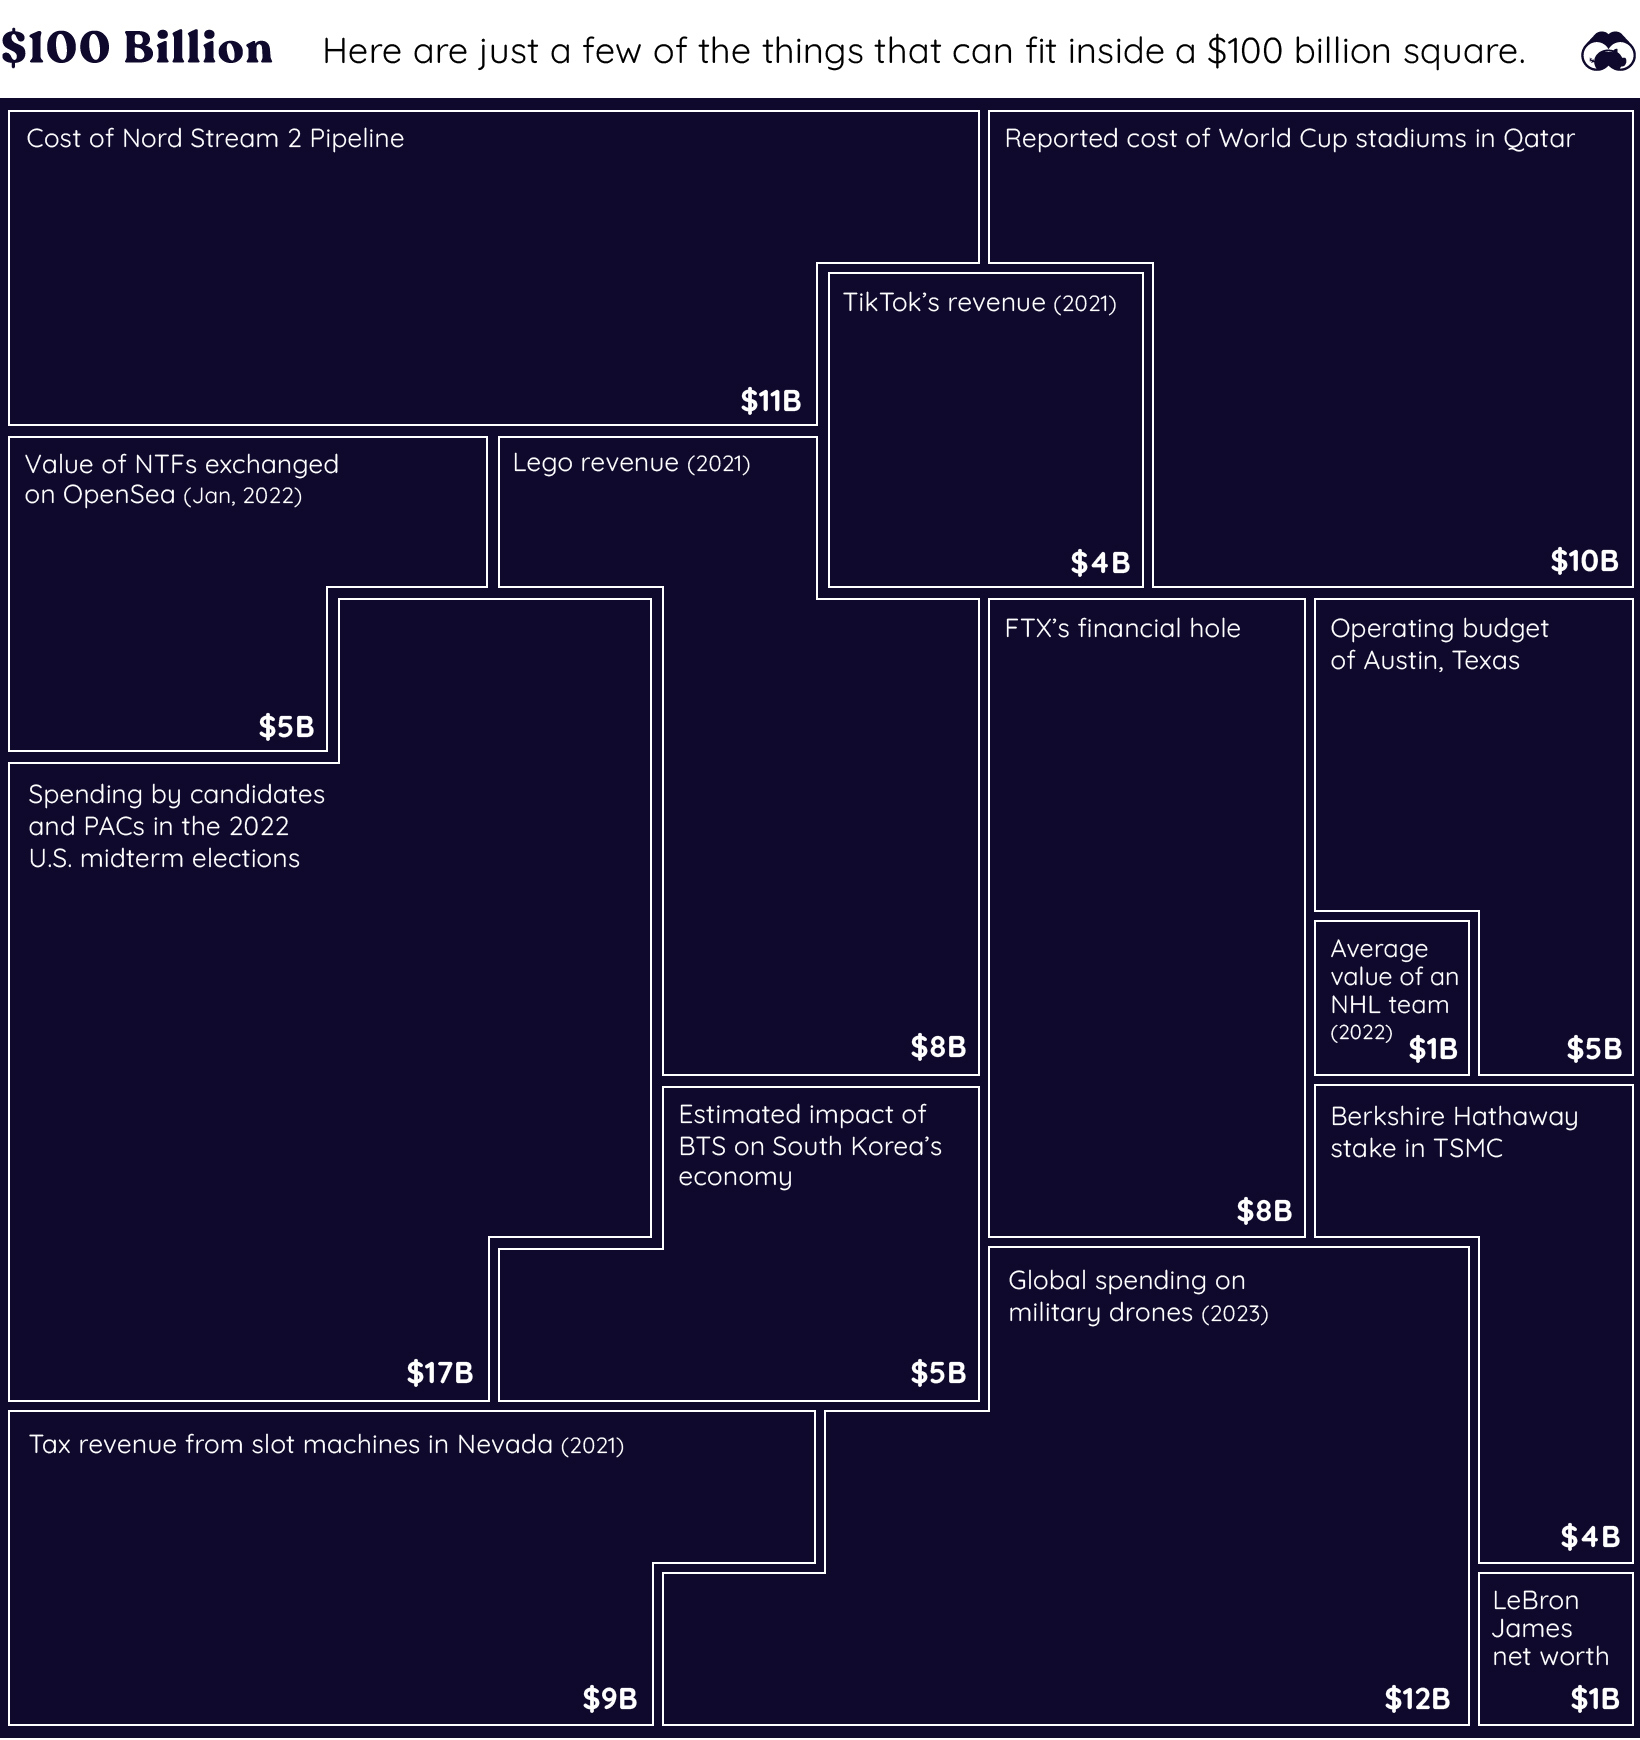
Our little unit of measurement is enough to pay for the construction of the Nord Stream 2 pipeline, while also buying every team in the NHL and digging FTX out of its financial hole several times over.
Here’s an overview of all the items we have listed in this year’s visualization:
| Asset category | Value | Source | Notes |
|---|---|---|---|
| SBF (Peak Net Worth) | $26 billion | Bloomberg | Now sits at <$1B |
| Pro Sports Teams | $340 billion | Forbes | Major pro teams in North America |
| Cryptocurrency | $760 billion | CoinMarketCap | Peaked at $2.8T in 2021 |
| Ukraine GDP | $130 billion | World Bank | Comparable to GDP of Mississippi |
| Russia GDP | $1.8 trillion | World Bank | The world's 11th largest economy |
| Annual Military Spending | $2.1 trillion | SIPRI | 2021 data |
| Physical currency | $8.0 trillion | BIS | 2020 data |
| Gold | $11.5 trillion | World Gold Council | There are 205,238 tonnes of gold in existence |
| Billionaires | $12.7 trillion | Forbes | Sum of fortunes of all 2,668 billionaires |
| Central Bank Assets | $28.0 trillion | Trading Economics | Fed, BoJ, Bank of China, and Eurozone only |
| S&P 500 | $36.0 trillion | Slickcharts | Nov 20, 2022 |
| China GDP | $17.7 trillion | World Bank | |
| U.S. GDP | $23.0 trillion | World Bank | |
| Narrow Money Supply | $49.0 trillion | Trading Economics | Includes US, China, Euro Area, Japan only |
| Broad Money Supply | $82.7 trillion | Trading Economics | Includes US, China, Euro Area, Japan only |
| Global Equities | $95.9 trillion | WFE | Latest available 2022 data |
| Global Debt | $300.1 trillion | IIF | Q2 2022 |
| Global Real Estate | $326.5 trillion | Savills | 2020 data |
| Global Private Wealth | $463.6 trillion | Credit Suisse | 2022 report |
| Derivatives (Market) | $12.4 trillion | BIS | |
| Derivatives (Notional) | $600 trillion | BIS |
Has the Dust Settled Yet?
Through previous editions of our All the World’s Money and Markets visualization, we’ve created snapshots of the world’s assets and markets at different points in time.
For example, in our 2017 edition of this visualization, Apple’s market capitalization was only $807 billion, and all crypto assets combined for $173 billion. The global debt total was at $215 trillion.
| Asset | 2017 edition | 2022 edition | Change (%) |
|---|---|---|---|
| Apple market cap | $807 billion | $2.3 trillion | +185% |
| Crypto | $173 billion | $760 billion | +339% |
| Fed Balance Sheet | $4.5 trillion | $8.7 trillion | +93% |
| Stock Markets | $73 trillion | $95.9 trillion | +31% |
| Global Debt | $215 trillion | $300 trillion | +40% |
And in just five years, Apple nearly quadrupled in size (it peaked at $3 trillion in January 2022), and crypto also expanded into a multi-trillion dollar market until it was brought back to Earth through the 2022 crash and subsequent FTX implosion.
Meanwhile, global debt continues to accumulate—growing by $85 trillion in the five-year period.
With interest rates expected to continue to rise, companies making cost cuts, and policymakers reining in spending and borrowing, today is another unique snapshot in time.
Now that the easy money era is over, where do things go from here?


Money
Animated: Change in Russian Billionaires’ Wealth Since 2022
How have Russian billionaires fared since Russia’s invasion of Ukraine? This animation tracks the wealth of 22 Russian billionaires.
 Creator Program
Animated: Change in Russian Billionaires’ Wealth Since 2022
When Russia invaded Ukraine in February 2022, many countries retaliated with sanctions targeting Russian billionaires—the oligarchs—and politicians directly.
And as the war has progressed, those sanctions have intensified, with even the relatives and shell companies of these billionaires being targeted over time. The reason? These oligarchs are interconnected to Russia’s government, lending vocal and fiscal support in exchange for sweetheart deals or beneficial government oversight.
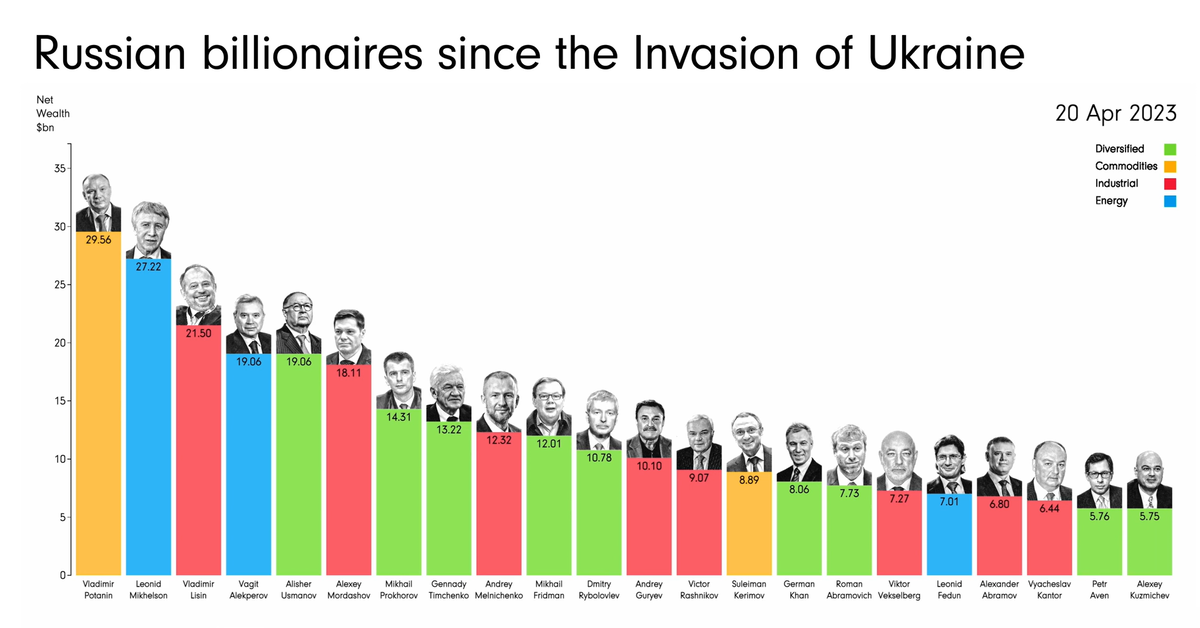
This animation from James Eagle shows how the estimated net wealth of the 22 wealthiest Russian billionaires on the Bloomberg Billionaires Index in April 2023 has changed since January 2022, prior to the start of the conflict.
Net Wealth of Top Russian Billionaires
The 22 wealthiest Russian billionaires in April 20, 2023 lost a collective $90.4 billion in net worth since January 5, 2022.
| Rank | Name | Main Industry | Net Wealth (Apr 20, 2023) | Net Wealth (Jan 5, 2022) | % Change |
|---|---|---|---|---|---|
| 1 | Vladimir Potanin | Commodities | $29.6B | $31.1B | -4.8% |
| 2 | Leonid Mikhelson | Energy | $27.2B | $33.2B | -18.1% |
| 3 | Vladimir Lisin | Industrial | $21.5B | $28.0B | -23.2% |
| 4 | Vagit Alekperov | Energy | $19.1B | $22.8B | -16.2% |
| 5 | Alisher Usmanov | Diversified | $19.1B | $21.2B | -9.9% |
| 6 | Alexey Mordashov | Industrial | $18.1B | $29.1B | -37.8% |
| 7 | Mikhail Prokhorov | Diversified | $14.3B | $14.0B | 2.1% |
| 8 | Gennady Timchenko | Diversified | $13.2B | $23.1B | -42.9% |
| 9 | Andrey Melnichenko | Industrial | $12.3B | $17.8B | -30.9% |
| 10 | Mikhail Fridman | Diversified | $12.0B | $14.1B | -14.9% |
| 11 | Dmitry Rybolovlev | Diversified | $10.8B | $11.2B | -3.6% |
| 12 | Andrey Guryev | Industrial | $10.1B | $8.0B | 26.3% |
| 13 | Victor Rashnikov | Industrial | $9.1B | $14.4B | -36.8% |
| 14 | Suleiman Kerimov | Commodities | $8.9B | $15.2B | -41.4% |
| 15 | German Khan | Diversified | $8.1B | $9.6B | -15.6% |
| 16 | Roman Abramovich | Diversified | $7.7B | $18.2B | -57.7% |
| 17 | Viktor Vekselberg | Industrial | $7.3B | $18.6B | -60.8% |
| 18 | Leonid Fedun | Energy | $7.0B | $8.9B | -21.3% |
| 19 | Alexander Abramov | Industrial | $6.8B | $9.1B | -25.3% |
| 20 | Vyacheslav Kantor | Industrial | $6.4B | $9.1B | -29.7% |
| 21 | Petr Aven | Diversified | $5.8B | $6.6B | -12.1% |
| 22 | Alexey Kuzmichev | Diversified | $5.8B | $7.3B | -20.5% |
The heaviest hit include Viktor Vekselberg, who holds a stake in UC Rusal, the world’s third largest aluminum producer. Since the start of the war, he’s lost an estimated $11.3 billion or 61% of his net worth from January 2022.
Roman Abramovich, who got his start in the early oligarchy through oil conglomerates, was also hit hard by the sanctions. He lost $10.5 billion or 58% of his net worth from January 2022, and was forced to sell Chelsea Football Club in one of the biggest sports team sales in history.
Notably, the richest oligarchs haven’t lost as much. Mining giant Norilsk Nickel’s largest shareholder, Vladimir Potanin, saw his net worth only drop by 4.8%. After being hit hard at the onset of the war in Ukraine, he quickly rebounded and at many times had an even higher net worth, reaching $35.6 billion in June 2022.
And a few oligarchs, like former Norilsk Nickel CEO Mikhail Prokhorov and phosphate-based fertilizer baron Andrey Guryev, saw their wealth increase since January 2022. Guryev grew his net worth by $2 billion or 26%, while Prokhorov (who formerly owned the NBA’s Brooklyn Nets) saw his net worth even out at a gain of $0.3 billion or 2%.
Oligarch Support of Russia (or Lack Thereof)
As Russia’s war with Ukraine has dragged on, and sanctions have continued to weigh on Russian billionaires, politicians, and companies, their effects have been uncertain.
Oligarchs have lost net worth, relinquished foreign businesses, and even had prized possessions like mansions and yachts seized. At the same time, though Russia’s economy has weakened under sanctions, bolstered trade with countries like China, India, and Saudi Arabia have kept it stronger than expected.
And though some oligarchs have voiced various concerns over the ongoing war, the wealthiest have been careful to toe the line. Russian billionaires and politicians that did vocalize criticism, including Lukoil chairman Ravil Maganov, have been found dead in apparent suicides, heart attacks, and accidents.
The most serious oligarch rebellion wasn’t due to economic hardships, but military operations. Oligarch and mercenary leader Yevgeny Prigozhin launched an attempted coup in June 2023, reportedly retreating after support from within Russia’s military quickly fizzled.
-

 Crime7 days ago
Mapped: The Safest Cities in the U.S.
-

 Markets2 weeks ago
Ranked: The Most Profitable U.S. Companies, by Sector
-

 Technology5 days ago
How Long it Took for Popular Apps to Reach 100 Million Users
-

 Markets4 weeks ago
The World’s Biggest Mutual Fund and ETF Providers
-

 Brands2 weeks ago
Brand Reputations: Ranking the Best and Worst in 2023
-

 Environment5 days ago
Hotter Than Ever: 2023 Sets New Global Temperature Records
-

 Datastream4 weeks ago
Can You Calculate Your Daily Carbon Footprint?
-

 Energy2 weeks ago
Who’s Still Buying Russian Fossil Fuels in 2023?