Markets
Charted: Tesla’s Unrivaled Profit Margins
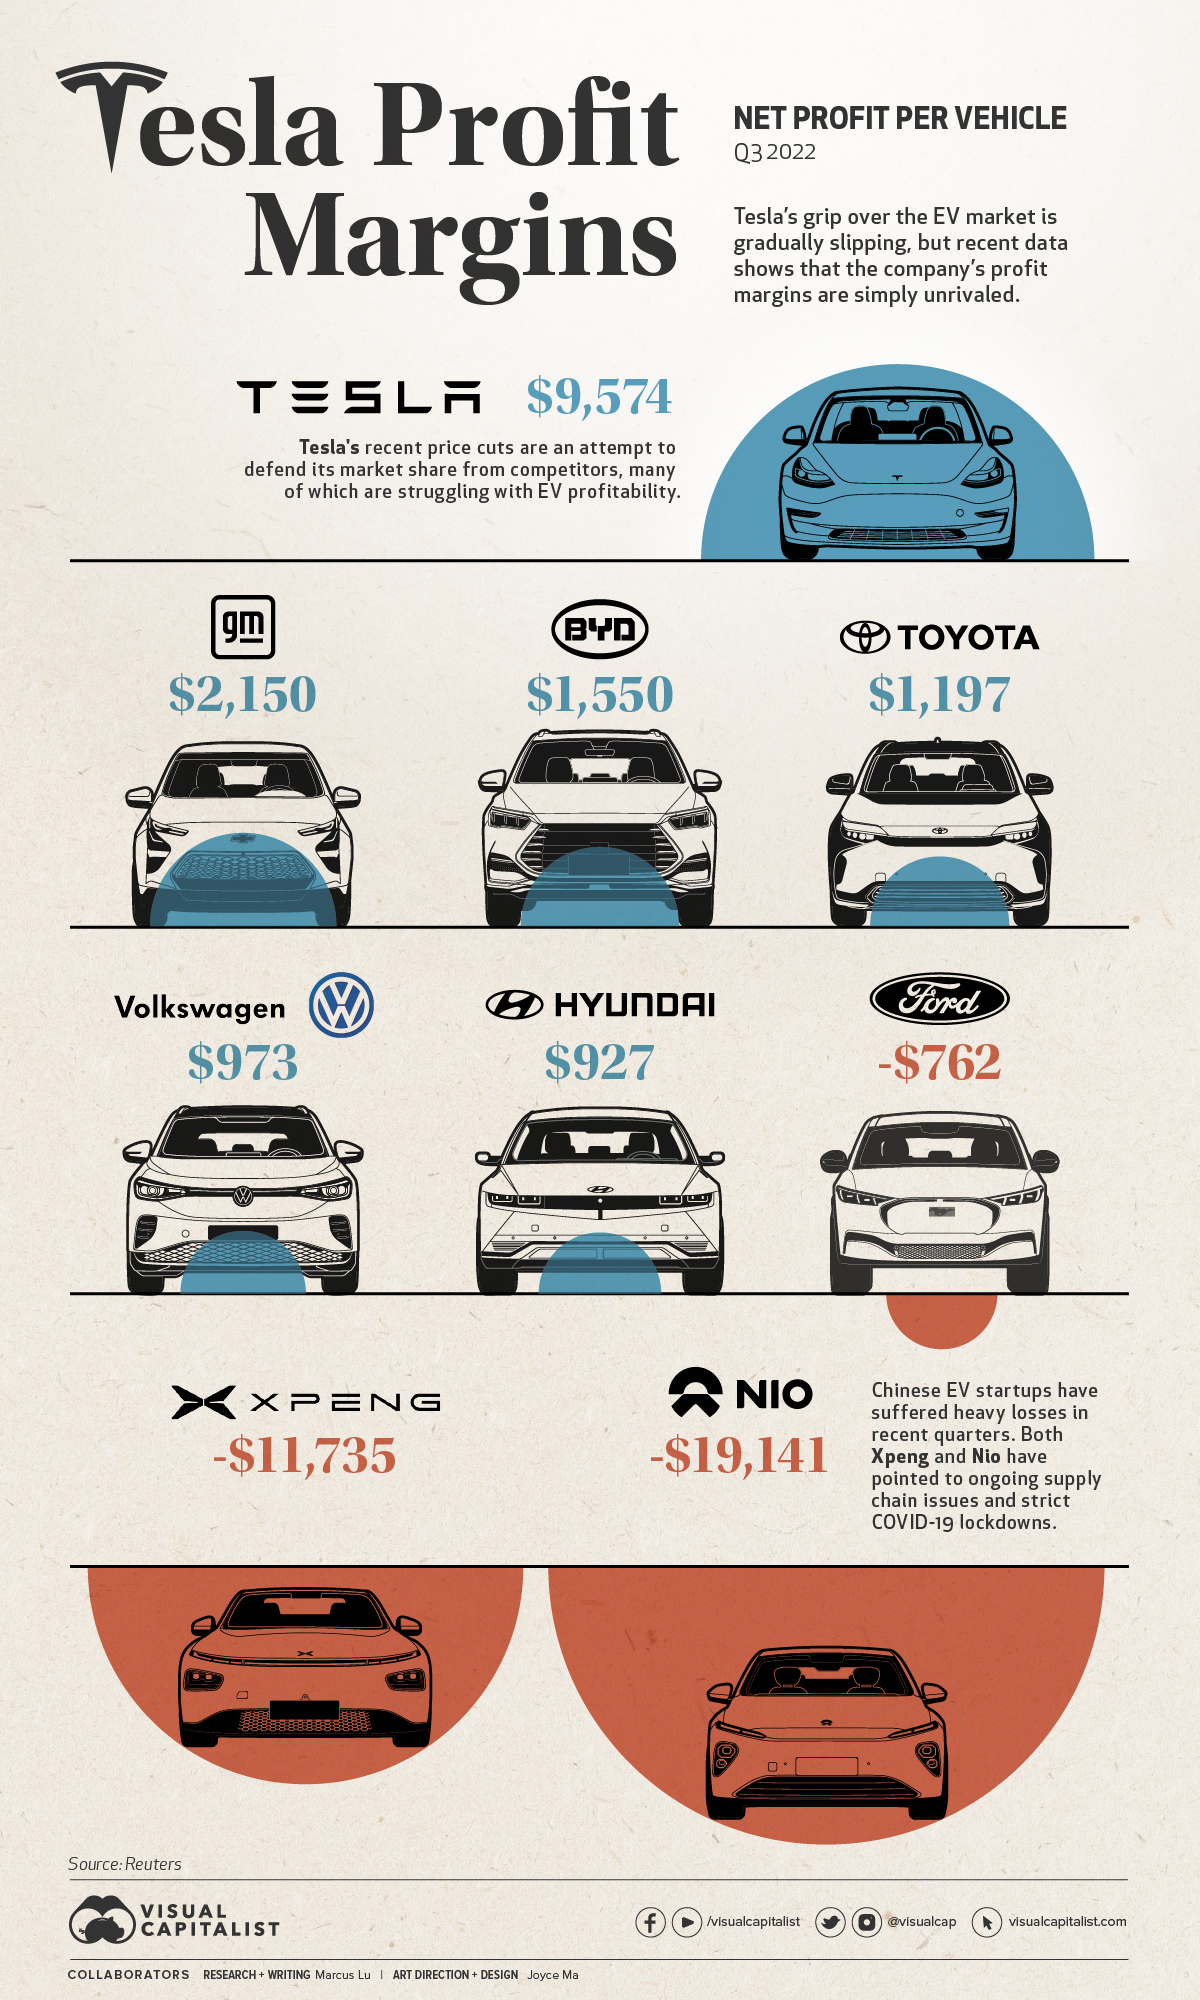


Chart: Tesla’s Unrivaled Profit Margins
In January this year, Tesla made the surprising announcement that it would be cutting prices on its vehicles by as much as 20%.
While price cuts are not new in the automotive world, they are for Tesla. The company, which historically has been unable to keep up with demand, has seen its order backlog shrink from 476,000 units in July 2022, to 74,000 in December 2022.
This has been attributed to Tesla’s robust production growth, which saw 2022 production increase 41% over 2021 (from 930,422 to 1,313,851 units).
With the days of “endless” demand seemingly over, Tesla is going on the offensive by reducing its prices—a move that puts pressure on competitors, but has also angered existing owners.
Cranking up the Heat
Tesla’s price cuts are an attempt to protect its market share, but they’re not exactly the desperation move some media outlets have claimed them to be.
Recent data compiled by Reuters shows that Tesla’s margins are significantly higher than those of its rivals, both in terms of gross and net profit. Our graphic only illustrates the net figures, but gross profits are also included in the table below.
| Company | Gross profit per car | Net profit per car |
|---|---|---|
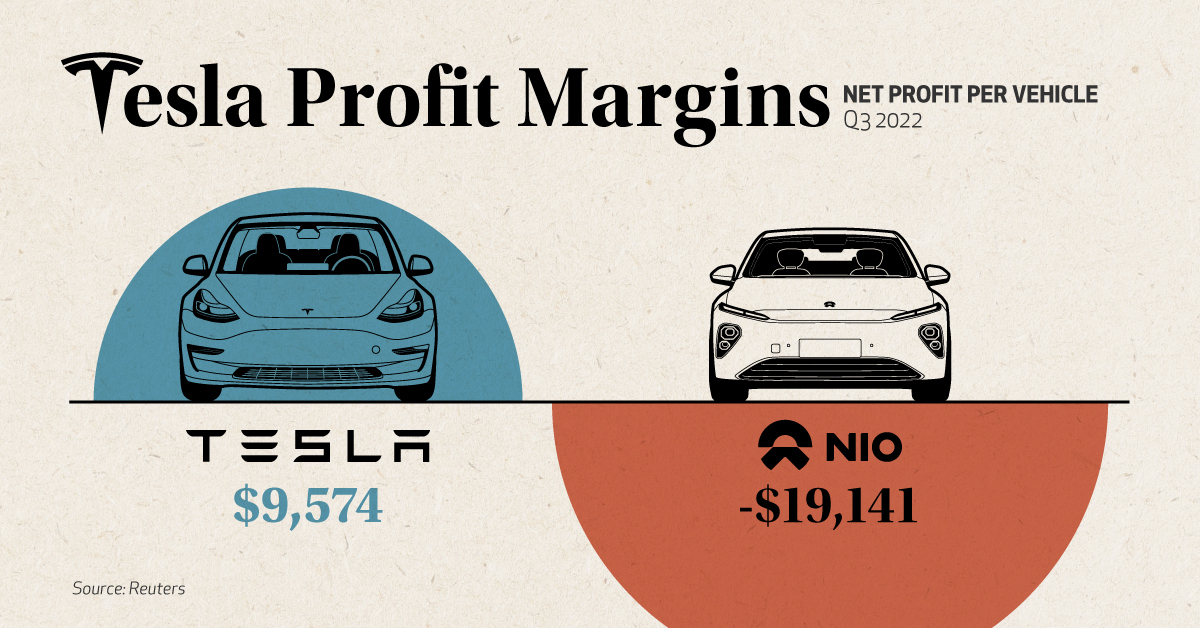
| 🇺🇸 Tesla | $15,653 | $9,574 |
| 🇺🇸 GM | $3,818 | $2,150 |
| 🇨🇳 BYD | $5,456 | $1,550 |
| 🇯🇵 Toyota | $3,925 | $1,197 |
| 🇩🇪 VW | $6,034 | $973 |
| 🇰🇷 Hyundai | $5,362 | $927 |
| 🇺🇸 Ford | $3,115 | -$762 |
| 🇨🇳 Xpeng | $4,565 | -$11,735 |
| 🇨🇳 Nio | $8,036 | -$19,141 |
Data from Q3 2022
Price cutting has its drawbacks, but one could argue that the benefits for Tesla are worth it based on this data—especially in a critical market like China.
Tesla has taken the nuclear option to bully the weaker, thin margin players off the table.
– Bill Russo, Automobility
In the case of Chinese EV startups Xpeng and Nio, net profits are non-existent, meaning it’s unlikely they’ll be able to match Tesla’s reductions in price. Both firms have reported year-on-year sales declines in January.
As for Tesla, Chinese media outlets have claimed that the firm received 30,000 orders within three days of its price cut announcement. Note that this hasn’t been officially confirmed by anyone within the company.
Tit for Tat
Ford made headlines recently for announcing its own price cuts on the Mustang Mach-E electric SUV. The model is a direct competitor to Tesla’s best-selling Model Y.
Chevrolet and Hyundai have also adjusted some of their EV prices in recent months, as listed in the following table.
| Model | Old Price | New Price | Discount |
|---|---|---|---|
| Tesla Model Y Long Range | $65,990 | $53,490 | 18.9% |
| Chevrolet Bolt EUV 2023 | $33,500 | $27,200 | 18.8% |
| Tesla Model Y Performance | $69,990 | $56,990 | 18.6% |
| Chevrolet Bolt 2023 | $31,600 | $26,500 | 16.1% |
| Tesla Model 3 Performance | $62,990 | $53,990 | 14.3% |
| Hyundai Kona Electric 2022 | $37,390 | $34,000 | 9.1% |
| Ford Mustang Mach-E GT Extended Range | $69,900 | $64,000 | 8.4% |
| Tesla Model 3 Long Range | $46,990 | $43,990 | 6.4% |
| Ford Mustang Mach-E Premium AWD | $57,675 | $53,995 | 6.4% |
| Ford Mustang Mach-E RWD Standard Range | $46,900 | $46,000 | 1.9% |
Source: Observer (Feb 2023)
Volkswagen is a noteworthy player missing from this table. The company has been gaining ground on Tesla, especially in the European market.
We have a clear pricing strategy and are focusing on reliability. We trust in the strength of our products and brands.
– Oliver Blume, CEO, VW Group
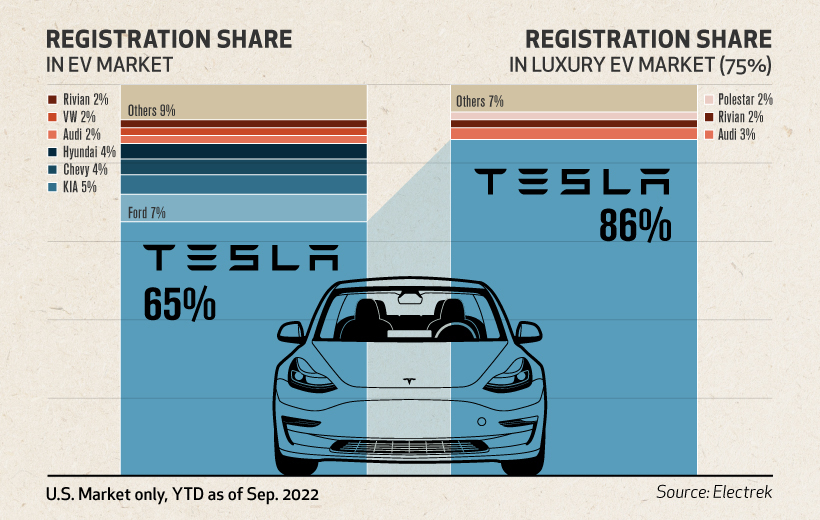
This decision could hamper Volkswagen’s goal of becoming a dominant player in EVs, especially if more automakers join Tesla in cutting prices. For now, Tesla still holds a strong grip on the US market.
Thanks, Elon
Recent Tesla buyers became outraged when the company announced it would be slashing prices on its cars. In China, buyers even staged protests at Tesla stores and delivery centers.
Recent buyers not only missed out on a better price, but their cars have effectively depreciated by the amount of the cut. This is a bitter turn of events, given Musk’s 2019 claims that a Tesla would be an appreciating asset.
I think the most profound thing is that if you buy a Tesla today, I believe you are buying an appreciating asset – not a depreciating asset.
– Elon Musk, CEO, Tesla
These comments were made in reference to Tesla’s full self-driving (FSD) capabilities, which Elon claimed would enable owners to turn their cars into robotaxis.


Stocks
The 50 Best One-Year Returns on the S&P 500 (1980-2022)
The highest one-year return among the top S&P 500 stocks from 1980 to 2022 was a staggering 2,620%. Which stocks top the ranks?

The Top S&P 500 Stocks by Annual Returns
The average annual return of the S&P 500 was 10% from 1980-2022, excluding dividends. Of course, there are some companies that deliver much higher returns in any given year.
In this graphic using data from S&P Dow Jones Indices, we explore the top S&P 500 stocks with the best single year returns over the last four decades.
Ranking the Top S&P 500 Stocks
In order to find the top gainers, S&P took the top 10 best-performing stocks each year and then narrowed that list down to the top 50 overall. They ranked the top S&P 500 stocks by price returns, meaning that no dividends or stock distributions were included.
The best gains were clustered in a few select years, including the 1999 dot-com boom, the 2003 stock market rally, and the 2009 recovery from the Global Financial Crisis. None of the biggest gains happened in 2021 or 2022.
| Rank | Company | Sector | Return | Year |
|---|---|---|---|---|
| 1 | Qualcomm | Information Technology | 2620% | 1999 |
| 2 | Tesla | Consumer Discretionary | 743% | 2020 |
| 3 | DSC Communications | Communication Services | 468% | 1992 |
| 4 | Coleco Industries | Consumer Discretionary | 435% | 1982 |
| 5 | Avaya | Information Technology | 428% | 2003 |
| 6 | Chrysler | Consumer Discretionary | 426% | 1982 |
| 7 | XL Capital (Axa XL) | Financials | 395% | 2009 |
| 8 | Tenet Healthcare | Healthcare | 369% | 2009 |
| 9 | Dynegy | Utilities | 361% | 2000 |
| 10 | Advanced Micro Devices | Information Technology | 348% | 2009 |
| 11 | Sprint | Communication Services | 343% | 1999 |
| 12 | Ford | Consumer Discretionary | 337% | 2009 |
| 13 | NEXTEL Communications | Communication Services | 336% | 1999 |
| 14 | LSI Logic | Information Technology | 319% | 1999 |
| 15 | NVIDIA | Information Technology | 308% | 2001 |
| 16 | Nortel Networks | Communication Services | 304% | 1999 |
| 17 | Etsy | Consumer Discretionary | 302% | 2020 |
| 18 | Genworth Financial | Financials | 301% | 2009 |
| 19 | Micron Technology | Information Technology | 300% | 2009 |
| 20 | NetFlix | Communication Services | 298% | 2013 |
| 21 | Oracle | Information Technology | 290% | 1999 |
| 22 | Western Digital | Information Technology | 286% | 2009 |
| 23 | Network Appliance (NetApp) | Information Technology | 270% | 1999 |
| 24 | Data General | Information Technology | 267% | 1991 |
| 25 | Yahoo | Communication Services | 265% | 1999 |
| 26 | Williams Companies | Energy | 264% | 2003 |
| 27 | Novell | Information Technology | 264% | 1991 |
| 28 | Dynegy | Utilities | 263% | 2003 |
| 29 | Sun Microsystems | Information Technology | 262% | 1999 |
| 30 | PMC-Sierra | Information Technology | 262% | 2003 |
| 31 | Advanced Micro Devices | Information Technology | 259% | 1991 |
| 32 | Dell | Information Technology | 248% | 1998 |
| 33 | Global Marine | Energy | 247% | 1980 |
| 34 | Micron Technology | Information Technology | 243% | 2013 |
| 35 | Best Buy | Consumer Discretionary | 237% | 2013 |
| 36 | Reebok | Consumer Discretionary | 234% | 2000 |
| 37 | Freeport-McMoRan | Materials | 229% | 2009 |
| 38 | Biomet (Zimmer Biomet) | Healthcare | 226% | 1991 |
| 39 | NVIDIA | Information Technology | 224% | 2016 |
| 40 | Gap | Consumer Discretionary | 223% | 1991 |
| 41 | NetFlix | Communication Services | 219% | 2010 |
| 42 | Fleetwood Enterprises (Fleetwood RV) | Consumer Discretionary | 217% | 1982 |
| 43 | National Semiconductor | Information Technology | 217% | 1999 |
| 44 | Dell | Information Technology | 216% | 1997 |
| 45 | Tandy Corp (RadioShack) | Information Technology | 216% | 1980 |
| 46 | Novell | Information Technology | 215% | 2003 |
| 47 | Corning | Information Technology | 215% | 2003 |
| 48 | CB Richard Ellis (CBRE) | Real Estate | 214% | 2009 |
| 49 | AES Corp | Utilities | 213% | 2003 |
| 50 | Expedia | Consumer Discretionary | 212% | 2009 |
Qualcomm was by far the top-performer in any one calendar year window. The company had key patents for Code Division Multiple Access (CDMA) technology, which enabled fast wireless internet access and became the basis for 3G networks.
Its stock took off in 1999 as it shed less profitable business lines, resolved a patent dispute with competitor Ericsson, and joined the S&P 500 Index. At the time, CNN reported that one lucky investor who heard about Qualcomm from an investment-banker-turned-rabbi earned $17 million—roughly $30 million in today’s dollars.
The most recent stocks to make the rankings were both from 2020: well-known Tesla (#2) and lesser-known online marketplace Etsy (#17), which saw sales from independent creators surge during the early COVID-19 pandemic. The dollar value of items sold on Etsy more than doubled from $5.3 billion in 2019 to $10.3 billion in 2020, with mask sales accounting for 7% of the total.
Biggest Gainers in Each Sector
While information technology stocks made up nearly half of the list, there is representation from nine of the 11 S&P 500 sectors. No companies from the Industrials or Consumer Staples sectors made it into the ranks of the top S&P 500 stocks by annual returns.
Below, we show the stock with the best annual return for each sector.

Tesla was the top-performing Consumer Discretionary stock on the list. After meeting the requirement of four consecutive quarters of positive earnings, it joined the S&P 500 Index on December 21, 2020. The company’s performance was boosted by the announcement that it would be included in the S&P 500, along with strong performance in China, and general EV buzz as environmental regulations tightened worldwide.
In the realm of Communication Services, DSC Communications saw a sizable return in 1992. The telecommunications equipment company had contracts with major companies such as Bell and Motorola. Alcatel-Lucent (then Alcatel), a French producer of mobile phones, purchased DSC Communications in 1998.
Serial Success Stories
It’s impressive to make the list of the top S&P 500 stocks by calendar returns once, but there are seven companies that have done it twice.
Some stocks saw their repeated outperformance close together, with Dell making the ranks back-to-back in 1997 and 1998.

On the other hand, a select few have more staying power. Computing giant NVIDIA topped the charts in 2001 and triumphed again 15 years later in 2016. And this year might be another win, as the company has recently reached a $1 trillion market capitalization and has the highest year-to-date return in the S&P 500 as of July 6, 2023.
-

 United States3 weeks ago
Visualized: The 100 Largest U.S. Banks by Consolidated Assets
-

 Automation1 week ago
Charted: Changing Sentiments Towards AI in the Workplace
-

 Markets3 weeks ago
What are Top Investment Managers Holding in Their Portfolios?
-

 Stocks1 week ago
The 50 Best One-Year Returns on the S&P 500 (1980-2022)
-

 Markets3 weeks ago
Chart: U.S. Home Price Growth Over 50 Years
-

 Cities1 week ago
Mapped: The Most Dangerous Cities in the U.S.
-

 Energy3 weeks ago
How Old Are the World’s Nuclear Reactors?
-

 Maps7 days ago
Mapped: World’s Top 40 Largest Military Budgets