

Opinions about using AI in the workplace have undergone a transformation from 2018, and so have the AI tools themselves.
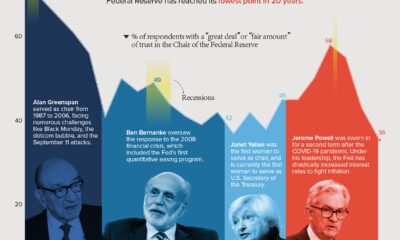

Public trust in the Federal Reserve chair has hit its lowest point in 20 years. Get the details in this infographic.
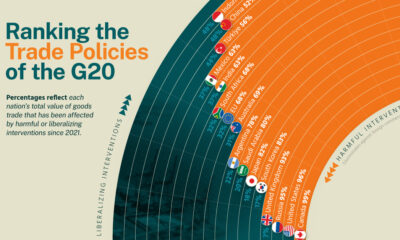

We analyze recent trade policies implemented by G20 members to determine whether they are liberalizing or harmful.


Reimagining all 200 million of the American workforce as 100 people: where do they all work, what positions they hold, and what jobs they do?


This infographic examines 50 years of data to highlight a clear visual trend: recessions are preceded by a cyclical low in unemployment.
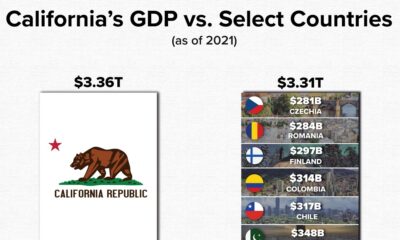

California’s GDP makes the state one of the most powerful economies in the world. This graphic compares it to the GDP of 10 select countries.


In this visual, we've ranked the top U.S. metropolitan areas in terms of their GDP. How does your city rank?
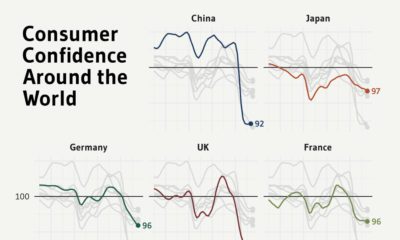

This graphic charts the rise and fall of consumer confidence across the world over the past three years.


After a dramatic spike during the pandemic, shipping costs have now fallen back to Earth. What does that mean for shippers and the economy?
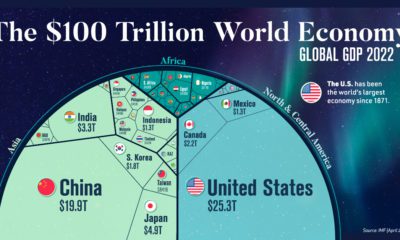

Despite ripple effects from conflict and inflation, global growth continues. According to the IMF, the global GDP will hit $104 trillion by end of year.


 Creator Program