Energy
Visualizing China’s Dominance in Battery Manufacturing (2022-2027P)
![]() Subscribe to the Elements free mailing list for more like this
Subscribe to the Elements free mailing list for more like this
Visualizing China’s Dominance in Battery Manufacturing
This was originally posted on Elements. Sign up to the free mailing list to get beautiful visualizations on natural resource megatrends in your email every week.
With the world gearing up for the electric vehicle era, battery manufacturing has become a priority for many nations, including the United States.
However, having entered the race for batteries early, China is far and away in the lead.
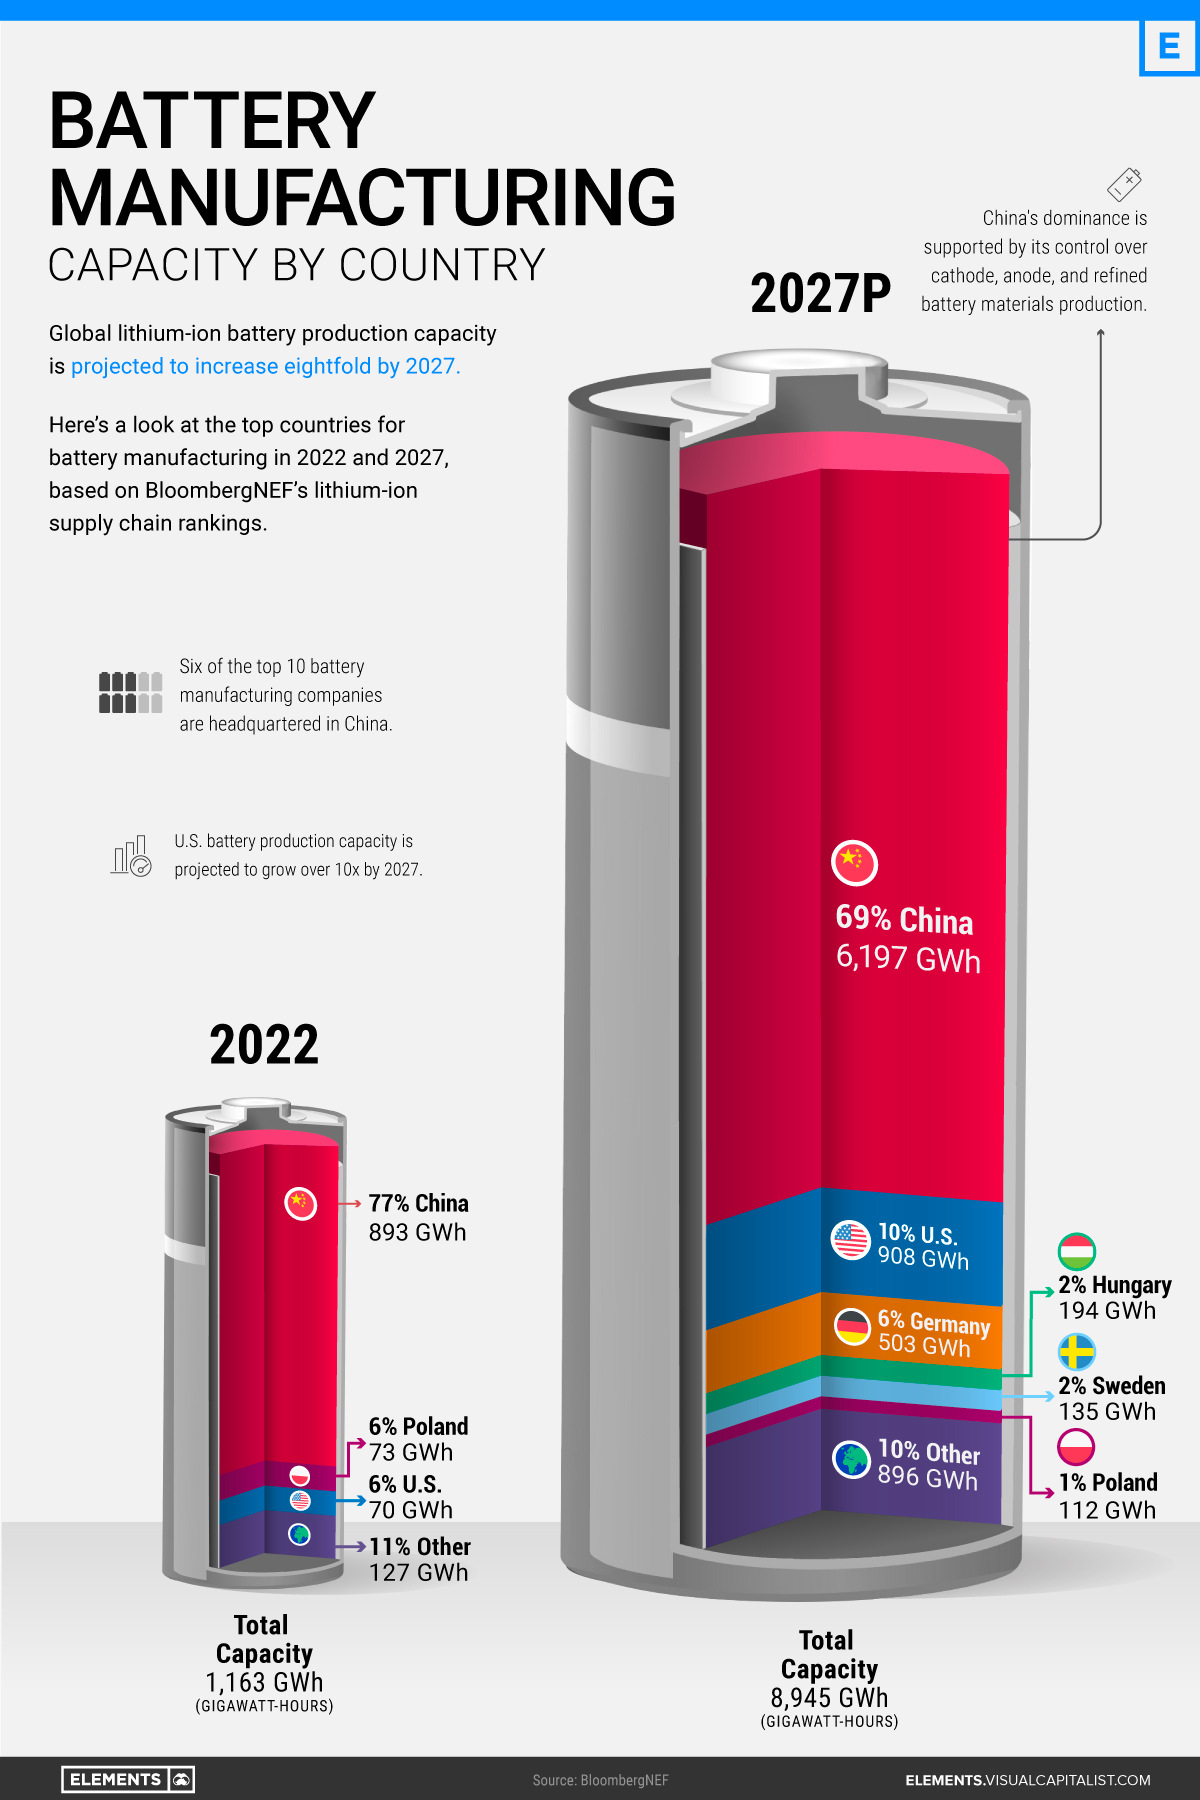
Using the data and projections behind BloombergNEF’s lithium-ion supply chain rankings, this infographic visualizes battery manufacturing capacity by country in 2022 and 2027p, highlighting the extent of China’s battery dominance.
Battery Manufacturing Capacity by Country in 2022
In 2022, China had more battery production capacity than the rest of the world combined.
| Rank | Country | 2022 Battery Cell Manufacturing Capacity, GWh | % of Total |
|---|---|---|---|
| #1 | 🇨🇳 China | 893 | 77% |
| #2 | 🇵🇱 Poland | 73 | 6% |
| #3 | 🇺🇸 U.S. | 70 | 6% |
| #4 | 🇭🇺 Hungary | 38 | 3% |
| #5 | 🇩🇪 Germany | 31 | 3% |
| #6 | 🇸🇪 Sweden | 16 | 1% |
| #7 | 🇰🇷 South Korea | 15 | 1% |
| #8 | 🇯🇵 Japan | 12 | 1% |
| #9 | 🇫🇷 France | 6 | 1% |
| #10 | 🇮🇳 India | 3 | 0.2% |
| 🌍 Other | 7 | 1% | |
| Total | 1,163 | 100% |
With nearly 900 gigawatt-hours of manufacturing capacity or 77% of the global total, China is home to six of the world’s 10 biggest battery makers. Behind China’s battery dominance is its vertical integration across the rest of the EV supply chain, from mining the metals to producing the EVs. It’s also the largest EV market, accounting for 52% of global sales in 2021.
Poland ranks second with less than one-tenth of China’s capacity. In addition, it hosts LG Energy Solution’s Wroclaw gigafactory, the largest of its kind in Europe and one of the largest in the world. Overall, European countries (including non-EU members) made up just 14% of global battery manufacturing capacity in 2022.
Although it lives in China’s shadow when it comes to batteries, the U.S. is also among the world’s lithium-ion powerhouses. As of 2022, it had eight major operational battery factories, concentrated in the Midwest and the South.
China’s Near-Monopoly Continues Through 2027
Global lithium-ion manufacturing capacity is projected to increase eightfold in the next five years. Here are the top 10 countries by projected battery production capacity in 2027:
| Rank | Country | 2027P Battery Cell Manufacturing Capacity, GWh | % of Total |
|---|---|---|---|
| #1 | 🇨🇳 China | 6,197 | 69% |
| #2 | 🇺🇸 U.S. | 908 | 10% |
| #3 | 🇩🇪 Germany | 503 | 6% |
| #4 | 🇭🇺 Hungary | 194 | 2% |
| #5 | 🇸🇪 Sweden | 135 | 2% |
| #6 | 🇵🇱 Poland | 112 | 1% |
| #7 | 🇨🇦 Canada | 106 | 1% |
| #8 | 🇪🇸 Spain | 98 | 1% |
| #9 | 🇫🇷 France | 89 | 1% |
| #10 | 🇲🇽 Mexico | 80 | 1% |
| 🌍 Other | 523 | 6% | |
| Total | 8,945 | 100% |
China’s well-established advantage is set to continue through 2027, with 69% of the world’s battery manufacturing capacity.
Meanwhile, the U.S. is projected to increase its capacity by more than 10-fold in the next five years. EV tax credits in the Inflation Reduction Act are likely to incentivize battery manufacturing by rewarding EVs made with domestic materials. Alongside Ford and General Motors, Asian companies including Toyota, SK Innovation, and LG Energy Solution have all announced investments in U.S. battery manufacturing in recent months.
Europe will host six of the projected top 10 countries for battery production in 2027. Europe’s current and future battery plants come from a mix of domestic and foreign firms, including Germany’s Volkswagen, China’s CATL, and South Korea’s SK Innovation.
Can Countries Cut Ties With China?
Regardless of the growth in North America and Europe, China’s dominance is unmatched.
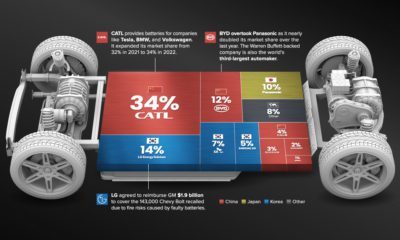
Battery manufacturing is just one piece of the puzzle, albeit a major one. Most of the parts and metals that make up a battery—like battery-grade lithium, electrolytes, separators, cathodes, and anodes—are primarily made in China.
Therefore, combating China’s dominance will be expensive. According to Bloomberg, the U.S. and Europe will have to invest $87 billion and $102 billion, respectively, to meet domestic battery demand with fully local supply chains by 2030.


Batteries
Visualized: The Rise of the LFP Battery
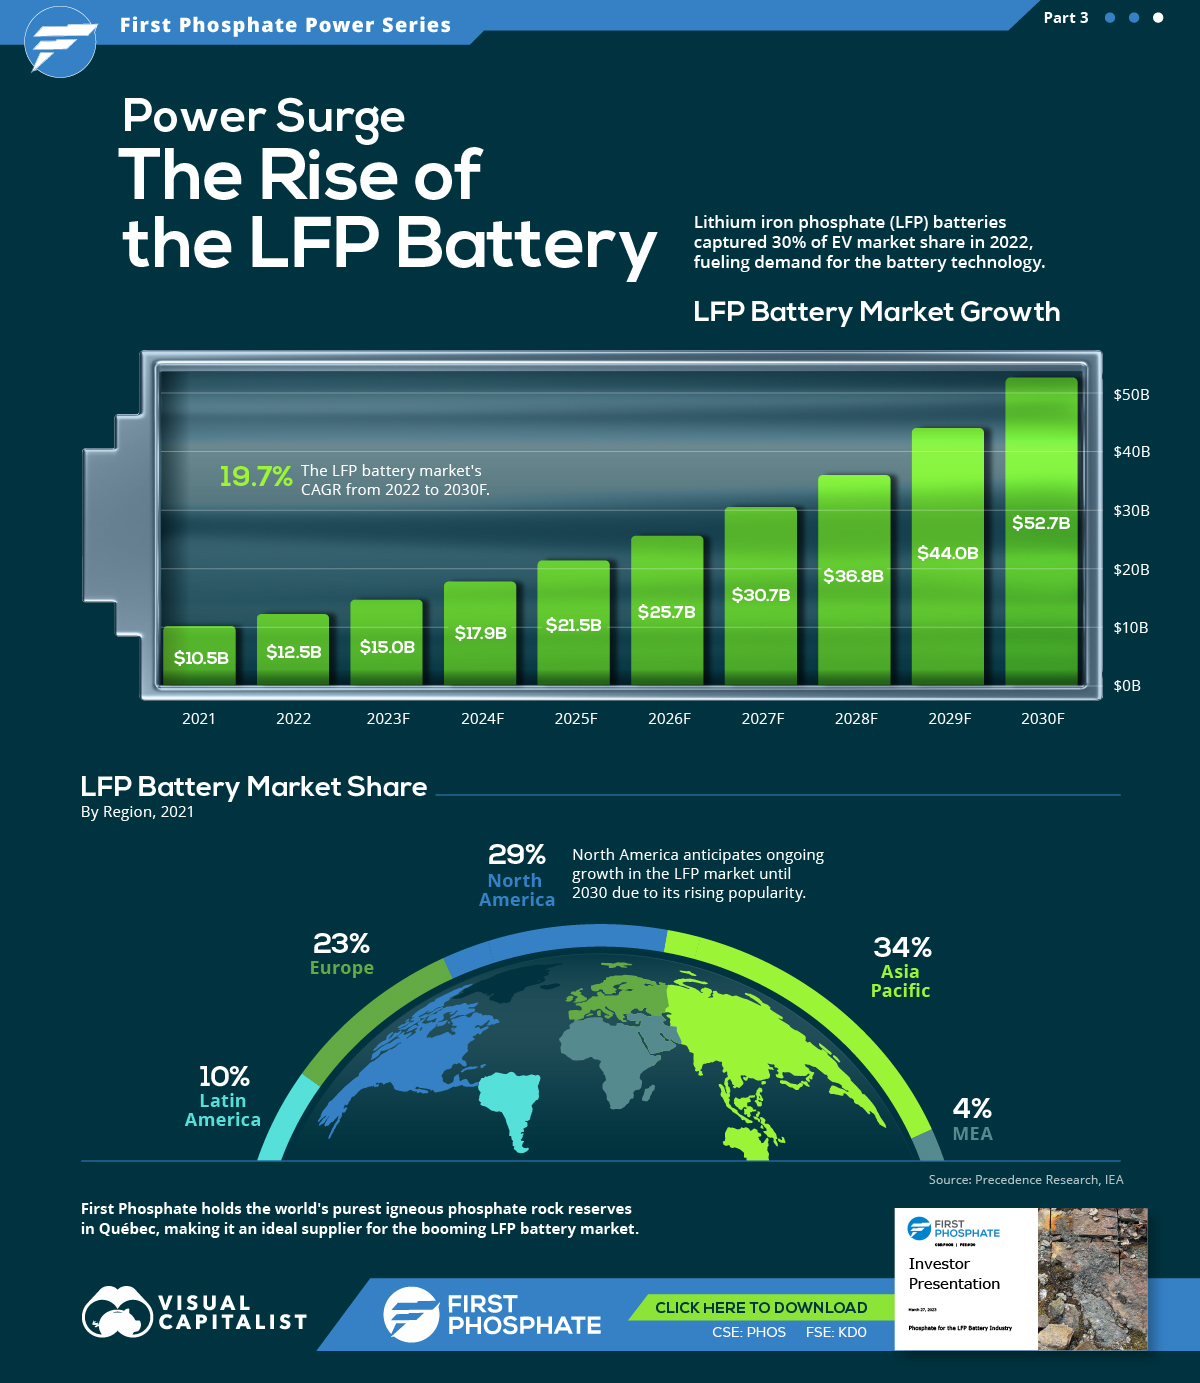
In 2022, the EV sector’s market share of the LFP battery rose from just 6% in 2020 to 30%, highlighting its growing popularity.


The Rise of the LFP Battery
Primarily a key component in fertilizers, phosphate is also essential to lithium iron phosphate (LFP) battery technology.
LFP is an emerging favorite in the expanding EV market, particularly in standard-range EVs. Factors driving this popularity include superior safety, longevity, cost-effectiveness, and environmental sustainability.
In this graphic, our sponsor First Phosphate looks at the growing LFP market, highlighting forecasted growth and current market share.
Market Growth
In 2022, the global LFP battery market stood at $12.5 billion. By 2030, this figure is expected to catapult to nearly $52.7 billion, signifying a CAGR of 19.7%.
| Year | USD (Billion) |
|---|---|
| 2021 | $10.5B |
| 2022 | $12.5B |
| 2023F | $15.0B |
| 2024F | $17.9B |
| 2025F | $21.5B |
| 2026F | $25.7B |
| 2027F | $30.7B |
| 2028F | $36.8B |
| 2029F | $44.0B |
| 2030F | $52.7B |
In 2022, LFP batteries cornered a sizable 30% of the EV market share from just 6% in 2020, demonstrating the growing appeal of this type of lithium-ion battery in the electric vehicle sector.
Market Share
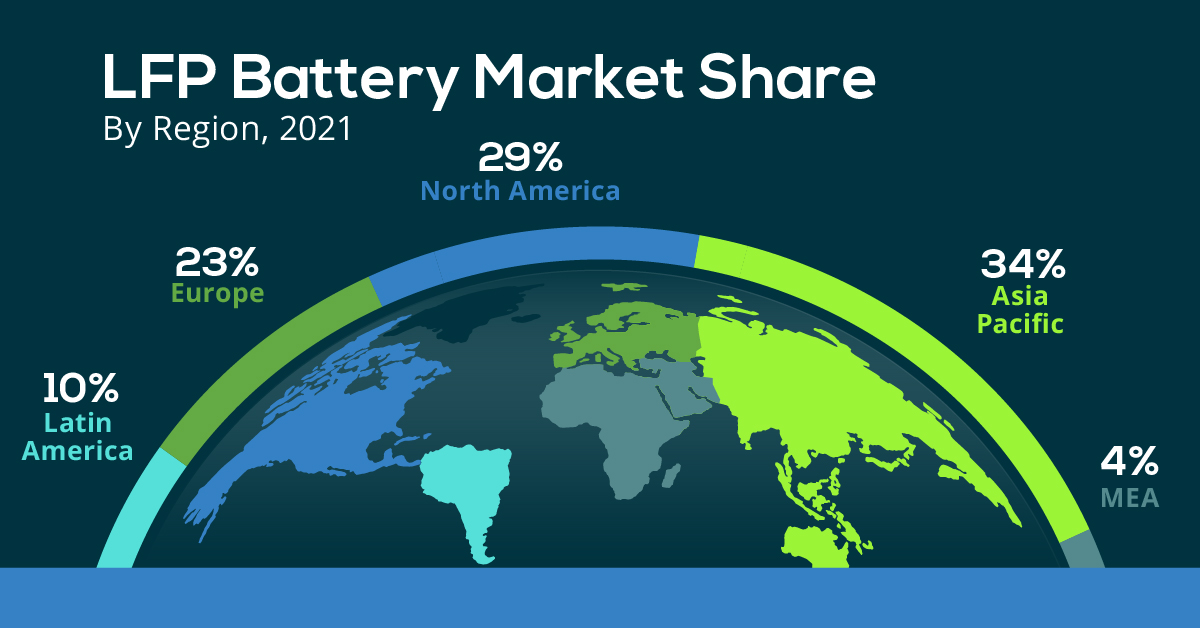
The Asia Pacific region dominated the LFP battery market in 2021, accounting for over 34% of the global share.
| Regions | Revenue Share (%) |
|---|---|
| Asia Pacific | 34% |
| North America | 29% |
| Europe | 23% |
| Latin America | 10% |
| MEA | 4% |
Meanwhile, North America, with the second largest share, is projected to witness ongoing growth through 2030.
First Phosphate holds access to 1% of the world’s purest igneous rock phosphate reserves in Québec, making it an ideal supplier for the growing LFP market.

-

 Maps2 months ago
Mapped: Renewable Energy and Battery Installations in the U.S. in 2023
This graphic describes new U.S. renewable energy installations by state along with nameplate capacity, planned to come online in 2023.
-

 Energy2 months ago
How EV Adoption Will Impact Oil Consumption (2015-2025P)
How much oil is saved by adding electric vehicles into the mix? We look at data from 2015 to 2025P for different types of EVs.
-
 Automotive3 months ago
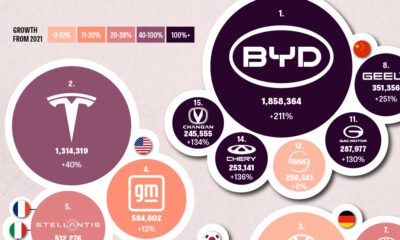
Global EV Production: BYD Surpasses Tesla
This graphic explores the latest EV production data for 2022, which shows BYD taking a massive step forward to surpass Tesla.
-

 Energy6 months ago
Visualizing China’s Dominance in Battery Manufacturing (2022-2027P)
This infographic breaks down battery manufacturing capacity by country in 2022 and 2027.
-

 Energy7 months ago
Visualizing 25 Years of Lithium Production, by Country
Lithium production has grown exponentially over the last few decades. Which countries produce the most lithium, and how how has this mix evolved?
-
 Energy10 months ago
The Top 10 EV Battery Manufacturers in 2022
Despite efforts from the U.S. and Europe to increase the domestic production of batteries, the market is still dominated by Asian suppliers.


-

 apps5 days ago
How Long it Took for Popular Apps to Reach 100 Million Users
-

 Datastream4 weeks ago
Can You Calculate Your Daily Carbon Footprint?
-

 Business2 weeks ago
Brand Reputations: Ranking the Best and Worst in 2023
-

 Green5 days ago
Hotter Than Ever: 2023 Sets New Global Temperature Records
-

 Investor Education4 weeks ago
Visualizing BlackRock’s Top Equity Holdings
-

 Energy2 weeks ago
Who’s Still Buying Russian Fossil Fuels in 2023?
-

 VC+4 days ago
What’s New on VC+ in July
-

 Datastream4 weeks ago
Charting the Rise of Cross-Border Money Transfers (2015-2023)