Energy
Mapped: Europe’s Biggest Sources of Electricity by Country
![]() Subscribe to the Elements free mailing list for more like this
Subscribe to the Elements free mailing list for more like this
Mapped: Europe’s Biggest Sources of Electricity by Country
This was originally posted on Elements. Sign up to the free mailing list to get beautiful visualizations on natural resource megatrends in your email every week.
Energy and electricity supply have become vital for nearly every European nation over the past year, as the region shifts away from its dependence on Russian fuel imports.
While many countries have been making progress in their energy transition away from fossil fuels, nearly half of European countries are still dependent on them as their primary source of electricity generation.
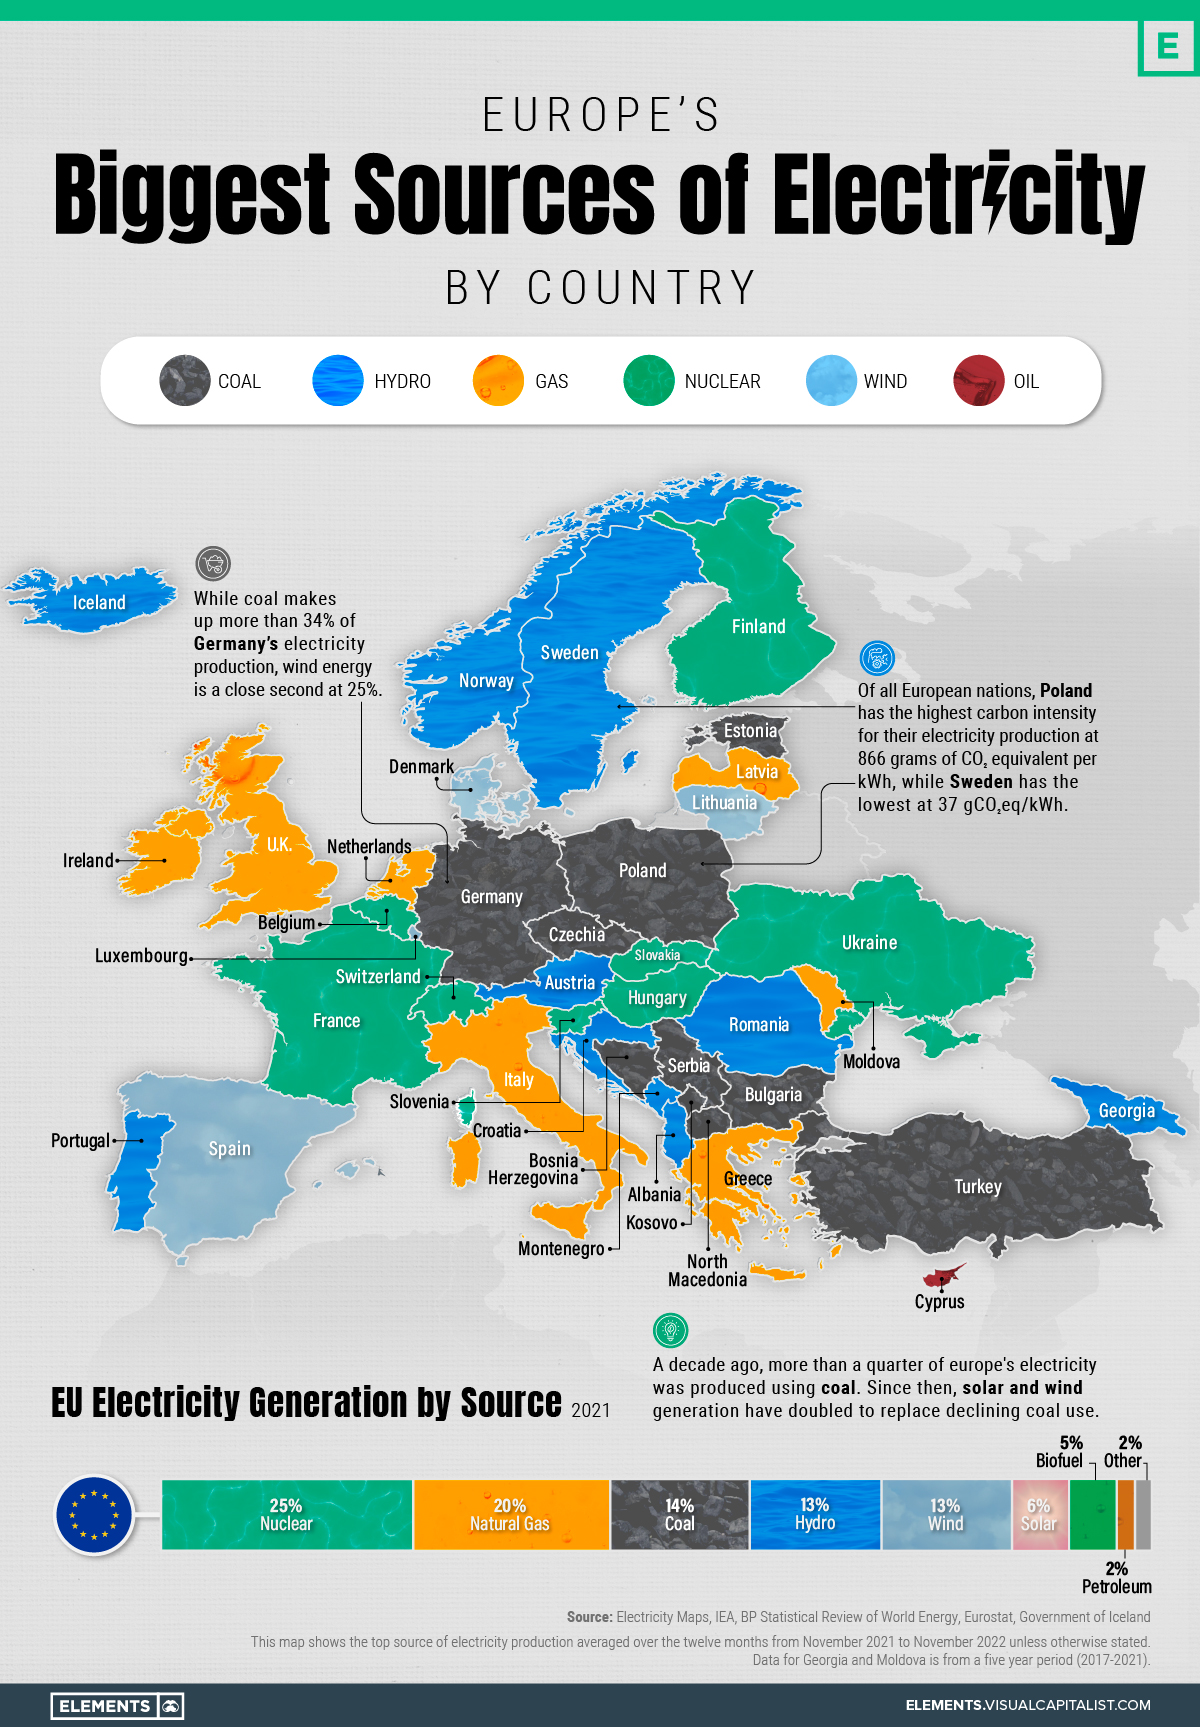
This graphic maps out European countries by their top source of electricity generation using data from Electricity Maps and the IEA, along with a breakdown of the EU’s overall electricity generation by source in 2021.
Europe’s Electricity Generation by Energy Source
Europe has been steadily transitioning towards renewable sources of energy for their electricity generation, making considerable progress over the last decade.
In 2011, fossil fuels (oil, natural gas, and coal) made up 49% of the EU’s electricity production while renewable energy sources only made up 18%. A decade later, renewable energy sources are coming close to equaling fossil fuels, with renewables making up 32% of the EU’s electricity generation compared to fossil fuels’ 36% in 2021.
| Source | EU Electricity Generation Share (2011) | EU Electricity Generation Share (2021) |
|---|---|---|
| Nuclear | 29% | 25% |
| Coal | 25% | 14% |
| Natural Gas | 19% | 20% |
| Hydropower | 10% | 13% |
| Wind | 6% | 13% |
| Oil | 5% | 2% |
| Solar | 2% | 6% |
| Biofuel | 4% | 5% |
| Other | n/a | 2% |
The expansion of wind and solar generation have been the primary drivers in this shift towards renewables, going from only generating 8% of the EU’s electricity in 2011 all the way to 19% in 2021. While this might still seem small, the EU’s share of wind and solar electricity generation is tied for first alongside Oceania when compared to other regions around the world.
While hydropower doesn’t make up as big of a share as other sources, it’s the most common primary source of electricity generation in Europe, playing an important role in providing renewable energy.
Nuclear energy is the largest single source of electricity generation in the EU and across Europe despite its decline over the past couple of decades. Back in 2001, nuclear energy made up one-third (33%) of the EU’s electricity generation, and in the following 20 years fell down to 25%.
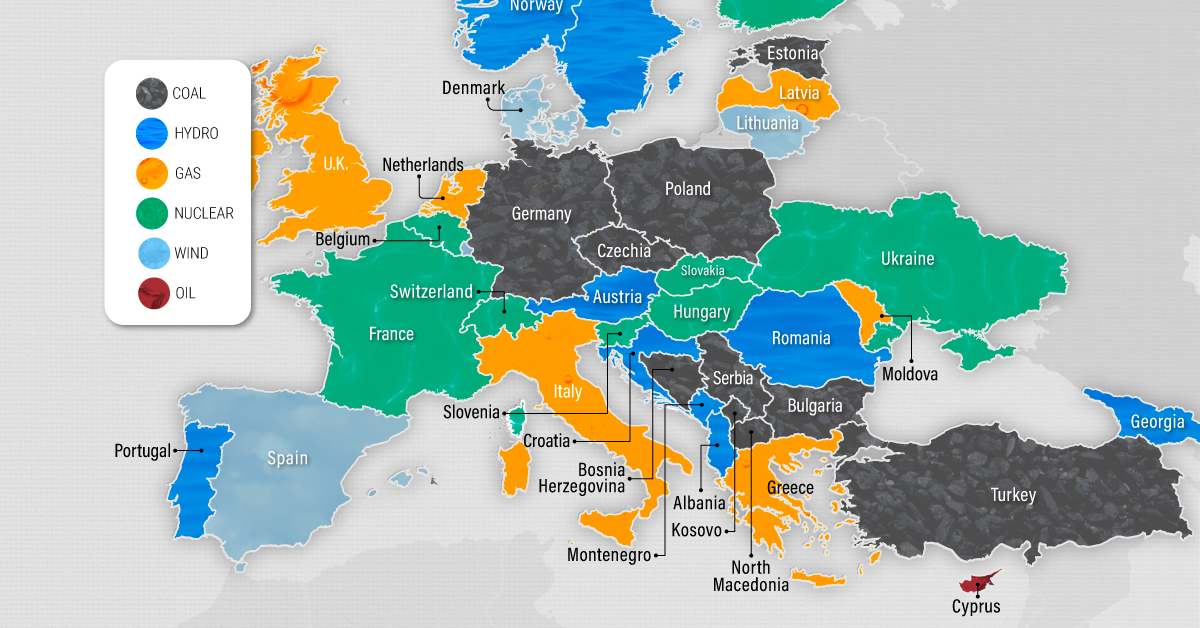
The Primary Electricity Sources of Europe’s Major Nations
When looking at individual nations, the majority of Europe’s largest countries have fossil fuels as their largest primary single source of electricity.
Germany remains heavily reliant on coal power, which from 2017 to 2021 generated 31% of the nation’s electricity. Despite the dependence on the carbon intensive fossil fuel, wind and solar energy generation together made up more of Germany’s electricity generation at 33% (23% for wind and 10% for solar).
France is Europe’s largest economy that primarily relies on nuclear power, with nuclear power making up more than half of the country’s electricity production.
Italy, the UK, and the Netherlands are all primarily natural gas powered when it comes to their electricity generation from 2017 to 2021. While Italy is the most reliant of the three at 42% of electricity generated by natural gas, the Netherlands (40%), and the UK (38%) aren’t too far off.
Spain is an outlier among major European nations and a success story in a transition towards renewable energy sources. While in the period from 2017-2021 the country was primarily dependent on natural gas (29%), in 2022 natural gas’ contribution to electricity generation fell to 14% as wind rose up to become the primary electricity generator with a 32% share.
Accelerating the EU’s Energy Transition
Since Russia’s invasion of Ukraine, energy independence in the EU has become of utmost importance, and countries have taken the opportunity to accelerate their transition towards renewable energy sources.
A new report from Ember highlights how the transition made considerable progress in 2022, with solar and wind power (22%) overtaking natural gas (20%) in electricity generation for the first time ever.
While 2022 did see an increase in fossil fuel electricity generation for the EU, Ember is expecting it to decline in 2023 by as much as 20%. If the EU can sustain this accelerated shift away from fossil fuels, this map of primary energy sources of electricity generation could feature many more renewable and low-carbon energy sources in the near future.


Batteries
Visualized: The Rise of the LFP Battery
In 2022, the EV sector’s market share of the LFP battery rose from just 6% in 2020 to 30%, highlighting its growing popularity.


The Rise of the LFP Battery
Primarily a key component in fertilizers, phosphate is also essential to lithium iron phosphate (LFP) battery technology.
LFP is an emerging favorite in the expanding EV market, particularly in standard-range EVs. Factors driving this popularity include superior safety, longevity, cost-effectiveness, and environmental sustainability.
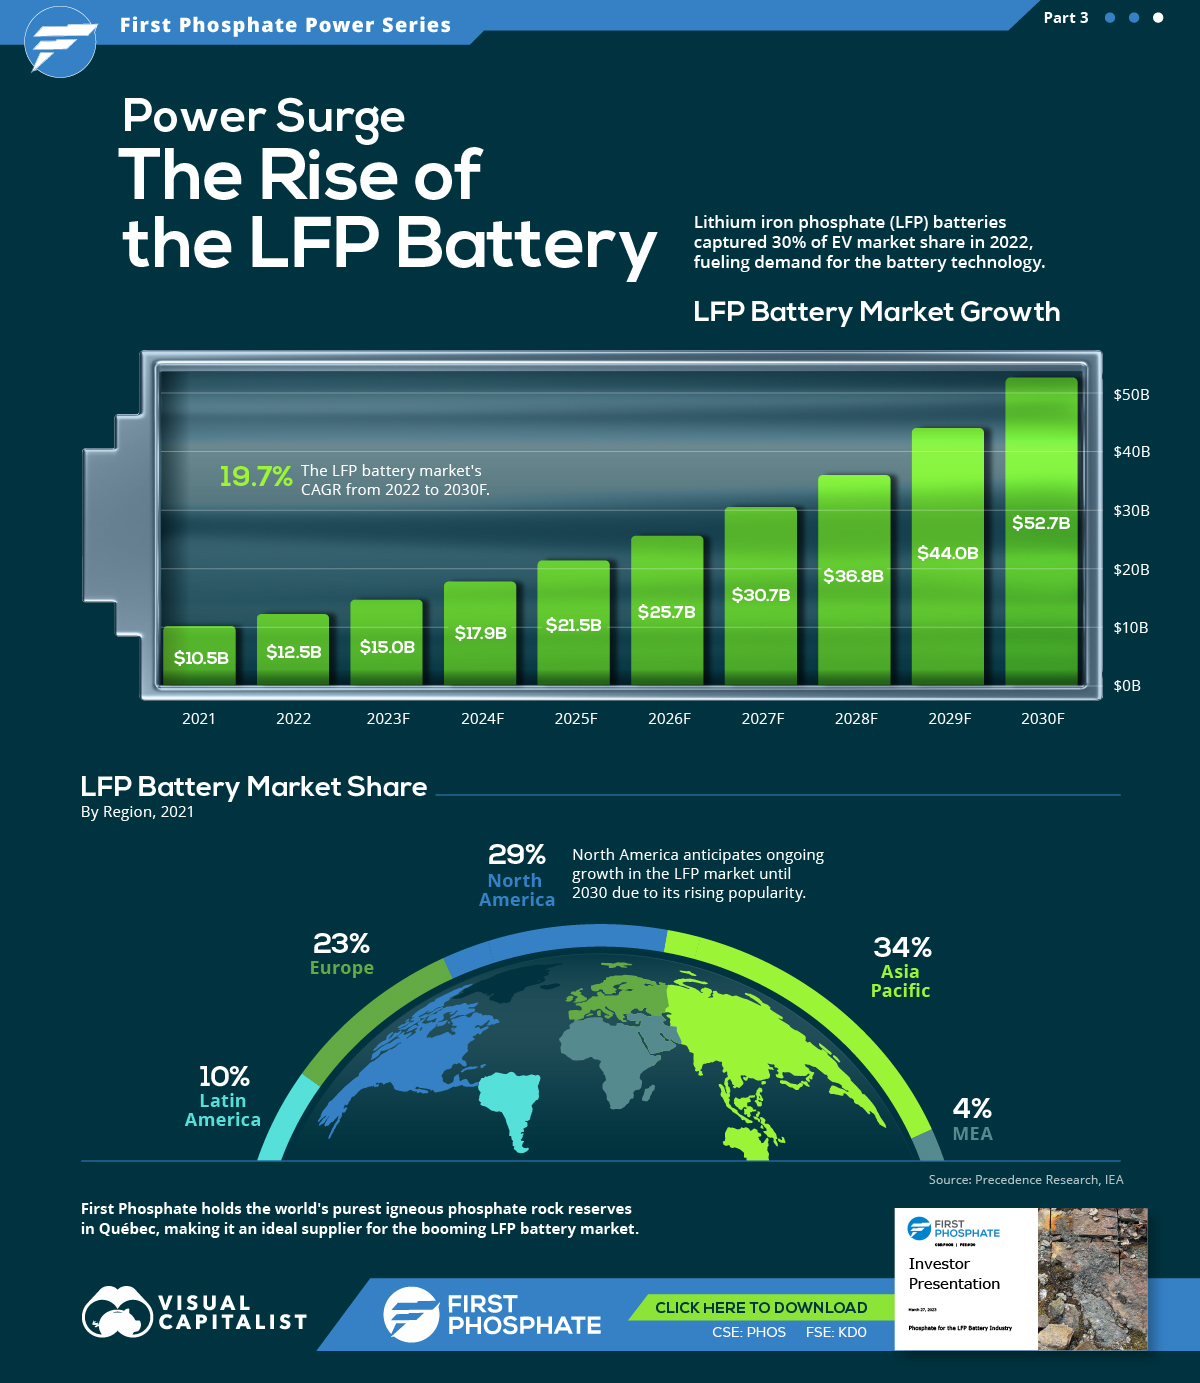
In this graphic, our sponsor First Phosphate looks at the growing LFP market, highlighting forecasted growth and current market share.
Market Growth
In 2022, the global LFP battery market stood at $12.5 billion. By 2030, this figure is expected to catapult to nearly $52.7 billion, signifying a CAGR of 19.7%.
| Year | USD (Billion) |
|---|---|
| 2021 | $10.5B |
| 2022 | $12.5B |
| 2023F | $15.0B |
| 2024F | $17.9B |
| 2025F | $21.5B |
| 2026F | $25.7B |
| 2027F | $30.7B |
| 2028F | $36.8B |
| 2029F | $44.0B |
| 2030F | $52.7B |
In 2022, LFP batteries cornered a sizable 30% of the EV market share from just 6% in 2020, demonstrating the growing appeal of this type of lithium-ion battery in the electric vehicle sector.
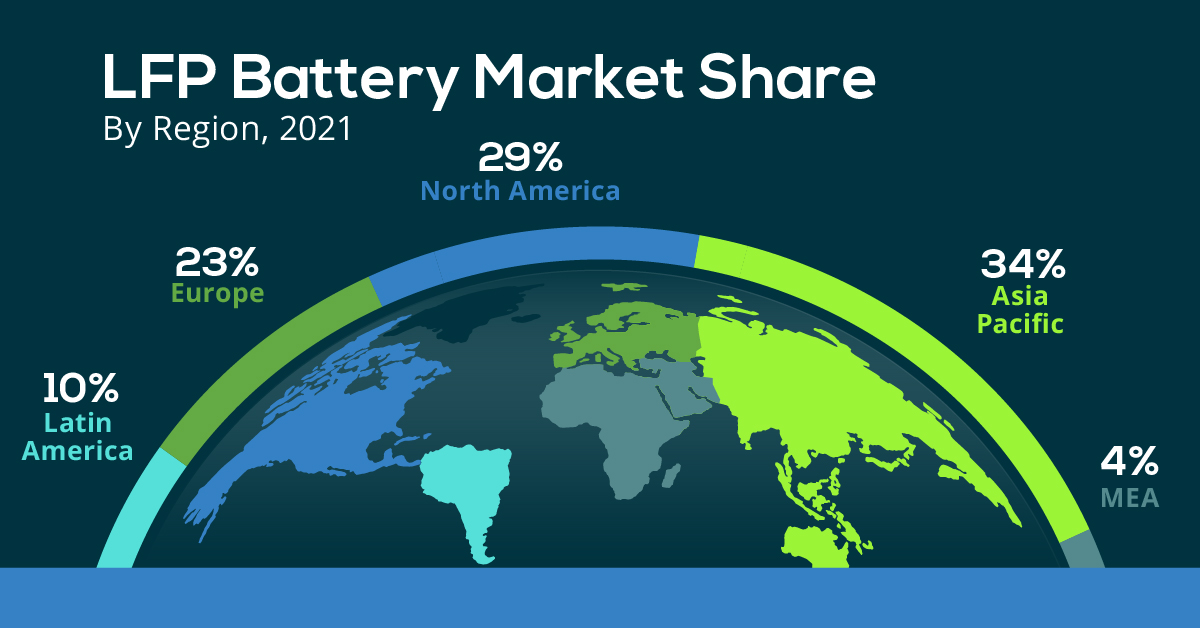
Market Share
The Asia Pacific region dominated the LFP battery market in 2021, accounting for over 34% of the global share.
| Regions | Revenue Share (%) |
|---|---|
| Asia Pacific | 34% |
| North America | 29% |
| Europe | 23% |
| Latin America | 10% |
| MEA | 4% |
Meanwhile, North America, with the second largest share, is projected to witness ongoing growth through 2030.
First Phosphate holds access to 1% of the world’s purest igneous rock phosphate reserves in Québec, making it an ideal supplier for the growing LFP market.

-

 Batteries2 months ago
Mapped: Renewable Energy and Battery Installations in the U.S. in 2023
This graphic describes new U.S. renewable energy installations by state along with nameplate capacity, planned to come online in 2023.
-

 Batteries2 months ago
How EV Adoption Will Impact Oil Consumption (2015-2025P)
How much oil is saved by adding electric vehicles into the mix? We look at data from 2015 to 2025P for different types of EVs.
-
 Automotive3 months ago
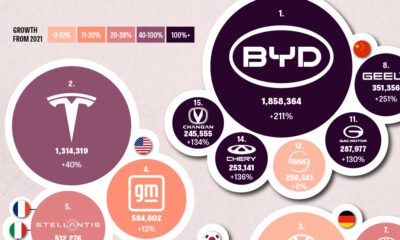
Global EV Production: BYD Surpasses Tesla
This graphic explores the latest EV production data for 2022, which shows BYD taking a massive step forward to surpass Tesla.
-

 Batteries6 months ago
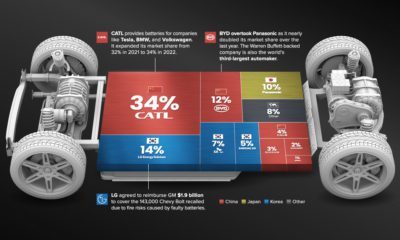
Visualizing China’s Dominance in Battery Manufacturing (2022-2027P)
This infographic breaks down battery manufacturing capacity by country in 2022 and 2027.
-

 Batteries7 months ago
Visualizing 25 Years of Lithium Production, by Country
Lithium production has grown exponentially over the last few decades. Which countries produce the most lithium, and how how has this mix evolved?
-
 Energy10 months ago
The Top 10 EV Battery Manufacturers in 2022
Despite efforts from the U.S. and Europe to increase the domestic production of batteries, the market is still dominated by Asian suppliers.


-

 Energy2 weeks ago
Who’s Still Buying Russian Fossil Fuels in 2023?
-

 VC+4 days ago
What’s New on VC+ in July
-

 Investor Education4 weeks ago
Visualizing BlackRock’s Top Equity Holdings
-

 apps2 weeks ago
Meet the Competing Apps Battling for Twitter’s Market Share
-

 Politics14 hours ago
How Do Chinese Citizens Feel About Other Countries?
-

 Markets4 weeks ago
Visualizing Every Company on the S&P 500 Index
-

 Markets2 weeks ago
Visualizing 1 Billion Square Feet of Empty Office Space
-

 Energy4 weeks ago
Life Cycle Emissions: EVs vs. Combustion Engine Vehicles