Energy
Which Countries are Buying Russian Fossil Fuels?
![]() Subscribe to the Elements free mailing list for more like this
Subscribe to the Elements free mailing list for more like this
The Countries Buying Russian Fossil Fuels Since the Invasion
This was originally posted on Elements. Sign up to the free mailing list to get beautiful visualizations on natural resource megatrends in your email every week.
A year on from Russia’s initial invasion of Ukraine, Russian fossil fuel exports are still flowing to various nations around the world.
According to estimates from the Centre for Research on Energy and Clean Air (CREA), since the invasion started about a year ago, Russia has made more than $315 billion in revenue from fossil fuel exports around the world, with nearly half ($149 billion) coming from EU nations.
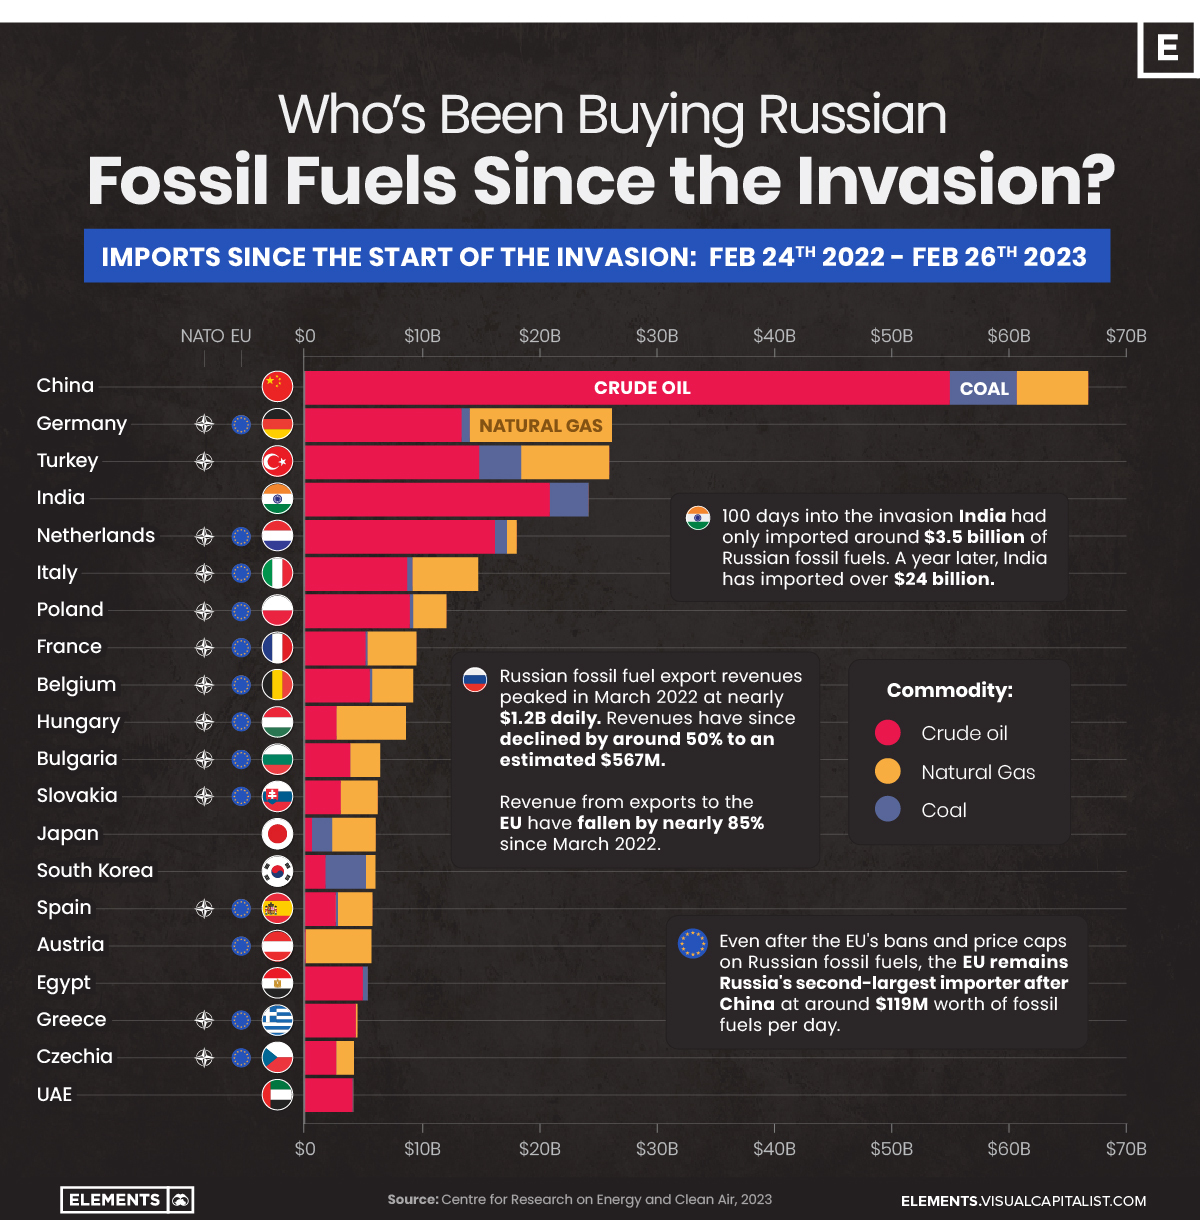
This graphic uses data from the CREA to visualize the countries that have bought the most Russian fossil fuels since the invasion, showcasing the billions in revenue Russia has made from these exports.
Top Importers of Russian Fossil Fuels
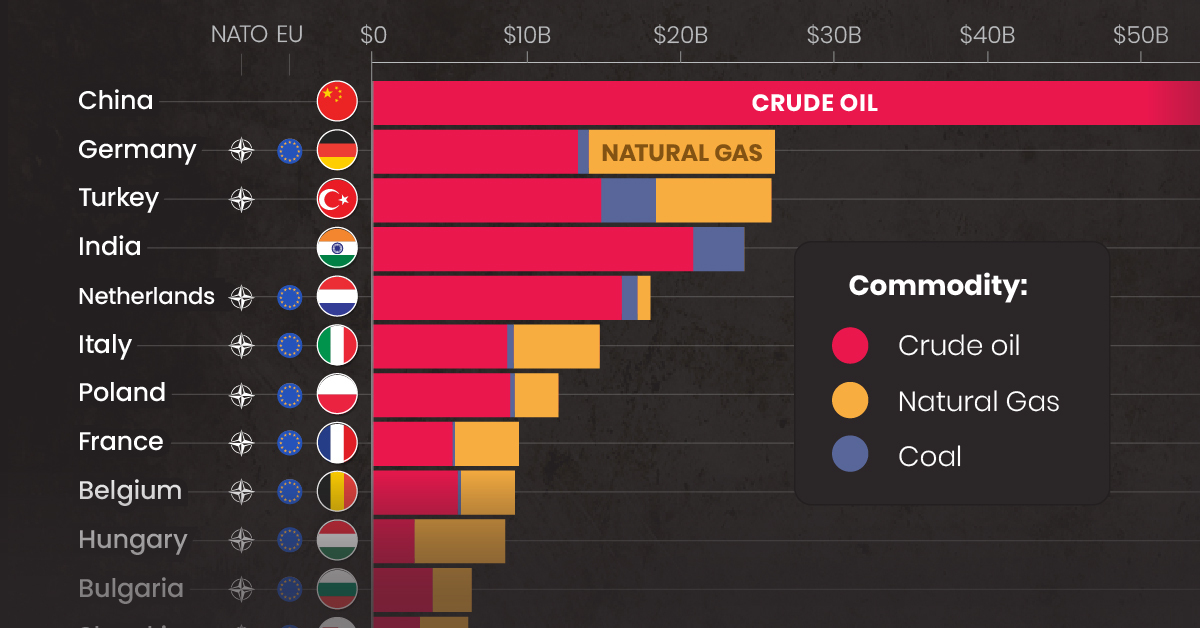
As one might expect, China has been the top buyer of Russian fossil fuels since the start of the invasion. Russia’s neighbor and informal ally has primarily imported crude oil, which has made up more than 80% of its imports totaling more than $55 billion since the start of the invasion.
The EU’s largest economy, Germany, is the second-largest importer of Russian fossil fuels, largely due to its natural gas imports worth more than $12 billion alone.
| Country | Total Value of Russian Fossil Fuel Imports* | Crude Oil | Natural Gas | Coal |
|---|---|---|---|---|
| 🇨🇳 China | $66.6B | $54.9B | $6.1B | $5.7B |
| 🇩🇪 Germany | $26.1B | $13.3B | $12.1B | $0.7B |
| 🇹🇷 Turkey | $25.9B | $14.8B | $7.5B | $3.6B |
| 🇮🇳 India | $24.1B | $20.8B | $0 | $3.3B |
| 🇳🇱 Netherlands | $18.0B | $16.2B | $0.8B | $1.0B |
| 🇮🇹 Italy | $14.8B | $8.7B | $5.6B | $0.4B |
| 🇵🇱 Poland | $12.1B | $8.9B | $2.9B | $0.3B |
| 🇫🇷 France | $9.5B | $5.2B | $4.2B | $0.2B |
| 🇧🇪 Belgium | $9.2B | $5.5B | $3.5B | $0.2B |
| 🇭🇺 Hungary | $8.6B | $2.7B | $5.9B | $0 |
| 🇧🇬 Bulgaria | $6.4B | $3.9B | $2.5B | $0 |
| 🇸🇰 Slovakia | $6.2B | $3.1B | $3.1B | $0 |
| 🇯🇵 Japan | $6.0B | $0.6B | $3.7B | $1.7B |
| 🇰🇷 South Korea | $6.0B | $1.8B | $0.8B | $3.5B |
| 🇪🇸 Spain | $5.8B | $2.7B | $2.9B | $0.2B |
| 🇦🇹 Austria | $5.7B | $0.1B | $5.6B | $0 |
| 🇪🇬 Egypt | $5.4B | $4.9B | $0 | $0.4B |
| 🇬🇷 Greece | $4.5B | $4.3B | $0.2B | $0 |
| 🇨🇿 Czechia | $4.2B | $2.7B | $1.5B | $0 |
| 🇦🇪 UAE | $4.1B | $4.1B | $0 | $0.1B |
*Over the time period of Feb 24, 2022 to Feb 26, 2023 in U.S. dollars
Turkey, a member of NATO but not of the EU, closely follows Germany as the third-largest importer of Russian fossil fuels since the invasion. The country is likely to overtake Germany soon, as not being part of the EU means it isn’t affected by the bloc’s Russian import bans put in place over the last year.
Although more than half of the top 20 fossil fuel importing nations are from the EU, nations from the bloc and the rest of Europe have been curtailing their imports as bans and price caps on Russian coal imports, crude oil seaborne shipments, and petroleum product imports have come into effect.
Russia’s Declining Fossil Fuel Revenues
The EU’s bans and price caps have resulted in a decline of daily fossil fuel revenues from the bloc of nearly 85%, falling from their March 2022 peak of $774 million per day to $119 million as of February 22nd, 2023.
Although India has stepped up its fossil fuel imports in the meantime, from $3 million daily on the day of the invasion to $81 million per day as of February 22nd of this year, this increase doesn’t come close to making up the $655 million hole left by EU nations’ reduction in imports.
Similarly, even if African nations have doubled their Russian fuel imports since December of last year, Russian seaborne oil product exports have still declined by 21% overall since January according to S&P Global.
Other Factors Impacting Revenues
Overall, from their peak on March 24th of around $1.17 billion in daily revenue, Russian fossil fuel revenues have declined by more than 50% to just $560 million daily.
Along with the EU’s reductions in purchases, a key contributing factor has been the decline in Russian crude oil’s price, which has also declined by nearly 50% since the invasion, from $99 a barrel to $50 a barrel today.
Whether these declines will continue is yet to be determined. That said, the EU’s 10th set of sanctions, announced on February 25th, ban the import of bitumen, related materials like asphalt, synthetic rubbers, and carbon blacks and are estimated to reduce overall Russian export revenues by almost $1.4 billion.


Batteries
Visualized: The Rise of the LFP Battery
In 2022, the EV sector’s market share of the LFP battery rose from just 6% in 2020 to 30%, highlighting its growing popularity.


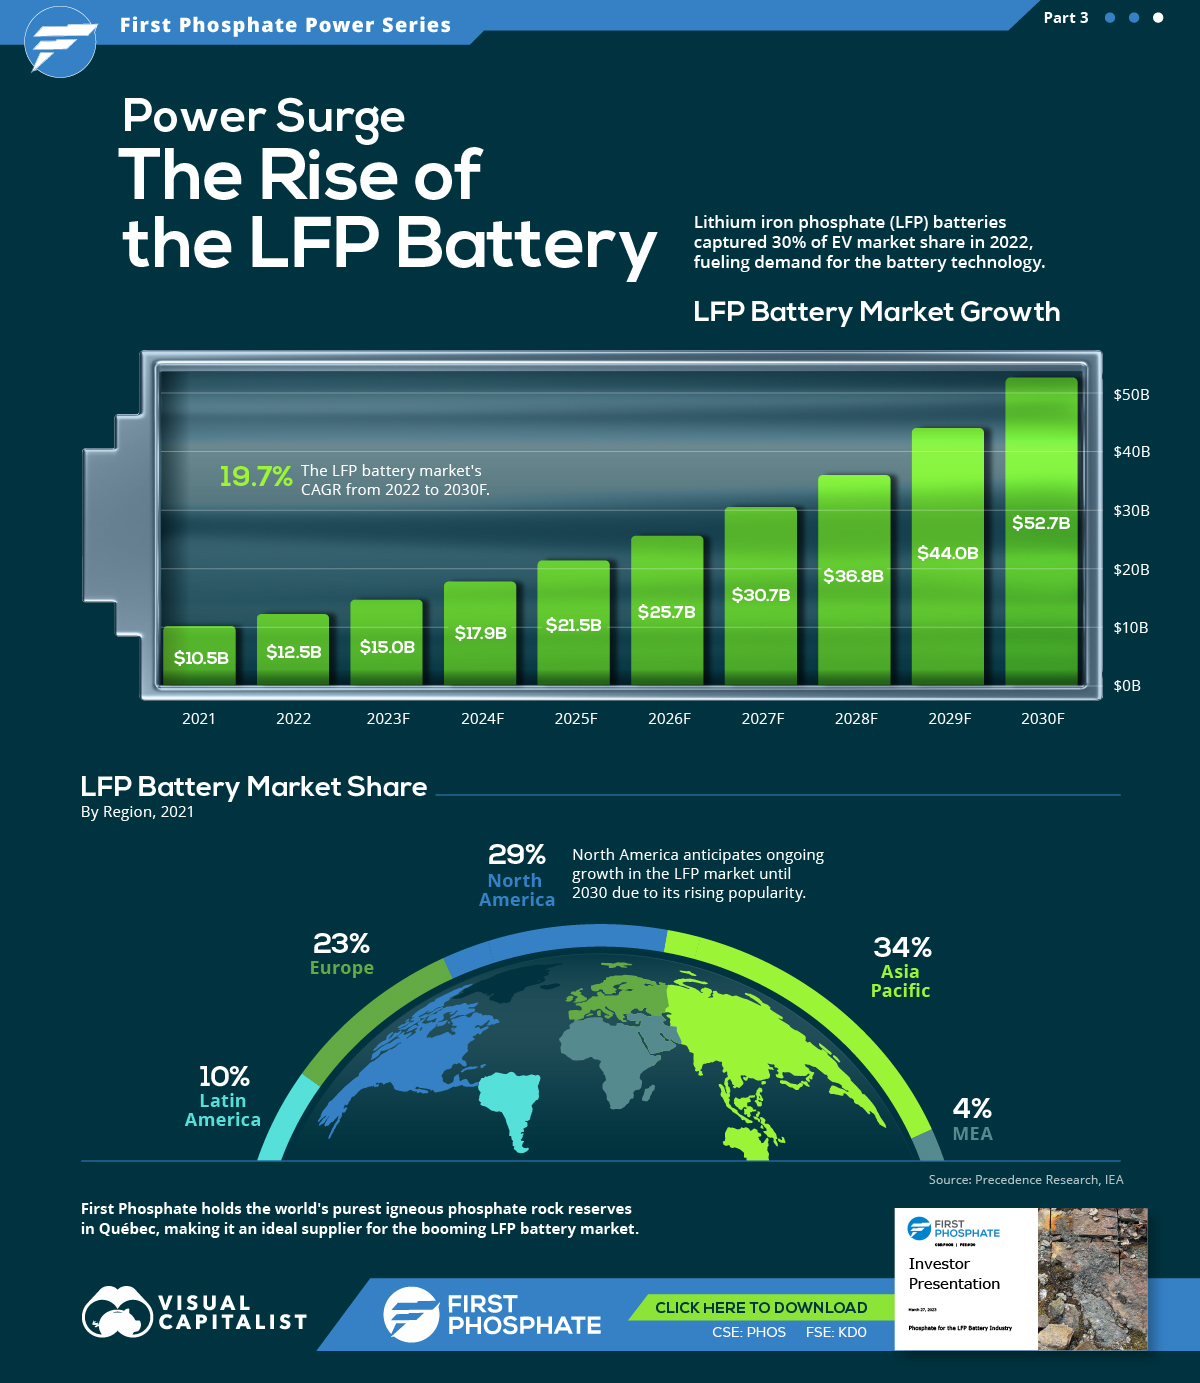
The Rise of the LFP Battery
Primarily a key component in fertilizers, phosphate is also essential to lithium iron phosphate (LFP) battery technology.
LFP is an emerging favorite in the expanding EV market, particularly in standard-range EVs. Factors driving this popularity include superior safety, longevity, cost-effectiveness, and environmental sustainability.
In this graphic, our sponsor First Phosphate looks at the growing LFP market, highlighting forecasted growth and current market share.
Market Growth
In 2022, the global LFP battery market stood at $12.5 billion. By 2030, this figure is expected to catapult to nearly $52.7 billion, signifying a CAGR of 19.7%.
| Year | USD (Billion) |
|---|---|
| 2021 | $10.5B |
| 2022 | $12.5B |
| 2023F | $15.0B |
| 2024F | $17.9B |
| 2025F | $21.5B |
| 2026F | $25.7B |
| 2027F | $30.7B |
| 2028F | $36.8B |
| 2029F | $44.0B |
| 2030F | $52.7B |
In 2022, LFP batteries cornered a sizable 30% of the EV market share from just 6% in 2020, demonstrating the growing appeal of this type of lithium-ion battery in the electric vehicle sector.
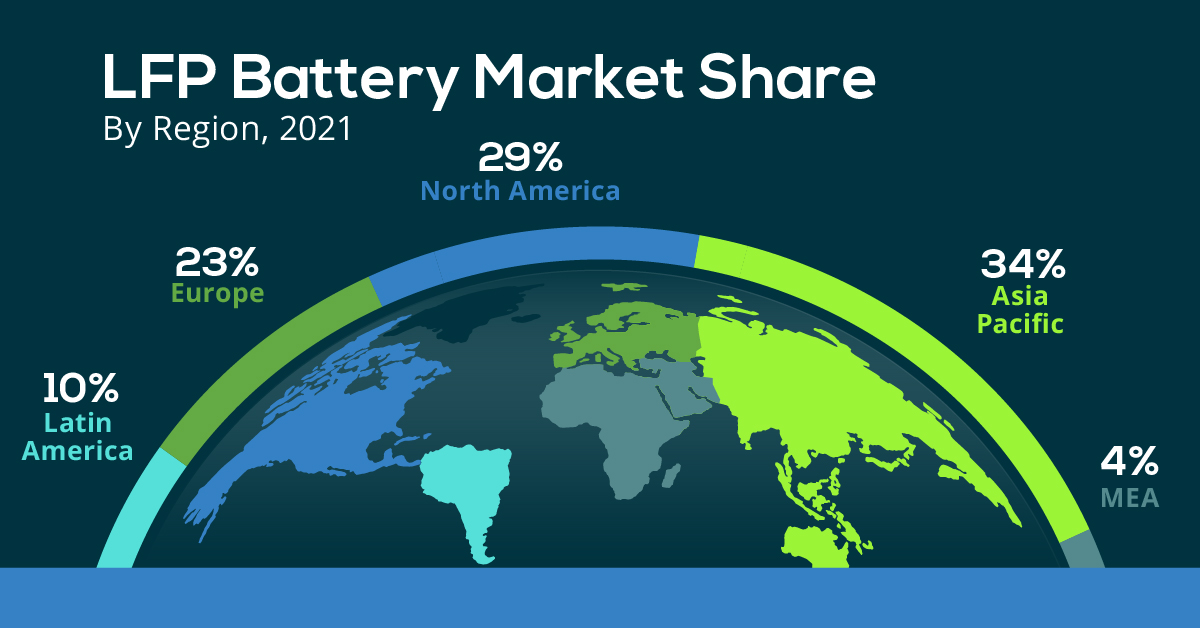
Market Share
The Asia Pacific region dominated the LFP battery market in 2021, accounting for over 34% of the global share.
| Regions | Revenue Share (%) |
|---|---|
| Asia Pacific | 34% |
| North America | 29% |
| Europe | 23% |
| Latin America | 10% |
| MEA | 4% |
Meanwhile, North America, with the second largest share, is projected to witness ongoing growth through 2030.
First Phosphate holds access to 1% of the world’s purest igneous rock phosphate reserves in Québec, making it an ideal supplier for the growing LFP market.

-

 Energy2 months ago
Mapped: Renewable Energy and Battery Installations in the U.S. in 2023
This graphic describes new U.S. renewable energy installations by state along with nameplate capacity, planned to come online in 2023.
-

 Energy2 months ago
How EV Adoption Will Impact Oil Consumption (2015-2025P)
How much oil is saved by adding electric vehicles into the mix? We look at data from 2015 to 2025P for different types of EVs.
-
 Energy3 months ago
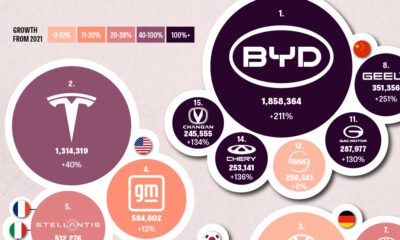
Global EV Production: BYD Surpasses Tesla
This graphic explores the latest EV production data for 2022, which shows BYD taking a massive step forward to surpass Tesla.
-

 Batteries6 months ago
Visualizing China’s Dominance in Battery Manufacturing (2022-2027P)
This infographic breaks down battery manufacturing capacity by country in 2022 and 2027.
-

 Energy7 months ago
Visualizing 25 Years of Lithium Production, by Country
Lithium production has grown exponentially over the last few decades. Which countries produce the most lithium, and how how has this mix evolved?
-
 Energy10 months ago
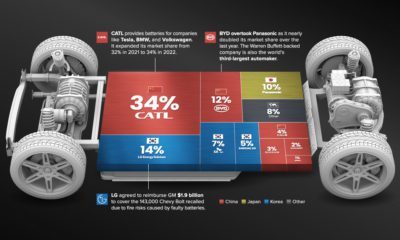
The Top 10 EV Battery Manufacturers in 2022
Despite efforts from the U.S. and Europe to increase the domestic production of batteries, the market is still dominated by Asian suppliers.


-

 Markets2 weeks ago
Ranked: The Most Profitable U.S. Companies, by Sector
-

 apps5 days ago
How Long it Took for Popular Apps to Reach 100 Million Users
-

 Markets4 weeks ago
The World’s Biggest Mutual Fund and ETF Providers
-

 Markets2 weeks ago
Brand Reputations: Ranking the Best and Worst in 2023
-

 Environment5 days ago
Hotter Than Ever: 2023 Sets New Global Temperature Records
-

 Datastream4 weeks ago
Can You Calculate Your Daily Carbon Footprint?
-

 Energy2 weeks ago
Who’s Still Buying Russian Fossil Fuels in 2023?
-

 VC+5 days ago
What’s New on VC+ in July